
A target for the bounce to end was given in last analysis at 47.96 to 48.91. Price reached up to 47.74, just 0.22 short of the target.
Summary: The bounce now looks likely to be over. This is supported by short term volume and divergence with volatility. If the orange channel on the daily Elliott wave chart is breached, then have more confidence in this view. The next target is at 35.82.
Always use a stop. Invest only 1-5% of equity on any one trade.
New updates to this analysis are in bold.
MONTHLY ELLIOTT WAVE COUNT
Click chart to enlarge.
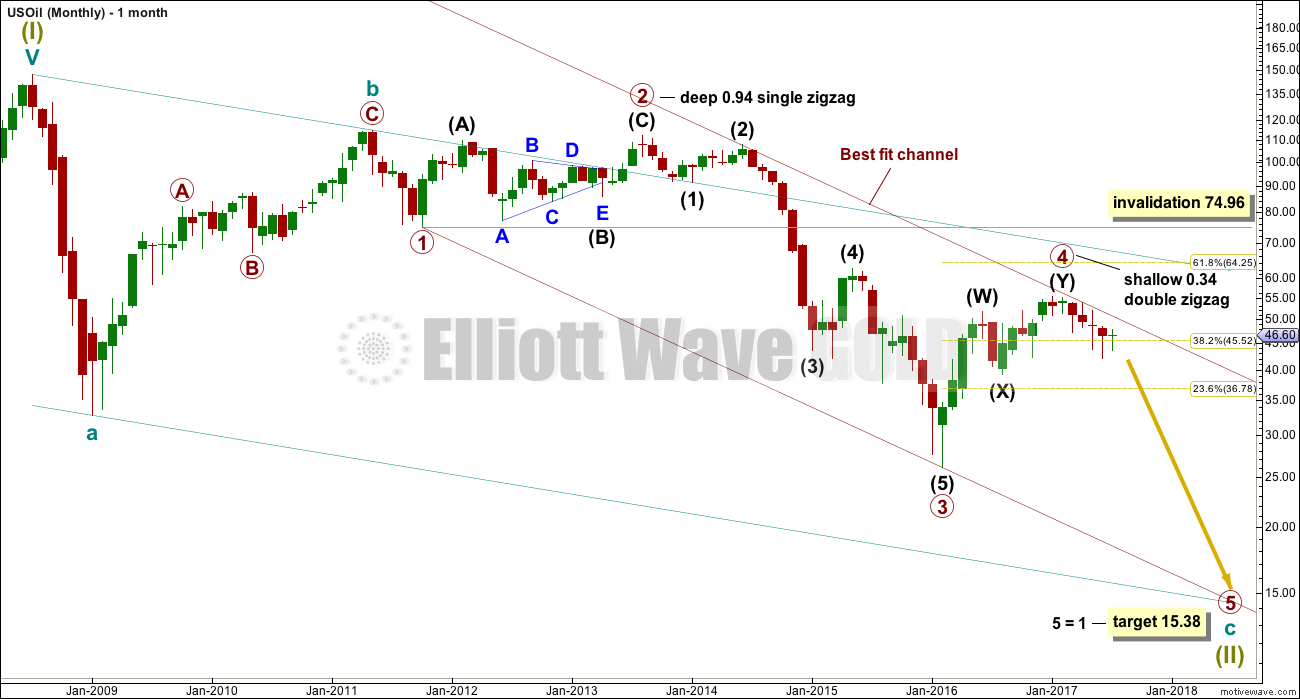
Within the bear market, cycle wave b is seen as ending in May 2011. Thereafter, a five wave structure downwards for cycle wave c begins.
Primary wave 1 is a short impulse lasting five months. Primary wave 2 is a very deep 0.94 zigzag lasting 22 months. Primary wave 3 is a complete impulse with no Fibonacci ratio to primary wave 1. It lasted 30 months.
There is alternation in depth with primary wave 2 very deep and primary wave 4 shallow. There is inadequate alternation in structure, both are of the zigzag family, but there is some alternation within structure. Primary wave 2 is a single zigzag and the triangle for intermediate wave (B) gives it a sideways look. Primary wave 4 is a sharper and quicker double zigzag.
If it continues as per the alternate, then primary wave 4 may not move into primary wave 1 price territory above 74.96.
WEEKLY ELLIOTT WAVE COUNT
Click chart to enlarge.
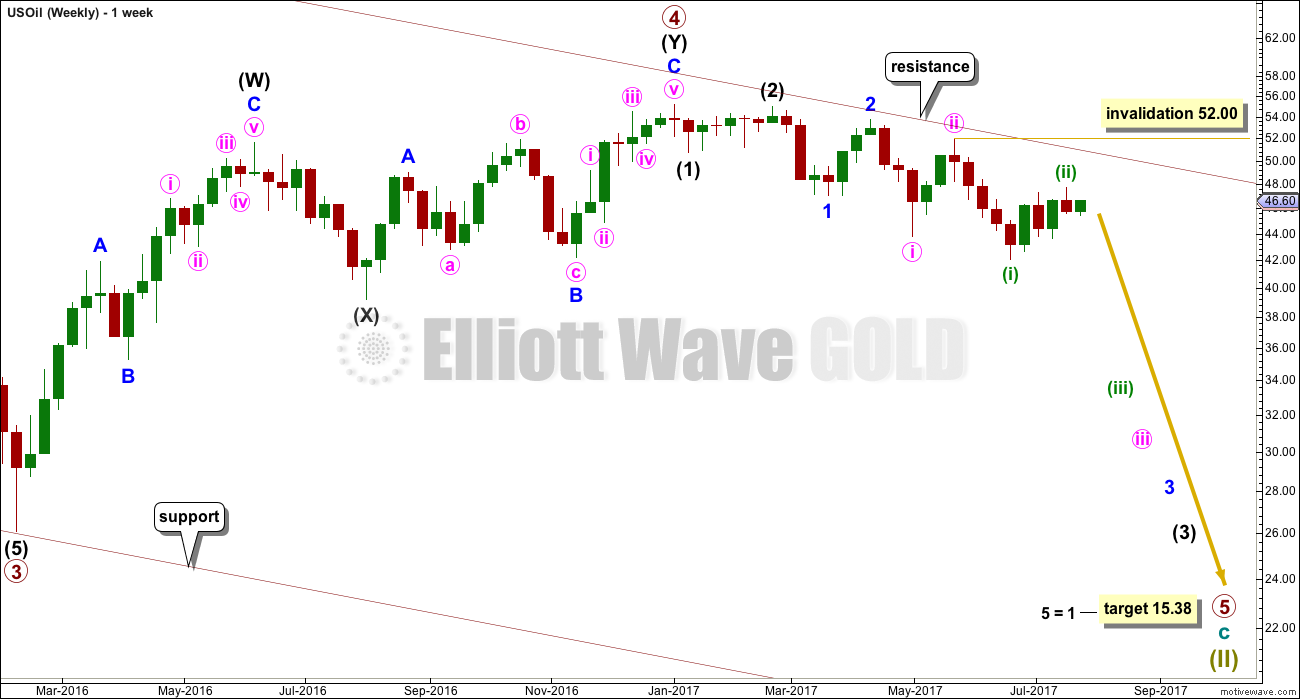
Primary wave 5 looks like it may beginning very typically with a series of overlapping first and second waves. The third wave within it looks to be extending. It should be expected that within one or more of these third waves that their fifth waves may be very strong and sharp, ending with selling climaxes typical of commodities.
Minuette wave (ii) may not move beyond the start of minuette wave (i) above 52.00.
DAILY ELLIOTT WAVE COUNT
Click chart to enlarge.
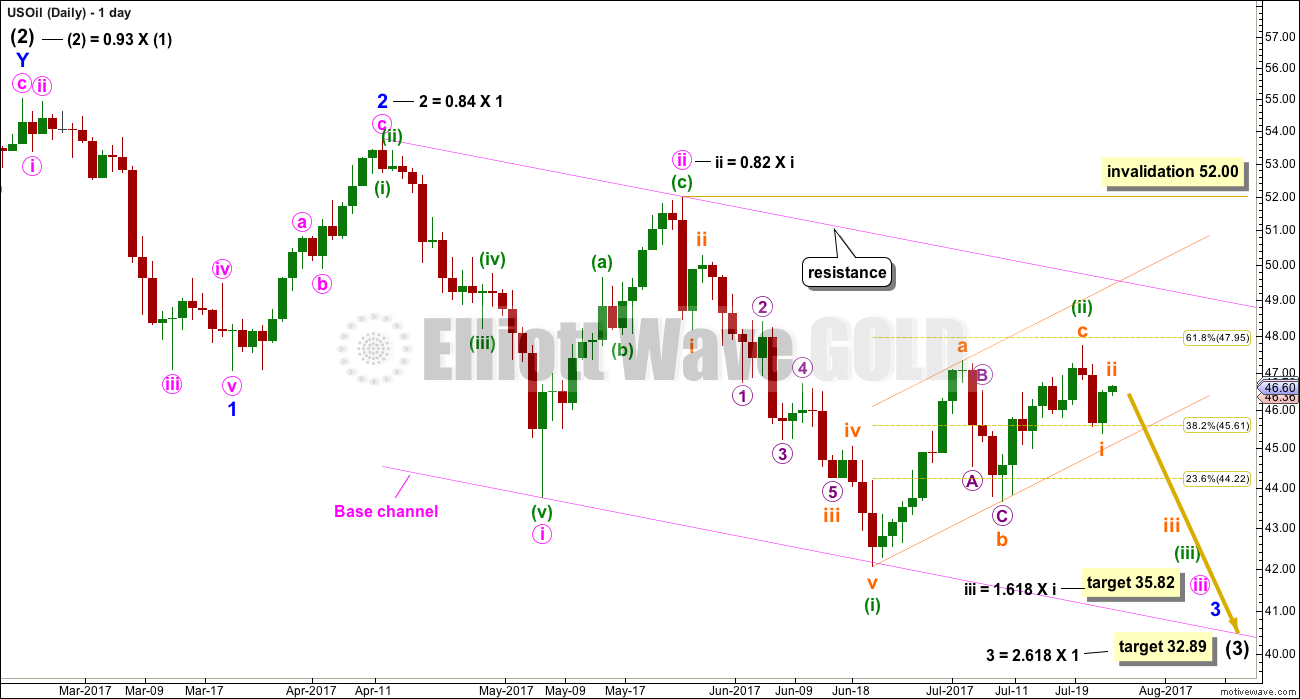
Primary wave 5 must subdivide as a five wave motive structure, either an impulse or an ending diagonal. With the overlapping of first and second waves so far, it looks very much like the more common impulse may be unfolding.
It looks likely that minuette wave (ii) is now over, just slightly short of the target. The structure looks like a large exaggerated three wave movement.
Minuette wave (ii) should find very strong resistance at the upper edge of the pink base channel. Lower degree second waves should not breach base channels drawn about first and second waves one or more degrees higher.
Minuette wave (ii) may not move beyond the start of minuette wave (i) above 52.00.
When price has broken below the orange channel containing minuette wave (ii), that may be taken as confirmation that the bounce is over and the next wave down has begun. But if price does continue any higher, it may come up to touch the upper edge of the pink channel, and that should be used as an entry opportunity to join the downwards trend. Stops may be set a little above the pink trend line (allow for overshoots). But if that line is breached, then short positions should be exited.
ALTERNATE WEEKLY ELLIOTT WAVE COUNT
Click chart to enlarge.
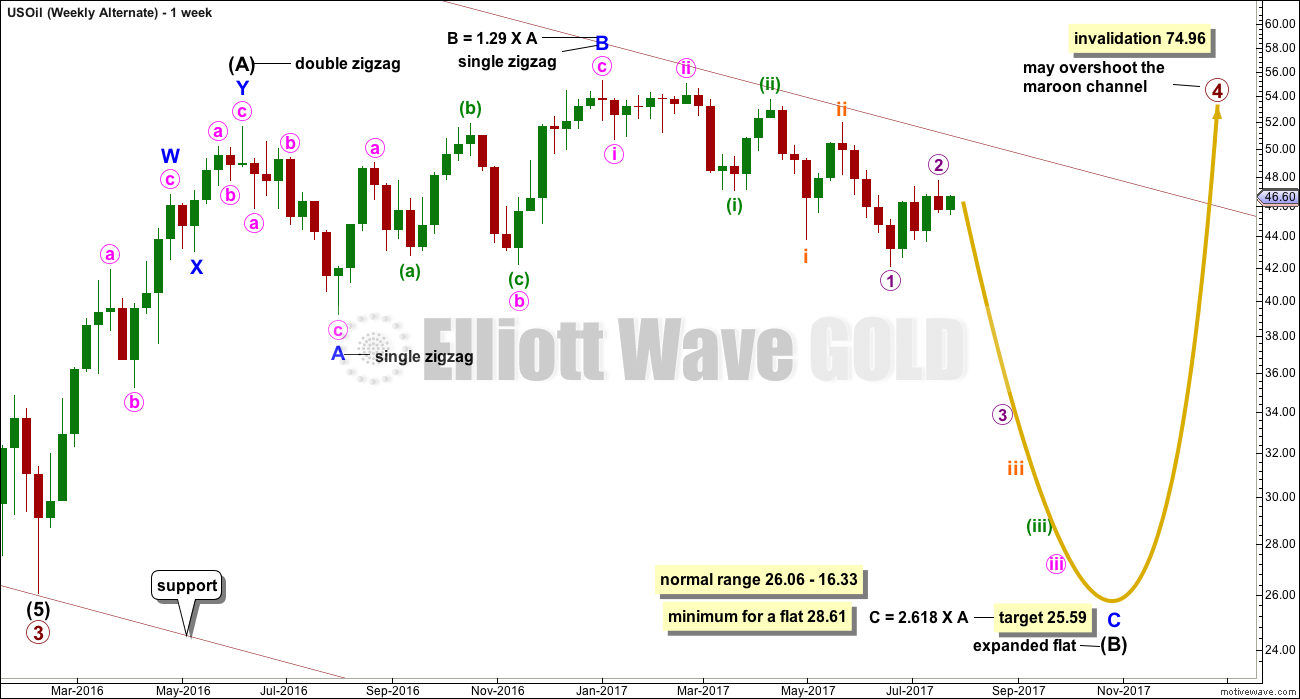
It will remain possible but less likely that primary wave 4 could continue and substantially breach the upper edge of the maroon channel at its end.
The whole structure of primary wave 4 is seen here in more detail.
The first wave labelled intermediate wave (A) is seen as a double zigzag, which is classified as a three.
Intermediate wave (B) is also a three. This means primary wave 4 is most likely unfolding as a flat correction if my analysis of intermediate wave (A) is correct. Flats are very common structures.
Intermediate wave (B) began with a zigzag downwards. This indicates it too is unfolding most likely as a flat correction.
Within intermediate wave (B), the zigzag upwards for minor wave B is a 1.29 correction of minor wave A. This indicates intermediate wave (B) may be unfolding as an expanded flat, the most common type.
The normal range for intermediate wave (B) within a flat correction for primary wave 4 is from 1 to 1.38 the length of intermediate wave (A) giving a range from 26.06 to 16.33.
Primary wave 4 may not move into primary wave 1 price territory above 74.96.
Within the larger expanded flat correction of primary wave 4, intermediate wave (B) must retrace a minimum 0.9 length of intermediate wave (A) at 28.61 or below.
Because there is no divergence in expected direction nor structure for several weeks between this alternate wave count and the main wave count, only one daily chart will be published for the main wave count.
TECHNICAL ANALYSIS
DAILY CHART
Click chart to enlarge. Chart courtesy of StockCharts.com.
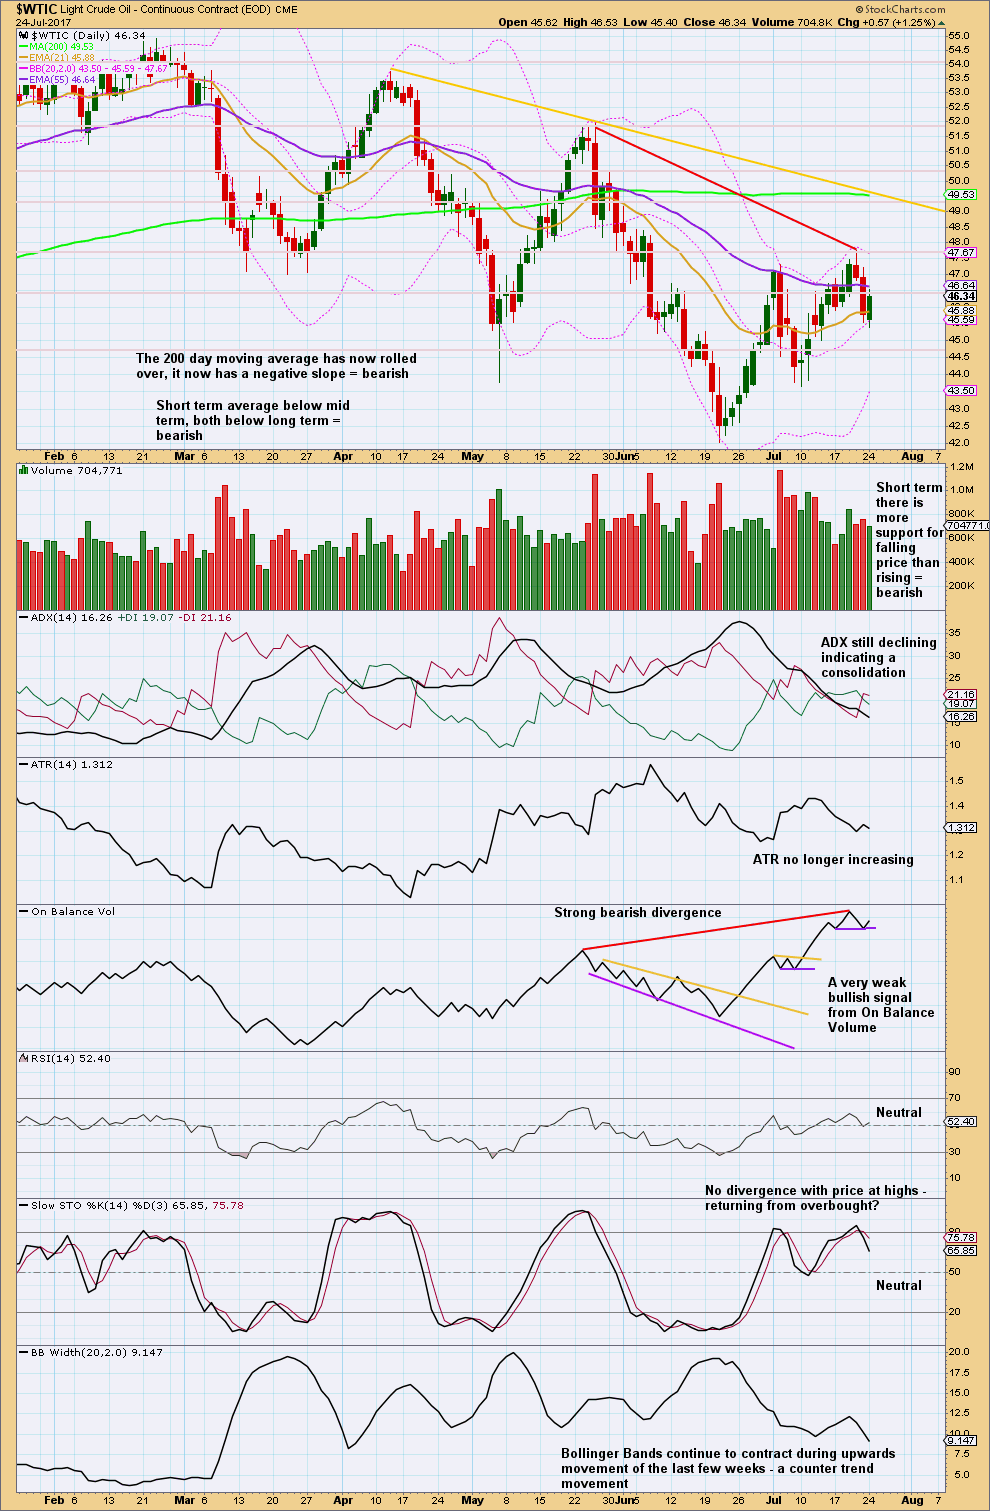
Oil has been making a series of lower lows and lower highs since February. The moving average picture is now fully bearish.
If On Balance Volume breaks below the purple line, it would offer a weak bearish signal.
With RSI and Stochastics both neutral, there is plenty of room for price to rise or fall.
Bollinger Bands and ATR agree that upwards movement looks like a counter trend movement (downwards movement looks more like a normal trend).
VOLATILITY INDEX
Click chart to enlarge. Chart courtesy of StockCharts.com.
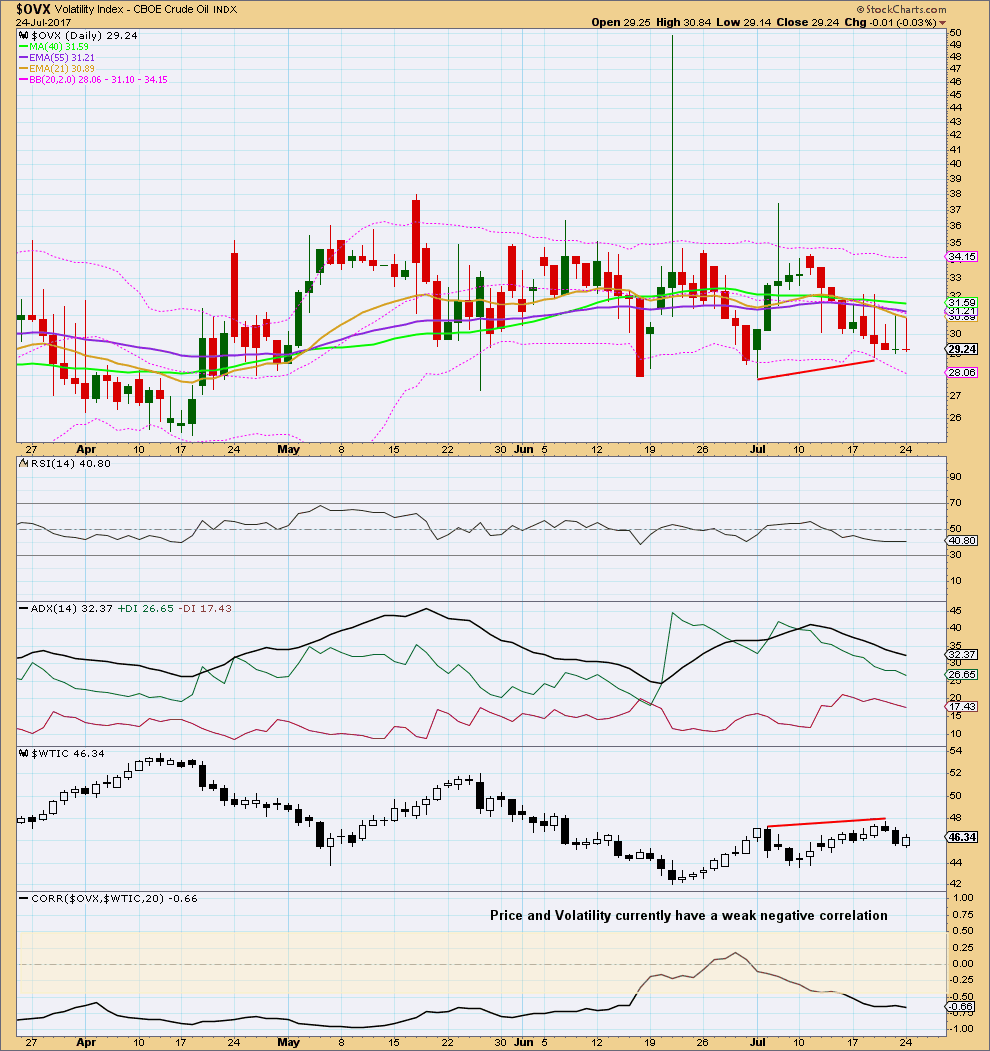
Normally, volatility should decline as price rises and volatility should increase as price falls. Divergence from this normal can provide a bullish or bearish signal for Oil. However, it is noted that this signal occurs both in minor and major lows and it cannot be used to distinguish between them.
At this time, volatility and price have a weak negative correlation.
There is some bearish divergence this week between the last two swing highs / lows for price and volatility: price made a slightly higher high, but volatility did not show a corresponding decline. This indicates weakness within upwards movement from price, and this supports the Elliott wave count.
Published @ 04:26 a.m. EST.
Lara, one last chart capture from J Kennedy’s free Friday video. Once again, different EWI analyst with a different count. Obviously EWI can’t agree on a count!
Anyway, I’m perplexed by this. Why would he show a major (B) wave truncation?
If C within (B) is a five wave structure (as it must be) then the fourth wave within it may be a running contracting triangle. The high within C may be wave B of the triangle. Wave 5 of C would then end slightly above wave 3, avoiding a truncation.
Awe, very good, didn’t see that. This may be a good count then, explaining the deep retrace
So I’m considering what if that trend line is breached? What else could be happening?
Perhaps minor 2 wasn’t over and is continuing as an even deeper expanded flat.
next is to take a look at the EWI ideas below that Dreamer has posted.
Oil certainly looks very bullish, question now is will there be a pull back on the way to 52-53? As it is certainly too scary to go long at this price point unless we have a pullback
Lara, wouldn’t that make Minor 2 way out of proportion to Intermediate wave 2, questioning the right look?
Yes. It would 🙁
Back to the drawing board
I am very concerned at the small movement above the pink trend line on the daily chart. That in conjunction with the prior two daily candlesticks having long lower wicks… this looks too bullish for a high here.
The more I look at the chart, the more it looks like oil just broke out of that long term descending channel between Lara’s two pink lines. I can clearly see ABCDE between that pink channel. And with the consolidation of minutte ii) which makes it potentially bullish. I’m not sure how high it can go but technical , if you measure the bottom of A to the top of the trend line and then add that to the breakout point it gives $55+ oil. Lara is this possible from an EW point of view?
Did a bit of googling, and the ABCDE between the pink channels is called the 3 drives pattern which is considered bullish.
Here’s the breakout from the descending trendline of oil. Any thoughts?
Is this the beginning of OIL pulling back to around 47.70 before another leg up to high 50-51?
Good chance we will get a high for oil today as downtrend and uptrend lines cross today on daily chart. Time to try a punt at the short side by end of day with a stop loss to cover with convincing breach of downtrend line above 49.5, 200dma.
Weekly
Lara, what do you think about their possible triangle?
I think its far too soon to try and label a triangle like that.
It would still expect a huge breach of the channel.
Daily look
Lara, what do you think of their leading diagonal as opposed to multiple 1st / 2nd waves?
Thanks for the post and new ideas Dreamer…
It looks okay actually. I’ve charted it and will keep an eye on it.
Great. Thanks for taking a look.
As part of EWI’s free access week, they now have Oil charts available. Posting a couple here for review and discussion.
The 240 minute chart shows a possible contracting ending diagonal. Personally, I don’t see this as a high probability count. Why would a lower level 2nd wave extend beyond the trendline?
I’ve placed the exact same post in the Gold page as some members may not have access to, nor visit, this page.
===========================
US Oil Ichimoku Update
Data as at market close, July 25
===========================
Contrary to expectations, WTI crude oil price surged on Monday and Tuesday as the market celebrated the Saudi Arabia announcement of a production cut at the meeting of the OPEC and non-OPEC oil producers on Monday.
At Tuesday’s market close, oil prices had been trading above the 50-day SMA as well as the tenkan-sen and the kijun-sen. It had entered the cloud, almost touching the top cloud boundary at 47.03. Early this morning, oil prices did break above the top of the cloud boundary, changing the price trend from bearish to mildly bullish. At the same time, prices had broken above the higher line of the ascending broadening wedge pattern, invalidating the pattern. Now, the path is clear for a test of the purple downward sloping resistance line as well as the 200-day SMA at 49.52.
The price surge had been too far too fast, and a pullback would certainly be coming. Moreover, the red kumo provides a warning that it is not agreeable to the current price surge. Surely, prices would fall once they get rejected by either the purple downtrend resistance line or the 200-day SMA. And, if that were to occur, yours truly would be there to enter short, using the lower orange line as the initial support for the drop.
Thank you, Alan, for your excellent analysis. GL with your shorts.
Thank you
Alan, would you say that oil bounced off the purple line today? I’m seeing a high of 49.24.
Thanks in advance for your thoughts,
Jiten
Jiten, I have the same feeling too.
Crude oil torpedoes past 100 day SMA, and the upper Bollinger Band… it is currently just barely below the upper edge of the ichimoku cloud at 48.55.
API numbers showed a massive 10 million barrel withdrawal… that’s what did it. There was such huge discrepancy between the API and EIA numbers last week, so we have to wait and see what the EIA says tomorrow morning.
Well that didn’t go according to plan did it. This is why risk management is so vital folks. There’s no way I’m going to be always right.
And it’s also why for those more risk averse you may prefer to use channel breaches to add confidence before entering.
Anyway, I too have a loss this morning on Oil. And copper. Will wait now to see if Oil is going to come up to test the pink trend line again. If it does touch that line I’ll enter short, but only 1-3% of equity there. Leaving some powder dry to add to my position if it moves down strongly from the line. And minimising losses after a couple, another risk management idea: after a series of losses reduce position size of the next trades.
For now, let’s see if Oil can move higher to about 49. For the very adventurous and experienced traders amongst the membership, perhaps a quick scalp to the upside? Beware though, it’s risky. If the wave count is right this move is a second zigzag, the B wave down may take you out.
Got home to see my stoploss was rejected yesterday because market was closed anyone ever had this problem before? My volume was off and didn’t here the trade get rejected. Now I am really stuck in oil any thought on what to do Lara? I guess I should cut here but would like to catch the b wave down to recoup some losses
I’ve not had that problem. My stops are respected 24 hrs. That’s horrible that yours aren’t. That really does make risk management with that broker a nightmare for a 24 hour market.
IMO you have two choices.
1. Close it now, take the loss. Find another broker who can respect your stop loss orders 24 hrs if you’re trading a market which moves 24 hrs.
2. Hope to exit on a pullback. This is my less favoured strategy, because hope is not a good investment strategy.
Whatever you do, don’t let the loss run. You’re going to have to watch it carefully.
And if that’s how your broker behaves, I’d not be using them to trade a fast moving 24 hr market like Oil ever again.
stops are cancelled at close and cant be reentered until market is reopened 1hr later is how this was explained to me. I placed my stop order while market was closed so it was cancelled
…Or, defend your short position with an upside hedging long position.
I plan on entering short at 49 in futures…
Sorry Kyong, what does that mean?
DWT is 3x inverse of oil. Volatility is high. I am adding to my position as long as the price stays in the falling wedge.
USO 9.78. DWT 29.72; I am adding to my short position
Gunslinger! 🙂
I will be joining you at my trigger of 49 spot…
I could make a lot of money by advising people to do the opposite to what I do.
I think I will set up a website.
🙂 Sure. If you do, then I’ll exchange links with you 🙂
You could call it “The Contrarian”?
Yeh, I agree.
Oil looks too strong to short yet. Looks like it’s going higher toward the pink line @ about $49
Yes Dreamer, it sure looks that way. I guess it all depends on the API and EIA numbers both coming out within the next 24 hours… but this bounce is very strong at the moment…
Uh Huh! 🙂
stopped out now!
Me too 🙁
Thank you for the update. 47.19 now. I guess I got in a bit earlier. I will wait and see.
looks like its broken its upward channel. Lets see if it goes down from here
I dont think minuette wave (ii) is over.
What were the to reversalprice points posted by a member last week I think it was Allen? I wish comments would stay up for more than 8 days
47.10 looks like a good spot to short here brandon
I would wait for 49…
Comments are always available to read on old posts. The older posts just close to new comments.
Thanks for this, Lara. A lot of movement in oil, so nice to have your EW-view on a regular basis. Wouldn’t mind an hourly chart, as well:)
Thanks for the timely update Lara.