
Downwards movement has unfolded as expected for Monday’s session.
Summary: A pullback may end within the next few hours about 1,275. If this is how price behaves, it may offer us an entry opportunity to join the upwards trend. The final target is now at 1,320.
Always use a stop. Invest only 1-5% of equity on any one trade.
New updates to this analysis are in bold.
Last monthly charts and alternate weekly charts are here, video is here.
Grand SuperCycle analysis is here.
MAIN ELLIOTT WAVE COUNT
WEEKLY CHART
Click chart to enlarge.
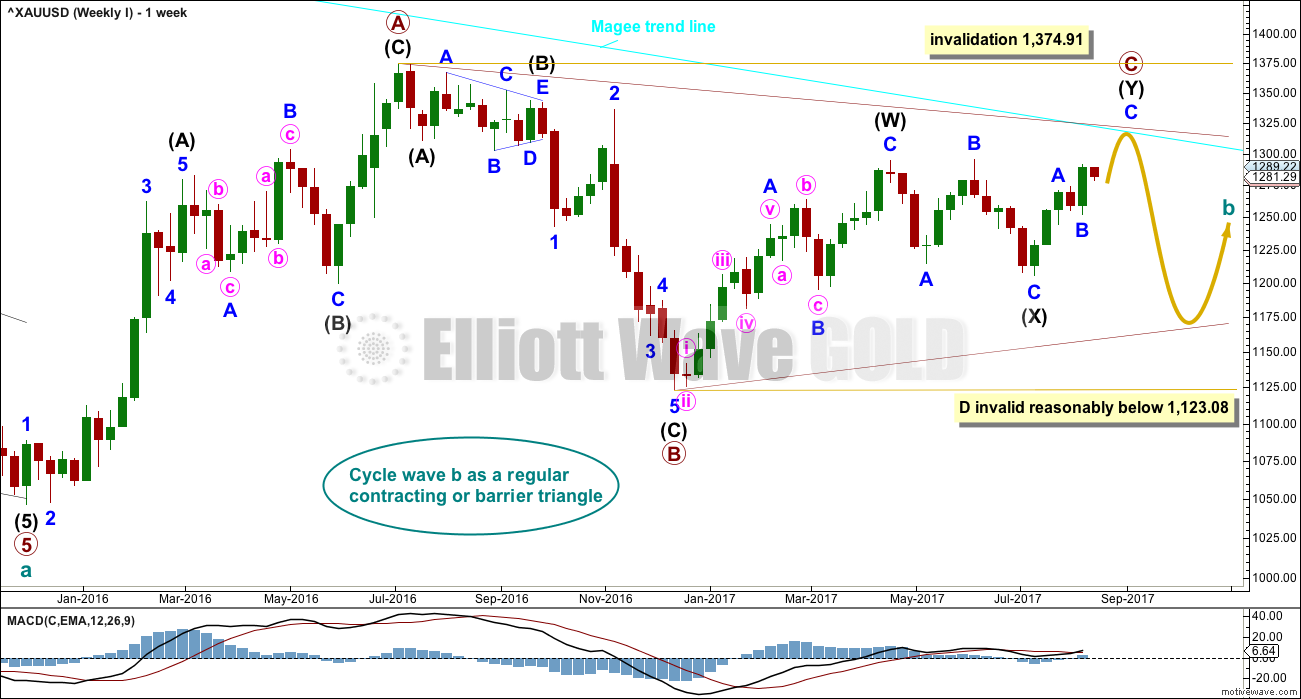
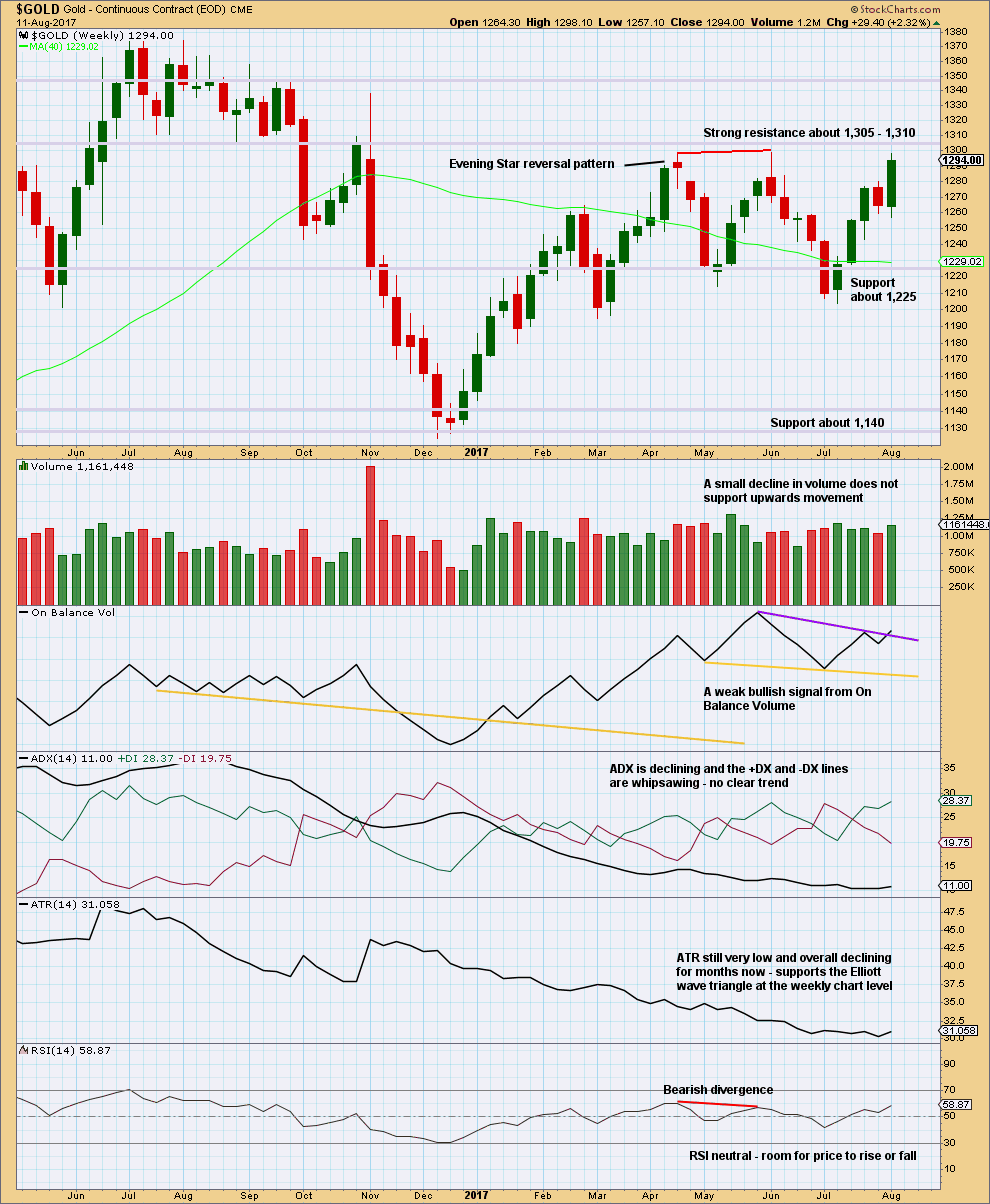
The Magee bear market trend line is added to the weekly charts. This cyan line is drawn from the all time high for Gold on the 6th of September, 2011, to the first major swing high within the following bear market on the 5th of October, 2012. This line should provide strong resistance.
At this stage, a triangle still looks possible and has the best fit for cycle wave b. It has some support from declining ATR and MACD now beginning to hover about zero.
Within a triangle, one sub-wave should be a more complicated multiple, which may be primary wave C. This is the most common sub-wave of the triangle to subdivide into a multiple.
Intermediate wave (Y) now looks like a developing zigzag at the weekly chart level, and minor wave B within it shows up with one red weekly candlestick. Primary wave C may end at the Magee trend line.
Primary wave D of a contracting triangle may not move beyond the end of primary wave B below 1,123.08. Contracting triangles are the most common variety.
Primary wave D of a barrier triangle should end about the same level as primary wave B at 1,123.08, so that the B-D trend line remains essentially flat. This involves some subjectivity; price may move slightly below 1,123.08 and the triangle wave count may remain valid. This is the only Elliott wave rule which is not black and white.
Finally, primary wave E of a contracting or barrier triangle may not move beyond the end of primary wave C above 1,295.65. Primary wave E would most likely fall short of the A-C trend line. But if it does not end there, then it can slightly overshoot that trend line.
Primary wave A lasted 31 weeks, primary wave B lasted 23 weeks, and primary wave C may now have just completed its 34th week. A double zigzag may be expected to be longer lasting than single zigzags within a triangle, and so this continuation of primary wave C is entirely acceptable and leaves the wave count with the right look at this time frame.
DAILY CHART
Click chart to enlarge.
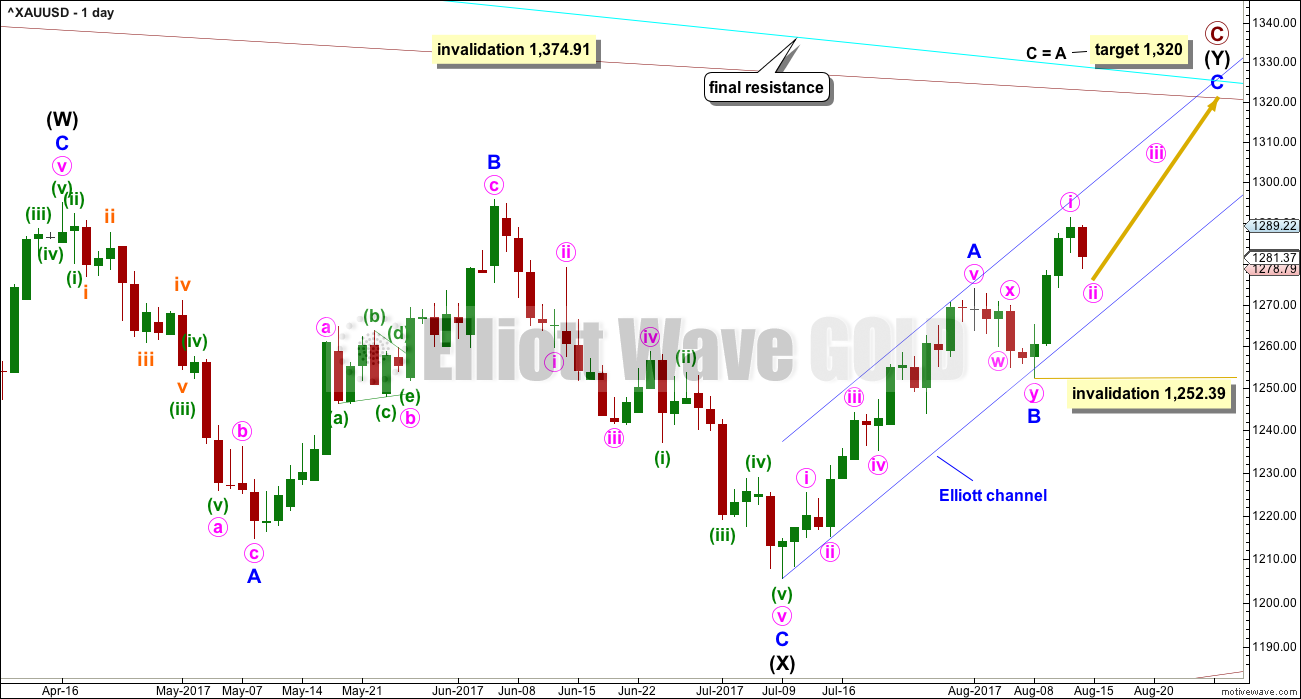
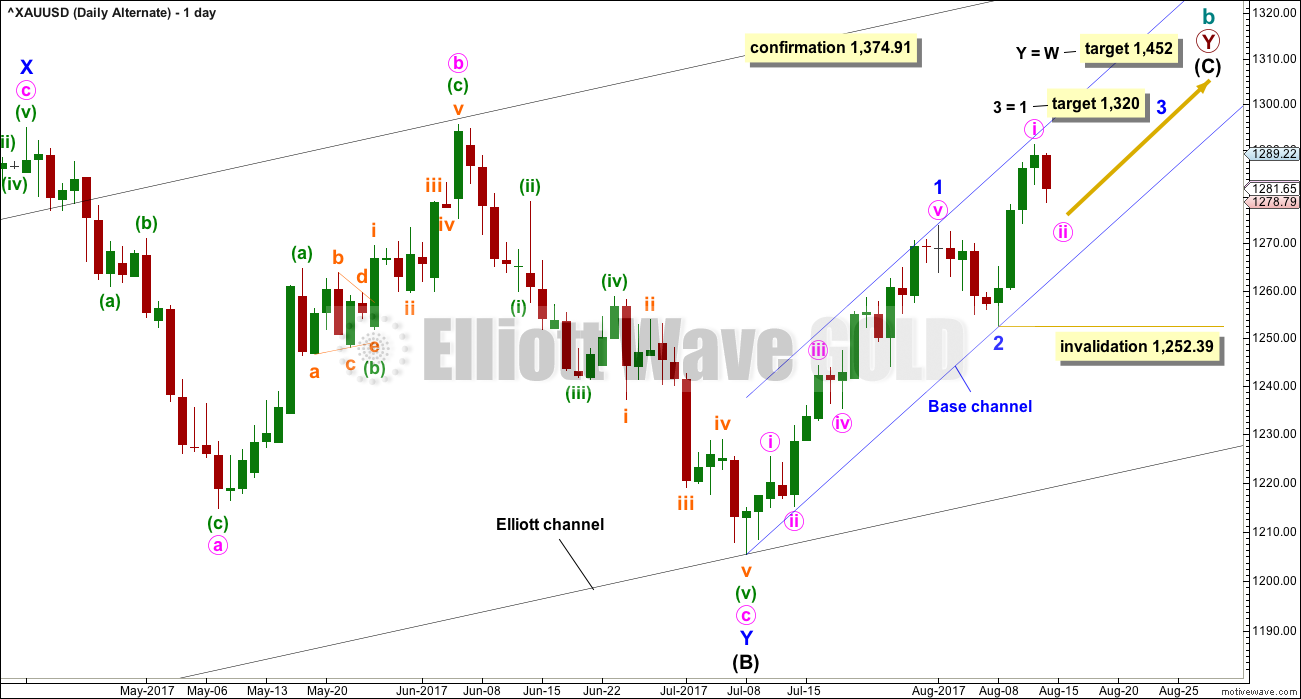
A target for primary wave C to end is calculated using the most common Fibonacci ratio between minor waves A and C. If the target is wrong, it may be too high; there is very strong resistance about 1,305 to 1,310.
Within minor wave C, no second wave correction may move beyond the start of its first wave below 1,252.39. Along the way up, corrections should find final support at the lower edge of the blue Elliott channel.
Minor wave C may only unfold as a five wave structure, either an impulse or an ending diagonal. An impulse is much more common and will be expected until shown otherwise by price.
Within an impulse for minor wave C, the corrections of minute waves ii and iv would most likely show up on the daily chart, like they do within minor wave A. Minute waves ii and iv within minor wave A both lasted two sessions, so they may also last about two to three sessions within minor wave C.
Minute wave ii now shows up with one red daily candlestick. If it ends within the next 24 hours, then it would have a typical look at this time frame.
Minute wave ii may be used as an entry opportunity to join the current upwards trend.
HOURLY CHART
Click chart to enlarge.
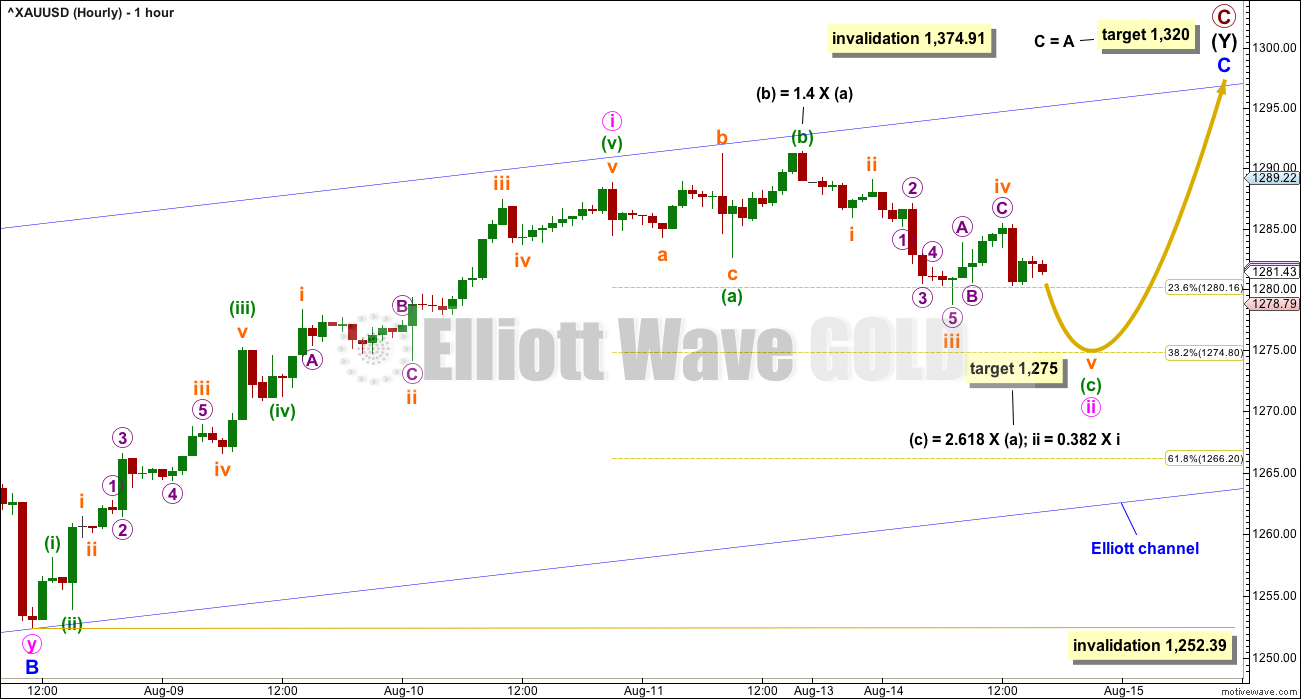
Minute wave ii may be unfolding as an expanded flat correction; these are very common structures. Minute wave ii may not move beyond the start of minute wave i below 1,252.39. But if it is deep, it should find very strong support above the invalidation point at the blue trend line.
A target is calculated for minute wave ii to end at two wave degrees.
Within minute wave ii, so far the five down for minuette wave (c) looks incomplete; it looks like it needs a final fifth wave.
ALTERNATE ELLIOTT WAVE COUNT
WEEKLY CHART
Click chart to enlarge.
This wave count has been published only in historical analysis. At this stage, it will be published on a daily basis.
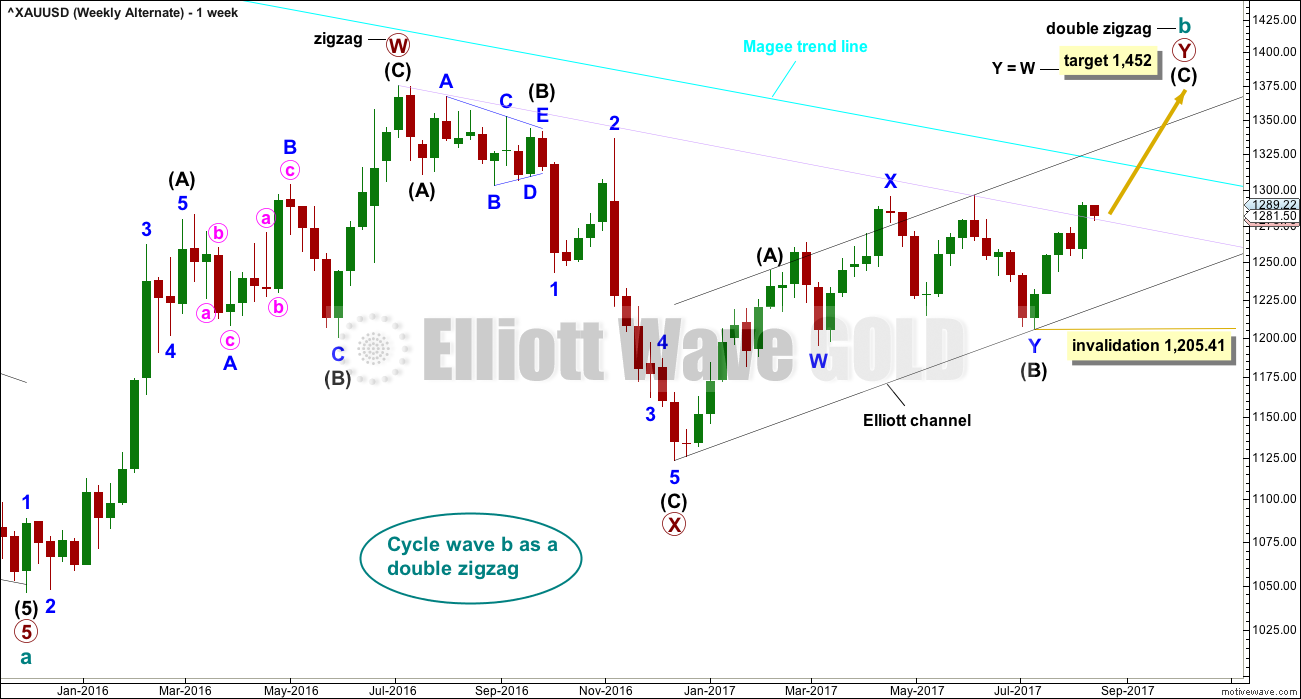
There are more than 23 possible corrective structures that B waves may take, and although cycle wave b fits best at this stage as a triangle (main wave count), it may still be another structure. This wave count looks at the possibility that it may be a double zigzag.
If cycle wave b is a double zigzag, then current upwards movement may be part of the second zigzag in the double, labelled primary wave Y.
The target remains the same as previously published for this wave count.
Along the way up, some resistance should be expected at the cyan Magee trend line. Because this wave count requires price to break above the Magee trend line, it must be judged to have a lower probability for this reason. This trend line is tested multiple times and goes back to 2011. It is reasonable to expect price to find resistance there, until proven otherwise.
Within intermediate wave (C), no second wave correction may move beyond the start of its first wave below 1,205.41.
DAILY CHART
Click chart to enlarge.
Intermediate wave (C) may be unfolding as an impulse.
Only minor wave 1 may have been over at the last high. Minor wave 2 may have begun. Minor wave 2 today may be continuing further as an expanded flat correction. It would be possible to label it over at the last low, but that would see minor wave 2 remarkably brief and shallow. It would still have better proportion and be of more normal depth if it continued as a very common expanded flat.
Minor wave 2 may not move beyond the start of minor wave 1 below 1,205.41.
A-B-C of a zigzag subdivides 5-3-5, exactly the same as 1-2-3 of an unfolding impulse. The hourly chart now for both Elliott wave counts would be exactly the same in terms of subdivisions and short term expectations. The blue channel which should provide support for any deep pullbacks would also be exactly the same.
TECHNICAL ANALYSIS
WEEKLY CHART
Click chart to enlarge. Chart courtesy of StockCharts.com.
Last upwards week has support from volume. Look out for strong resistance now close by. A pullback about 1,305 to 1,310 is a reasonable expectation.
On Balance Volume gives a weak bullish signal. This supports both Elliott wave counts.
ADX and ATR both support the main weekly Elliott wave count. This is what a triangle should look like.
DAILY CHART
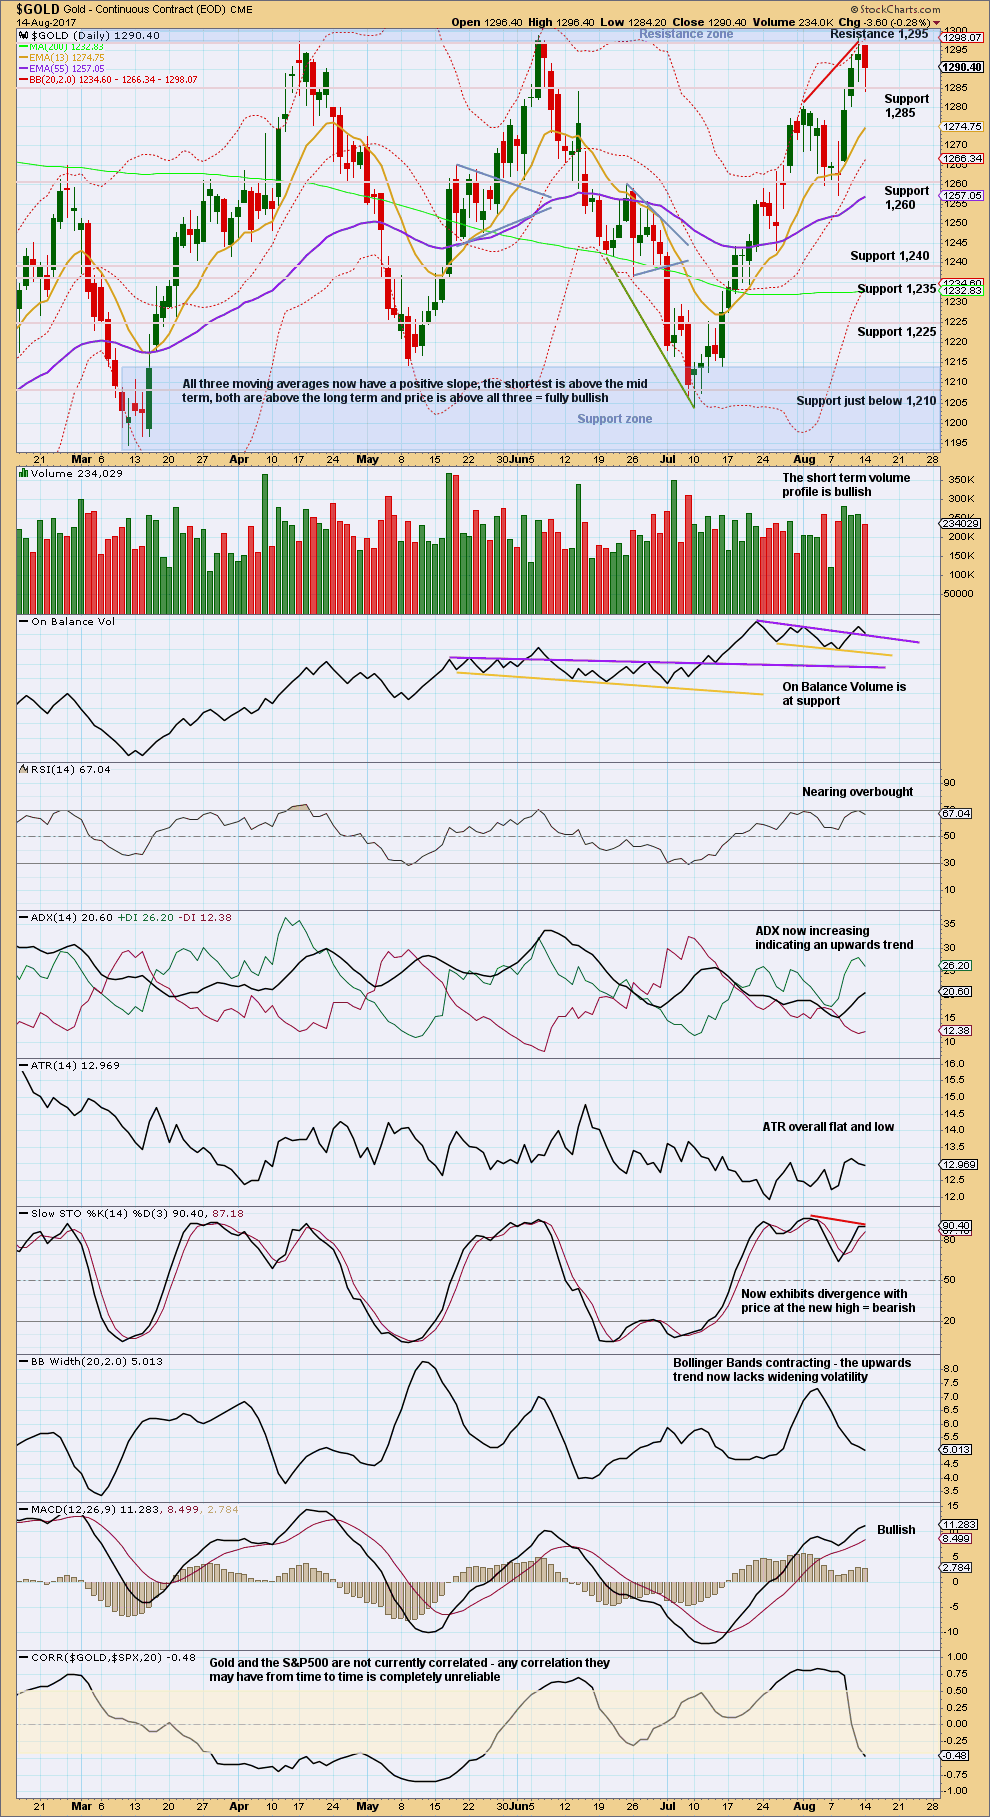
Click chart to enlarge. Chart courtesy of StockCharts.com.
The long lower wick today is bullish. In the short term, the volume profile is bullish. On Balance Volume today may be assisting to provide support for a pullback.
Upside may be limited. There is still very strong resistance ahead at 1,305- 1,310. RSI is very close to overbought, but it can move higher and remain extreme for a little while.
GDX
DAILY CHART
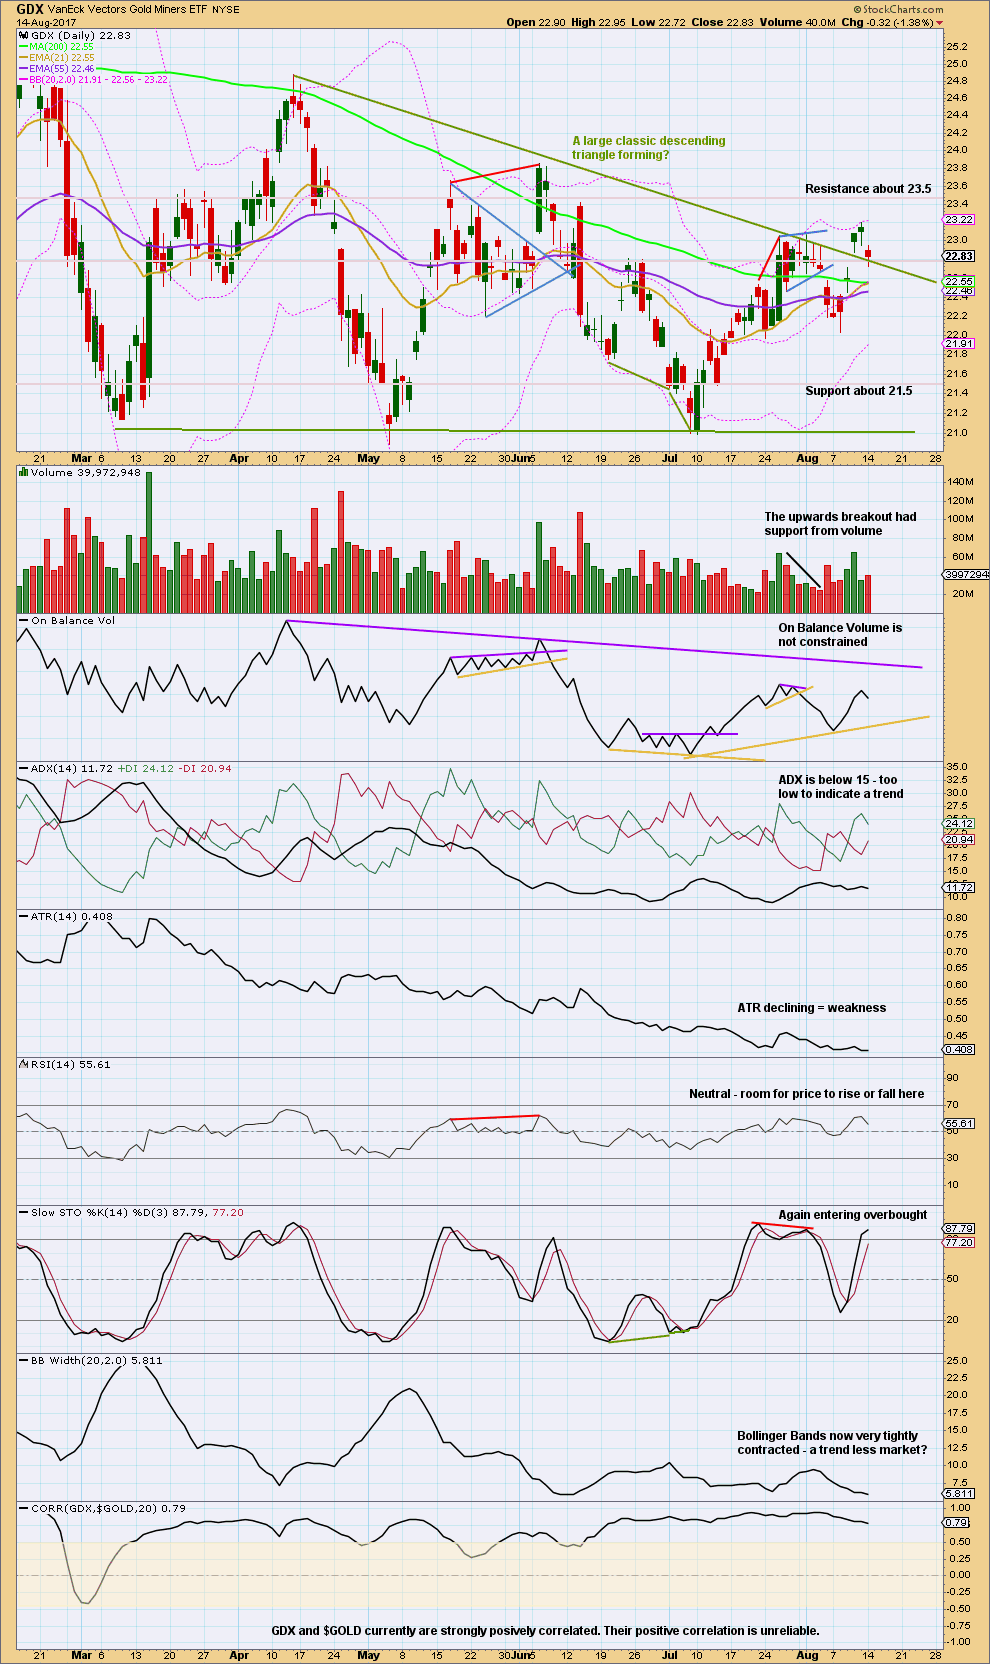
Click chart to enlarge. Chart courtesy of StockCharts.com.
For the very short term, GDX may move a little lower. Today’s downwards session has some support from volume. So far this looks like a typical curve down to test support at prior resistance.
So far the market is trendless, as a large descending triangle completed. Price may have broken out upwards. If this is correct, then price action should now start to show and increase in ATR and a widening of Bollinger Bands if a trend is returning. So far that has not happened.
Published @ 08:30 p.m. EST.
Technical Analysis section updated @ 09:18 p.m. EST.
Updated hourly chart:
The structure for the pullback is now complete. Price is still within the channel and now close to the lower edge.
If the trend remains up then this is a perfect opportunity to jump in long. Stops just below the channel please, invest only 1-5% of equity on this one trade.
If I’m wrong you want to be out if that channel is breached. That would be the first and strong warning that I’m wrong.
Gold may have completed a triangle last night for Micro 4 of Subminuette 5. If so, the sharp move down to 1,267.72 may be the end of Minute 2. Minute 2 then ends up being a deep retrace near the .618 Fib.
Need to see if gold can work it’s way higher now.
That’s exactly what I thought when I opened my charts this morning Dreamer 🙂
👍 😎
My bet is the EW channel or even invalidation 1252.39$ will be tested.
GDX moved down today with a slight volume increase. My target was slightly exceeded by .10 and it looks like one more slight new low may be needed to complete the correction.
If this is correct, first thing in the AM may be a good buying opportunity. That said, the purple trendline needs to be broken to the upside for more confidence in this short term bullish count. The purple trendline has been in place for over 6 months since early February, so it caries some significance.
A breakdown of the purple channel around 22.28 would be the first sign that this count is likely wrong and GDX is going lower. 22.03 is the official invalidation of this count.
Good luck trading this treacherous market!
https://www.tradingview.com/x/3Moeo4cJ/
Thank you Dreamer for sharing your work 🙂
Awesome work, Lara. Thanks for putting in the extra effort during this price action.
You’re welcome 🙂