
Another upwards day was expected by both Elliott wave counts.
Summary: The upwards trend now looks choppy and overlapping, so it may be a diagonal nearing its end. The target at 1,320 may be too high.
Always use a stop. Invest only 1-5% of equity on any one trade.
New updates to this analysis are in bold.
Last monthly charts and alternate weekly charts are here, video is here.
Grand SuperCycle analysis is here.
MAIN ELLIOTT WAVE COUNT
WEEKLY CHART
Click chart to enlarge.
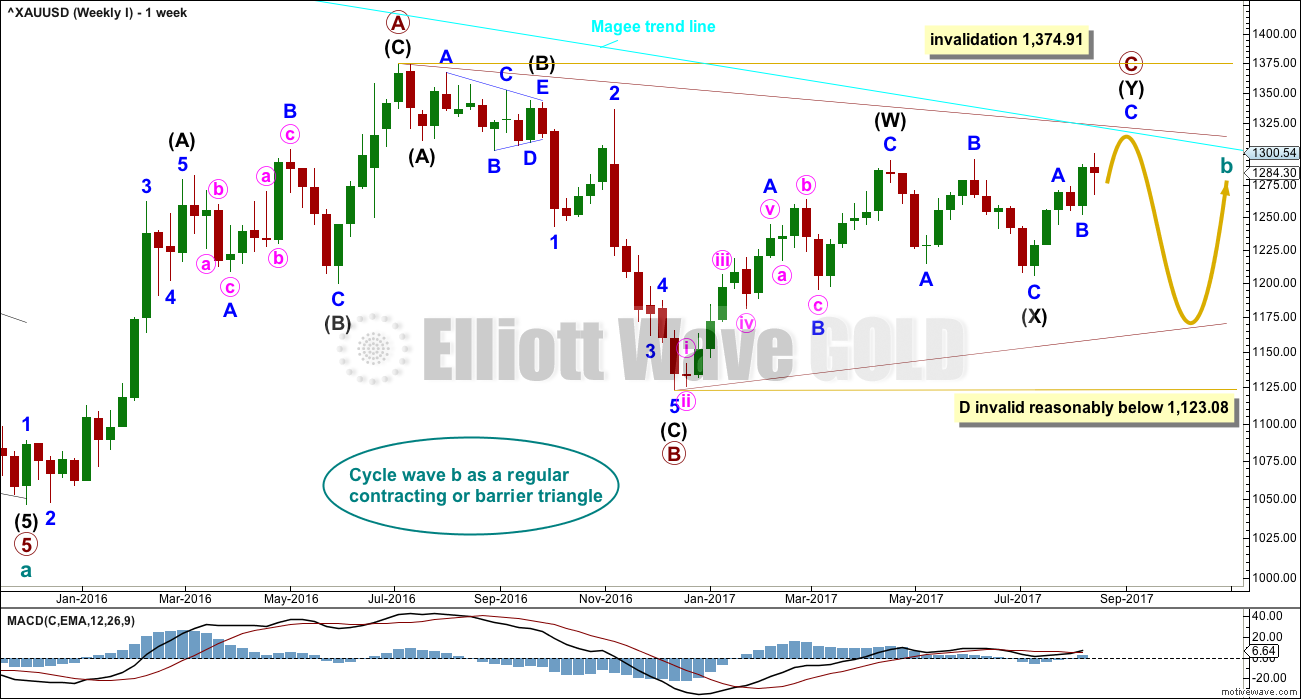
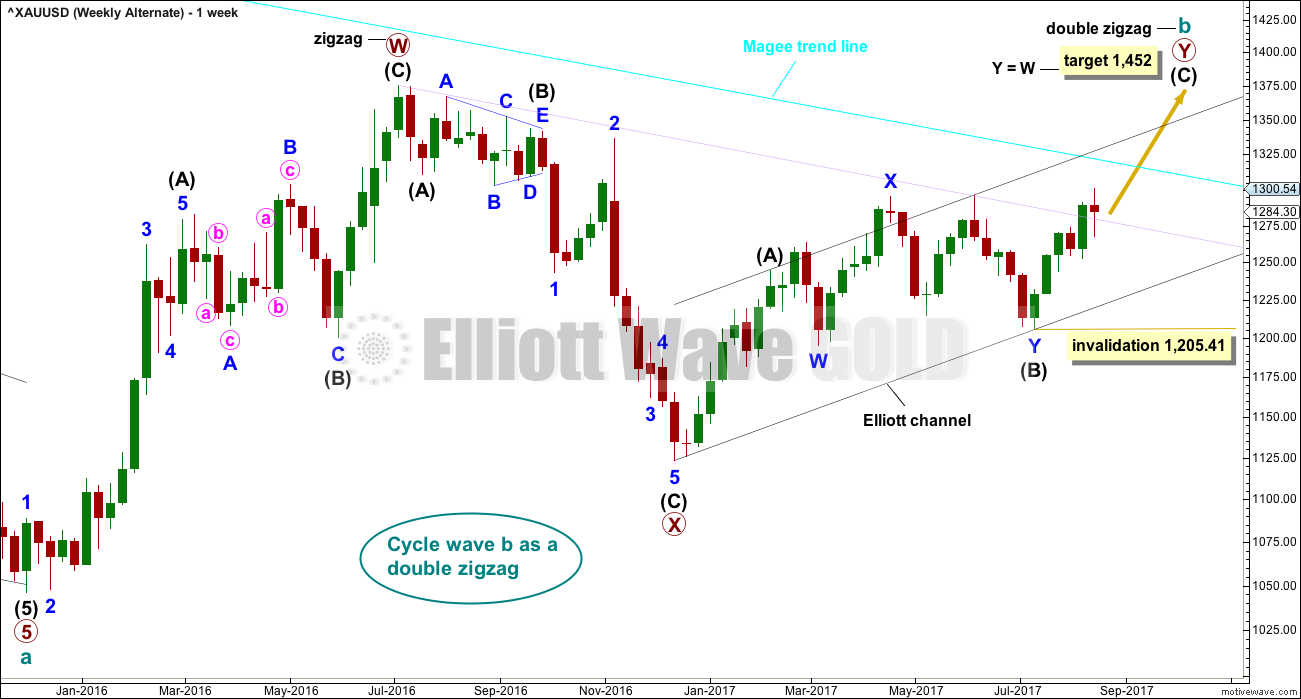
The Magee bear market trend line is added to the weekly charts. This cyan line is drawn from the all time high for Gold on the 6th of September, 2011, to the first major swing high within the following bear market on the 5th of October, 2012. This line should provide strong resistance.
To use this trend line in the way Magee describes, we should assume that price will find resistance at the line if it gets back up there. If the line is breached (by at least one or two full daily candlesticks above it), it will be signalling a major trend change from bear to bull. At that point the alternate Elliott wave count should be preferred.
At this stage, a triangle still looks possible and has the best fit for cycle wave b. It has strong support now from declining ATR and MACD hovering about zero.
Within a triangle, one sub-wave should be a more complicated multiple, which may be primary wave C. This is the most common sub-wave of the triangle to subdivide into a multiple.
Intermediate wave (Y) now looks like a developing zigzag at the weekly chart level, and minor wave B within it shows up with one red weekly candlestick. Primary wave C may end at the Magee trend line.
Primary wave D of a contracting triangle may not move beyond the end of primary wave B below 1,123.08. Contracting triangles are the most common variety.
Primary wave D of a barrier triangle should end about the same level as primary wave B at 1,123.08, so that the B-D trend line remains essentially flat. This involves some subjectivity; price may move slightly below 1,123.08 and the triangle wave count may remain valid. This is the only Elliott wave rule which is not black and white.
Finally, primary wave E of a contracting or barrier triangle may not move beyond the end of primary wave C above 1,295.65. Primary wave E would most likely fall short of the A-C trend line. But if it does not end there, then it can slightly overshoot that trend line.
Primary wave A lasted 31 weeks, primary wave B lasted 23 weeks, and primary wave C may now have just completed its 34th week. A double zigzag may be expected to be longer lasting than single zigzags within a triangle, and so this continuation of primary wave C is entirely acceptable and leaves the wave count with the right look at this time frame.
DAILY CHART
Click chart to enlarge.
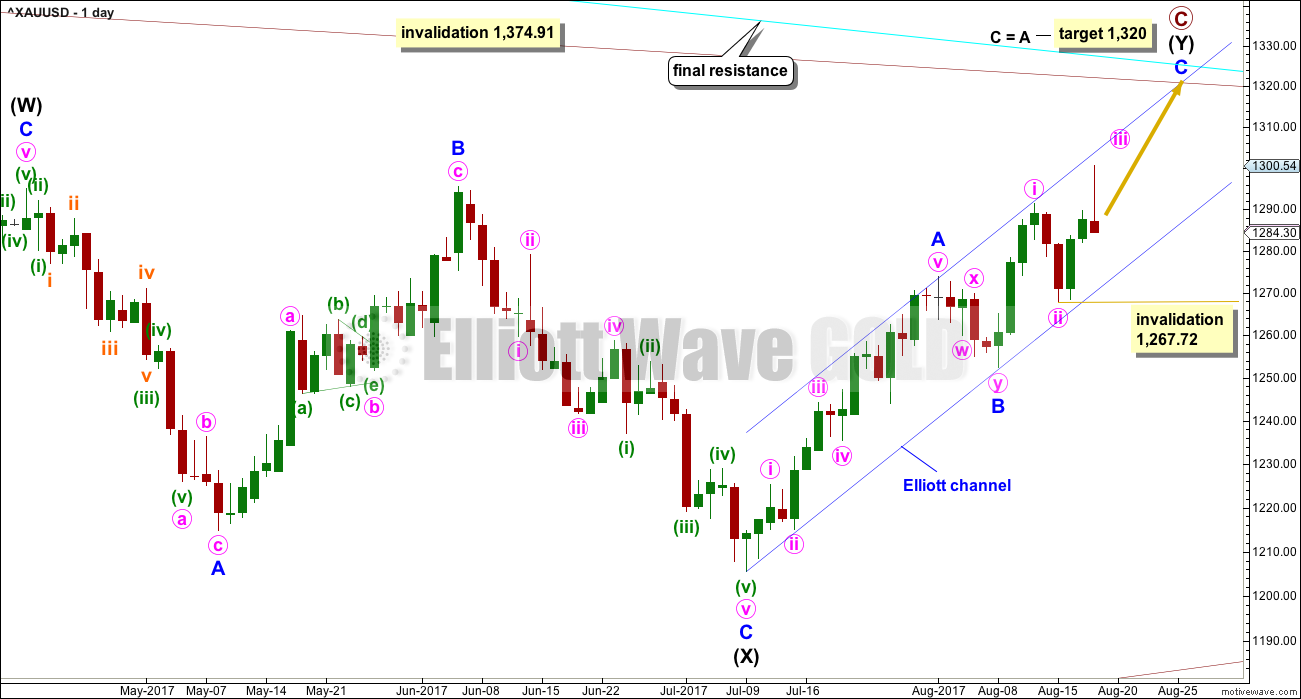
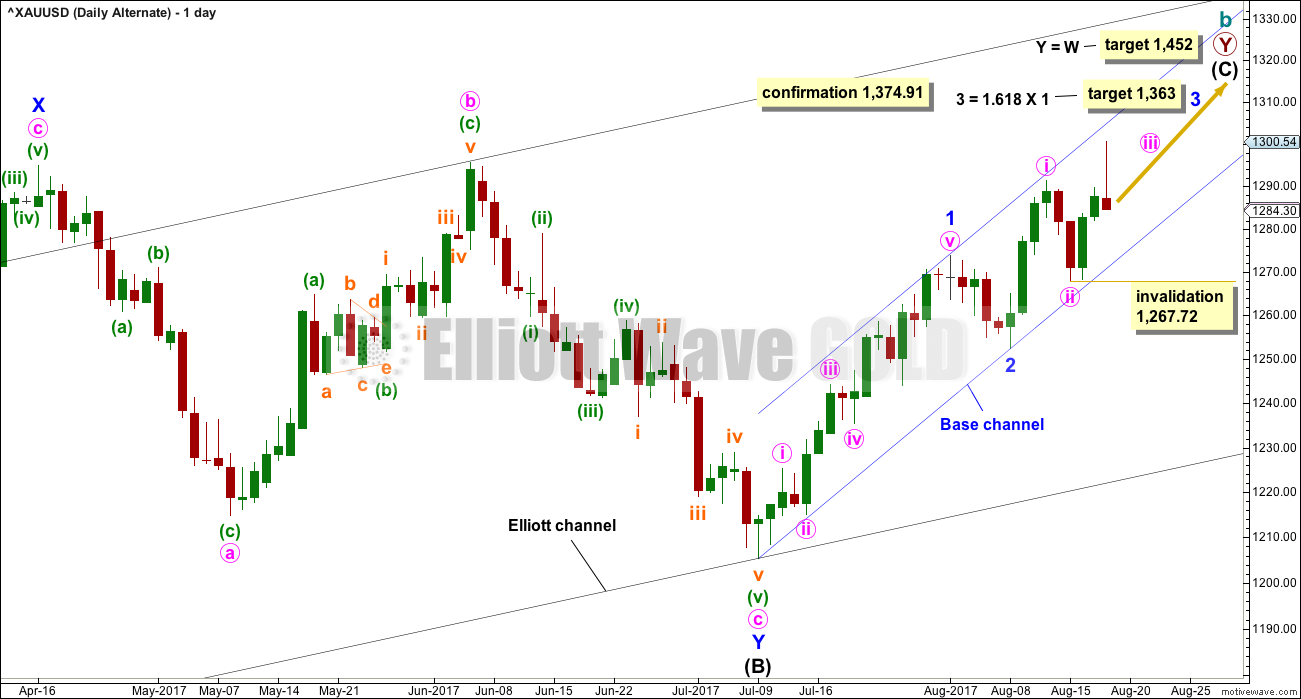
A target for primary wave C to end is calculated using the most common Fibonacci ratio between minor waves A and C. If the target is wrong, it may be too high; there is very strong resistance about 1,305 to 1,310. At this stage, the target at 1,320 may see upwards movement end about the Magee trend line.
Along the way up, corrections should find final support at the lower edge of the blue Elliott channel.
Minor wave C may only unfold as a five wave structure, either an impulse or an ending diagonal. At the end of this week, overlapping by downwards movement on Friday indicates an ending diagonal should be considered. Two hourly charts are provided below for both possible structures of minor wave C.
Within an impulse for minor wave C, the corrections of minute waves ii and iv would most likely show up on the daily chart, like they do within minor wave A. Minute waves ii and iv within minor wave A both lasted two sessions, so they may also last about two to three sessions within minor wave C.
Minute wave ii now shows up with two red daily candlesticks. It has a typical look.
Within minute wave iii, no second wave correction may move beyond its start below 1,267.72.
FIRST HOURLY CHART
Click chart to enlarge.
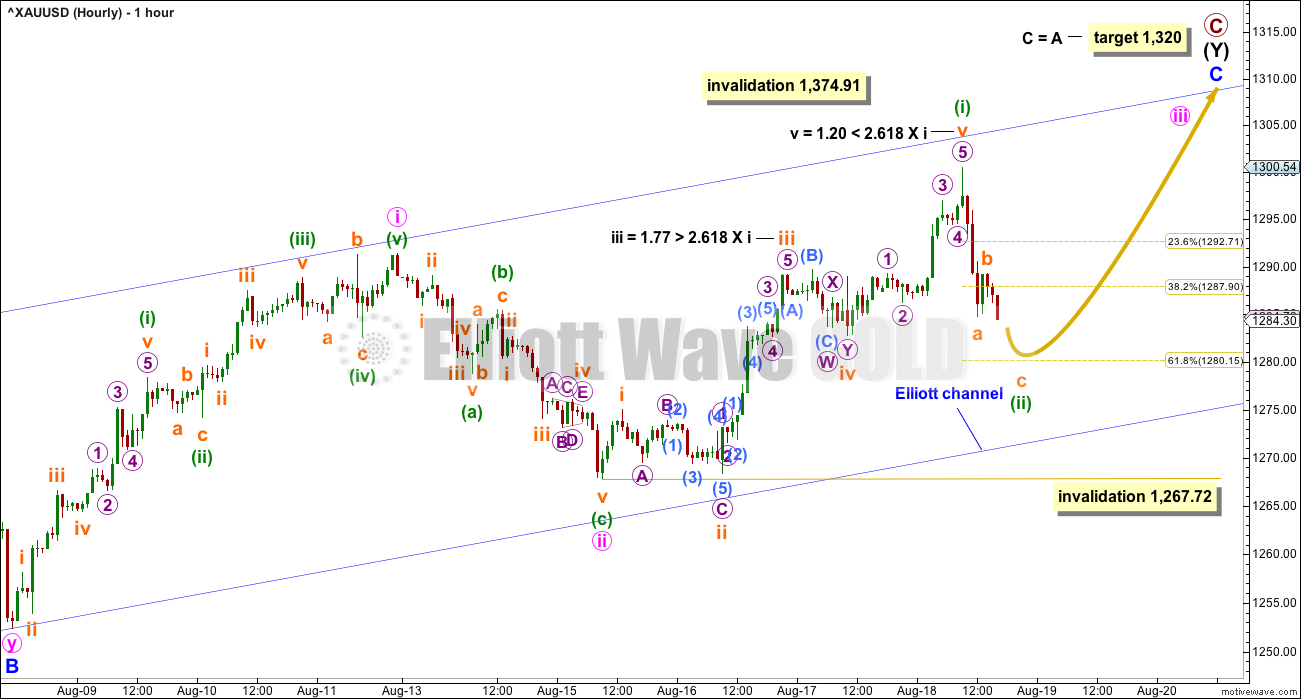
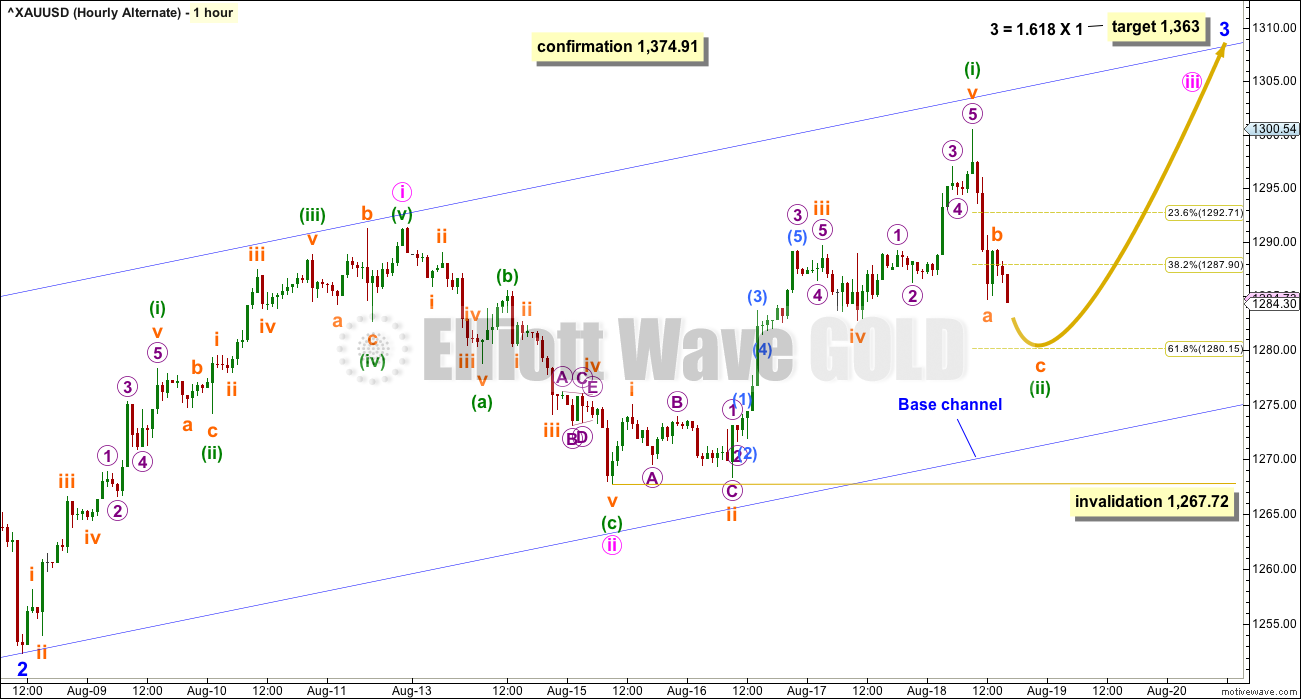
If minor wave C is an impulse, then it must have begun with two overlapping first and second waves.
Downwards movement at the end of Friday’s session cannot be minute wave iv because it is back down within minute wave i price territory. Therefore, minute wave iii cannot be over.
This wave count now looks like the final target at 1,320 may not be high enough. It may not allow enough room for the structure of minor wave C to complete as an impulse. A higher target could be calculated, but that would require an overshoot or breach of the Magee trend line. That should not happen for this wave count.
SECOND HOURLY CHART
Click chart to enlarge.
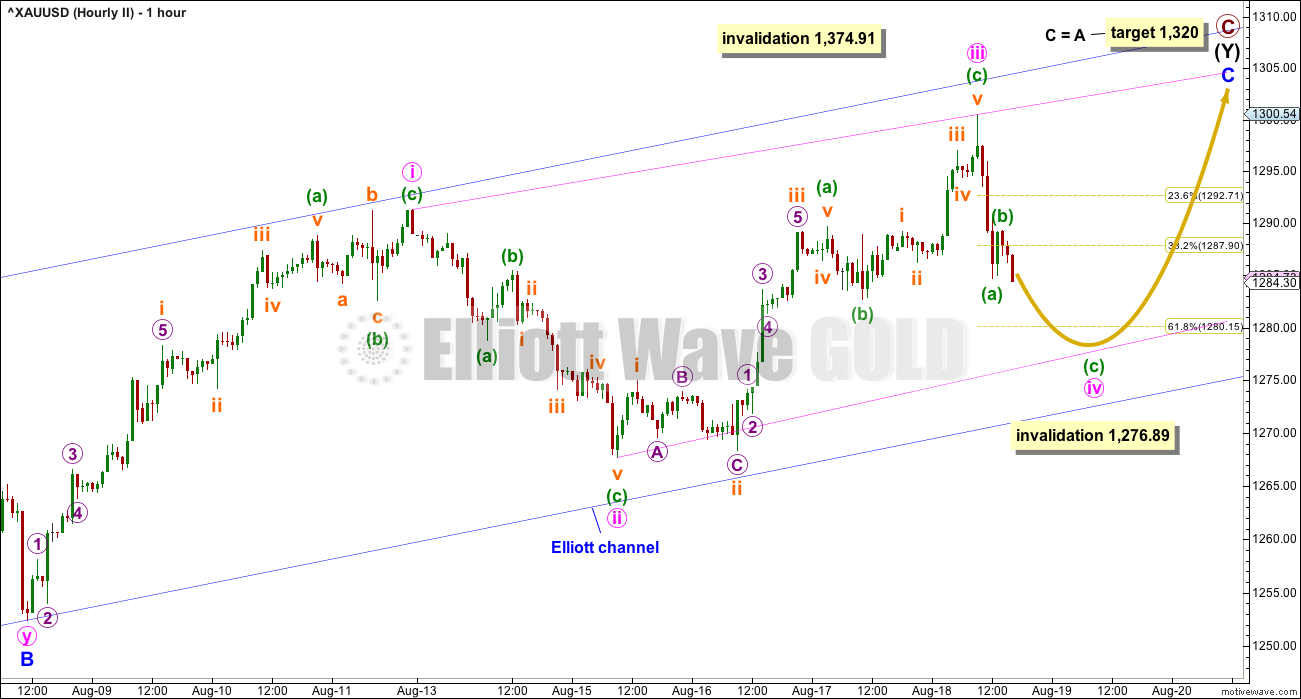
The other structural possibility for minor wave C is an ending diagonal, which are more commonly contracting than expanding. The classic pattern equivalent here is a rising wedge. They are terminal structures.
This diagonal would be contracting because minute wave iii is slightly shorter than minute wave i. This limits minute wave iv; it must be shorter than minute wave ii and must end before the invalidation point. The trend lines (in pink) must also converge.
The final target for this wave count at 1,320 may be too high. When minute wave iv is over, then a new target and a limit for minute wave v can be calculated. That cannot be done yet.
Diagonals normally adhere very well to their trend lines. Occasionally, there are small overshoots, but the diagonal trend lines should not be breached as the diagonal unfolds (until the end of the fifth wave). That means that the lower ii-iv trend line should sit where it is shown on this chart. For it to have a stronger slope would see too great a breach at the start of minute wave iii.
Contracting diagonals very commonly end with an overthrow of the i-iii trend line.
ALTERNATE ELLIOTT WAVE COUNT
WEEKLY CHART
Click chart to enlarge.
This wave count has been published only in historical analysis. At this stage, it will be published on a daily basis.
There are more than 23 possible corrective structures that B waves may take, and although cycle wave b fits best at this stage as a triangle (main wave count), it may still be another structure. This wave count looks at the possibility that it may be a double zigzag.
If cycle wave b is a double zigzag, then current upwards movement may be part of the second zigzag in the double, labelled primary wave Y.
The target remains the same as previously published for this wave count.
Along the way up, some resistance should be expected at the cyan Magee trend line. Because this wave count requires price to break above the Magee trend line, it must be judged to have a lower probability for this reason. This trend line is tested multiple times and goes back to 2011. It is reasonable to expect price to find resistance there, until proven otherwise.
Within intermediate wave (C), no second wave correction may move beyond the start of its first wave below 1,205.41.
DAILY CHART
Click chart to enlarge.
Intermediate wave (C) may be unfolding as an impulse.
Within the impulse, minor waves 1 and 2 would now be complete. Minor wave 3 must unfold as an impulse, and within it minute waves i and now ii would also be complete.
HOURLY CHART
Click chart to enlarge.
This hourly chart is exactly the same as the first hourly chart for the main Elliott wave count. 1-2-3 of an impulse subdivides exactly the same as A-B-C of a zigzag.
Minor wave 3 may only subdivide as an impulse for this alternate wave count. Minor wave 3 may not be a diagonal. The second hourly chart for the main wave count does not work for this alternate.
The target is now different. This wave count is more bullish, and it expects to see a breach of the Magee trend line.
TECHNICAL ANALYSIS
WEEKLY CHART
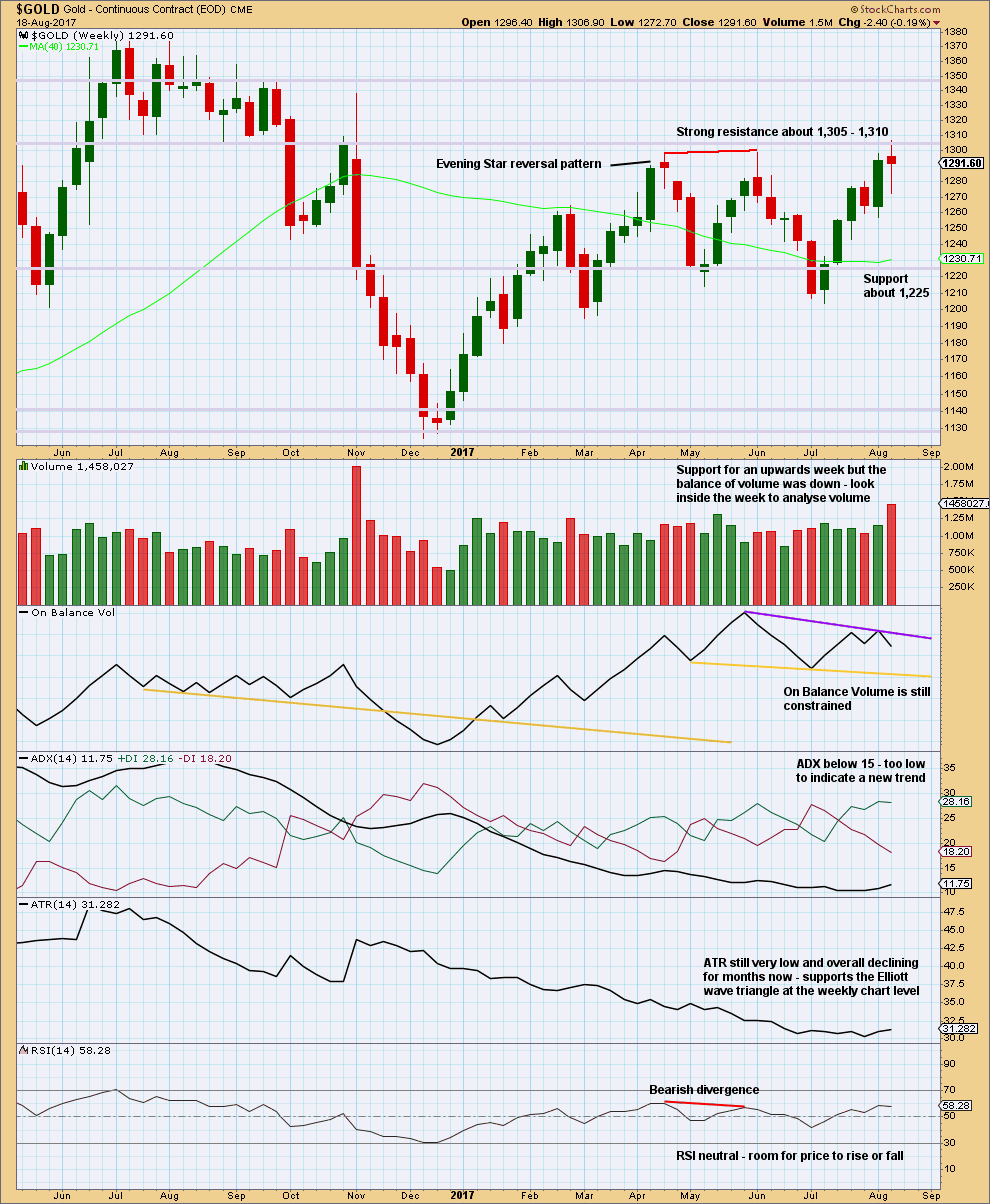
Click chart to enlarge. Chart courtesy of StockCharts.com.
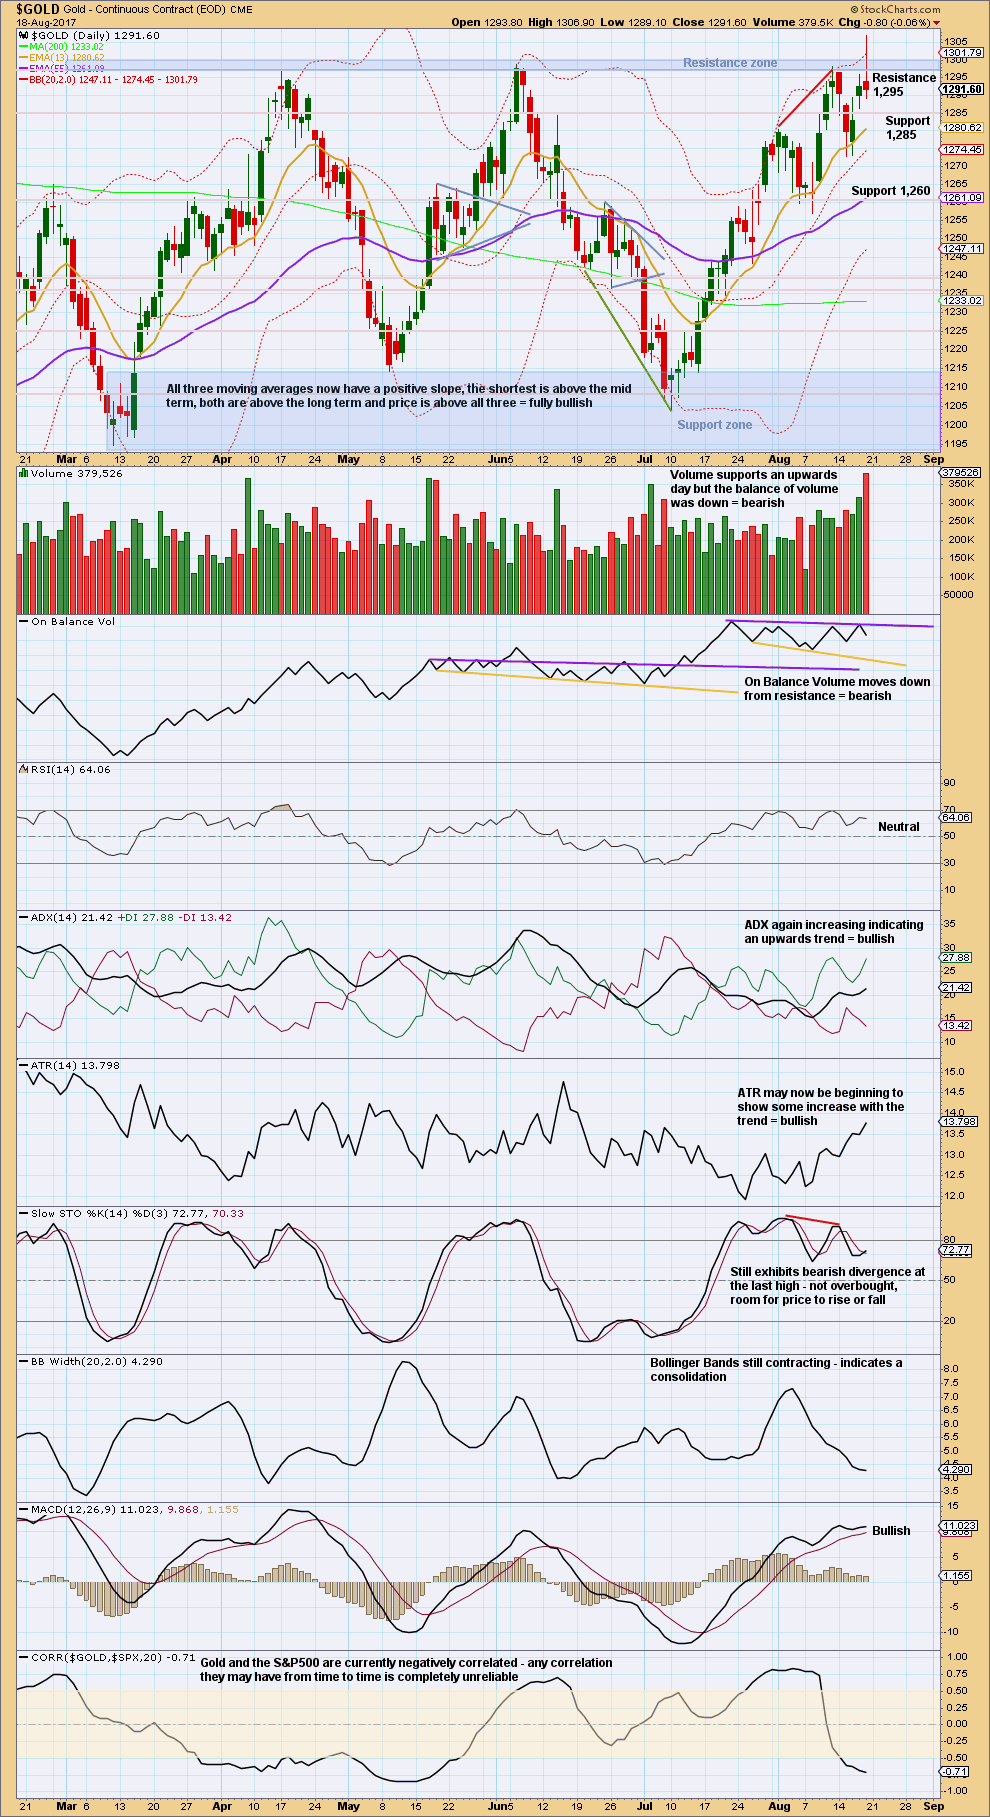
Price is finding very strong resistance about 1,310.
The upper purple resistance line for On Balance Volume is adjusted. On Balance Volume turning down from this line is a bearish signal.
ADX and ATR at the weekly chart level still strongly support the main Elliott wave count.
DAILY CHART
Click chart to enlarge. Chart courtesy of StockCharts.com.
The long upper candlestick wick for Friday is very bearish, as is support from volume. It looks like price has found very strong resistance about 1,305 – 1,310 and reacted very strongly there. This is very bearish. Also, it puts some doubt on whether or not the target for the main Elliott wave count at 1,320 can be met.
The upper purple resistance line for On Balance Volume is adjusted. On Balance Volume gives a bearish signal at the daily chart level also.
GDX
DAILY CHART
Click chart to enlarge. Chart courtesy of StockCharts.com.
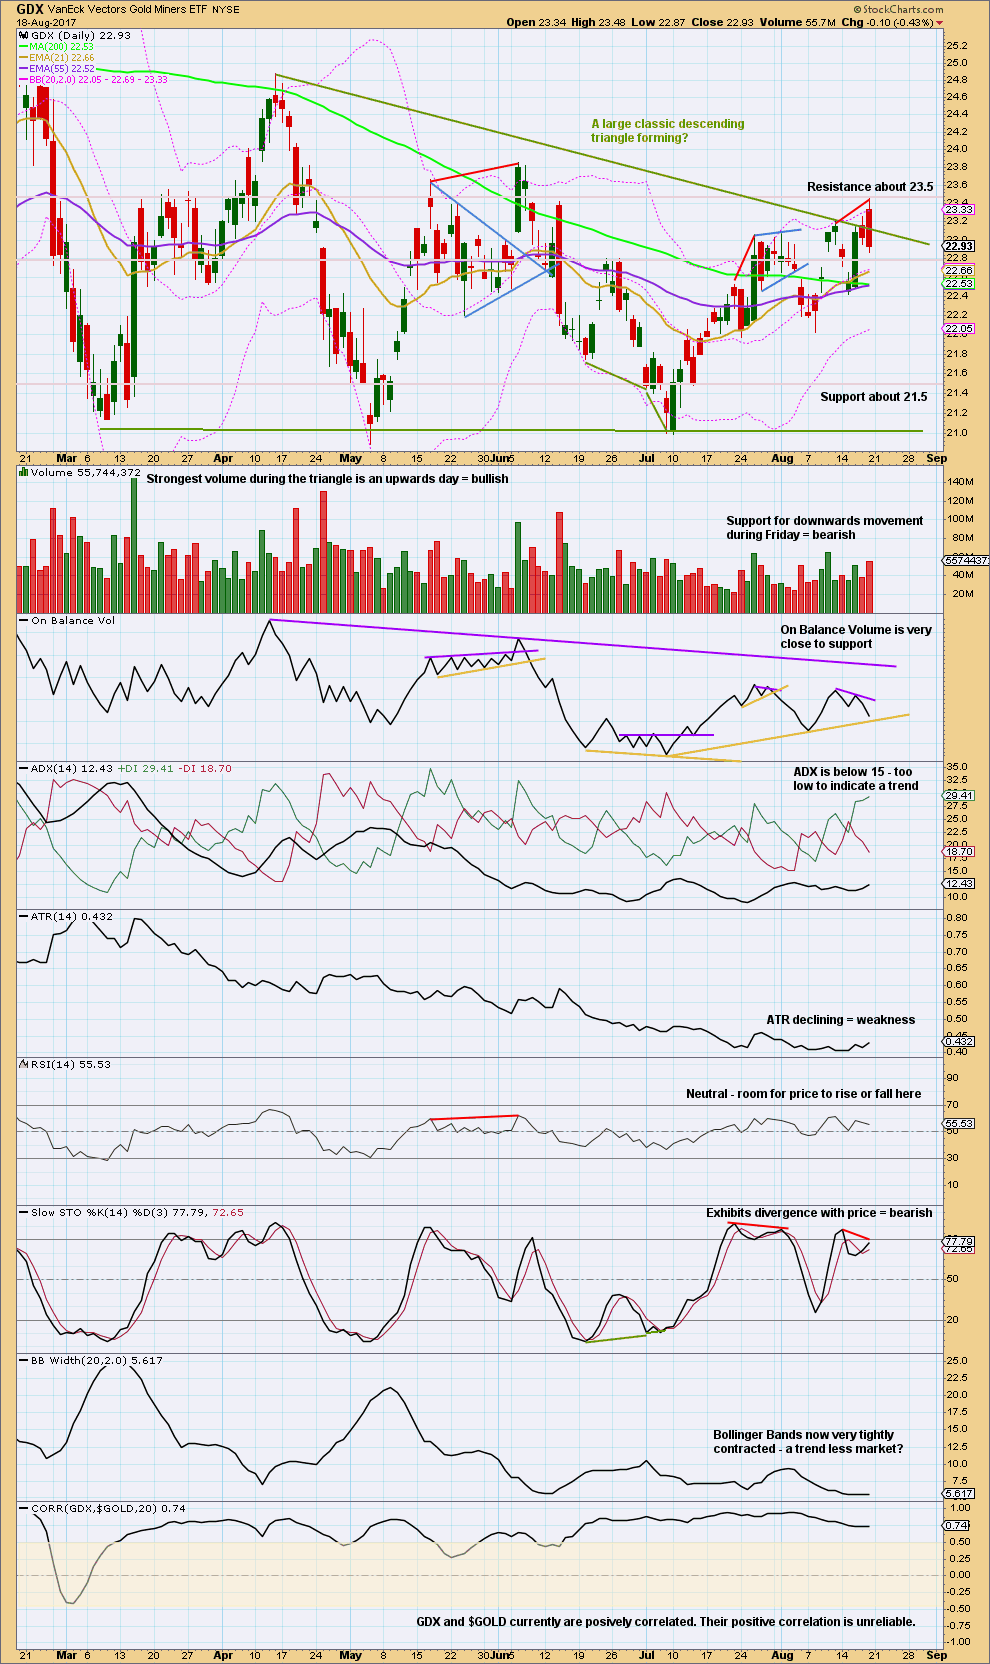
This market has been trendless for a long time now as a large triangle completes. Descending triangles most commonly break out downwards, but this is contradicted by volume during this triangle being strongest for upwards days.
An outside day has some support from volume for downwards movement during the session.
The volume profile short term is bearish. Stochastics is bearish.
On Balance Volume may halt the fall in price though. If Monday is another downwards day, then it may not be by much.
Published @ 09:13 p.m. EST.
Preferred hourly wave count updated:
An ending diagonal looks right. As soon as price makes a new high above 1,300.53 then minute v could be over.
Minute v is very likely to overshoot the i-iii trend line, that’s almost always how contracting diagonals end. If that happens, expect a quick reversal and a violent downwards fall.
As Dreamer notes below the maximum is for v to = iii.
Because iii cannot be the shortest, v may not be longer than iii. And the diagonal is contracting so v should be shorter than iii, it should end well below the maximum point given.
I usually chart with TradingView, but to match Lara’s data exactly for the possible ending diagonal, I used BarChart data.
These data points can help us determine if the ending diagonal is valid or not as price progresses.
Hi Dreamer / Lara
Question
Is it typical for a ED. To have lines that do not contract much? The overthrow at the top I’m familiar with but in this case wave 3 ( the start) also breaks below ?
I have been tied up recently with some matters, and couldn’t devote more time here. So a quick view is presented.
Gold prices touched a high of 1300.53 last week before dropping back to test the 1280 area. The correction may be over at this juncture. At the moment, gold remains above the kumo. The tenkan-sen has moved above the kijun-sen, and price today has been making higher highs and higher lows. But, if price does fall again, then the 1270-1280 region should offer support, especially the bottom cloud boundary at 1271.64. Below that, we are back in bear territory once again.
The commercials are going short and gold went up more so more so the commercials likely added to total 50k plus to the short side during the past 2 weeks.
The couple of flies in the ointment are the us market weakening and the military exercises starting Monday in South Korea with the US. NK has increased the nuclear rhetoric (geez imagine when they have a full arsenal). The trump presidency is being attacked on all sides by the left. The Russian accusations have died down for now as racist accusations have taken front stage by the leftist media. There will be tensions for two weeks with the military exercises ongoing during this period. Already NK has made more threats and the Chinese newspapers are asking for the drills to be skipped. It seems to me the Chinese are using NK as a puppet to solicit and digest the US response. The NK situation is not going away. They want nuclear weapons, the US doesn’t want them to have them. I’m going to watch red dawn again. Cheers all.
http://www.cnn.com/2017/08/20/asia/north-korea-south-korea-us-military-drills/index.html
looks like a shooting star top on the charts from Friday.
Hi. I guess Gold price has everyone on their toes with lack of clarity on which way it is heading. Calls for being nimble footed and cautious. Perhaps a battle of trend lines as Dreamer puts it; who knows?! lol
Appears a bearish reversal is in play and remains to be seen if Gold price can break below 1278-77 (10dma) in the early going on Monday to setup a test of 1270 (20dma) to probably go long there. Shorted at 1300 on Friday and holding with a stop at 1290. Imo a break above 1290 will likely indicate resumption of upwards movement. Lets see what happens and if Gold price can get to 1315 this coming week.
Hi Syed,
You got nice profit scalping $10. Good for you.
Lara’s wave count is working out very well here. Most gold will do is 1320.
If momentum is fierce it may go upto invalidation 1374.
Odd price action since the open.
Not looking like any kind of impulsive way, choppy and overlapping.
Time to sit tight imo
Hi folks~! With a lack of direction, yeah I will probably look to scalp this again between 1296-1305 (Gann square of 9 and also happens to be where the upper bands are on daily/weekly) depending on the RSI and stochastic reading when Gold price gets into the 1296-1305 range lol…. GL all. Have fun!
Lara,
Diagonal would be good road map for bearish case however is there another more bearish wave count which could see gold already completing C wave given bearish technicals of both gold turning at resistance and especially GDX having an outside day with false breakout of major downtrend line. I will use the current invalidation point to indicate C being probably done but curious if you can generate wave count ahowing how C wave of triangle could be over today.
Thanks.
Daniel, with the weakness in GDX, I could see gold making a slight new high with the ending diagonal (2nd hourly) while GDX retraces up for a 2nd wave which of course doesn’t make a new high. We should know for sure by Tuesday or Wednesday next week.
With minor A and B where they are, which is the only reasonable place to put them IMO, no. I can’t see minor C complete. It isn’t a five, so far it’s only a three.
Looking at trying to manufacture a wave count with minor A and B down lower… still minor C doesn’t work. Too much overlapping. It won’t meet rules for a diagonal regarding wave lengths, and it can’t be a complete impulse with the overlapping.
Hi Lara
By this do you mean to say you favor the 2nd hrly count?
Yes, I do. Apologies for the slow reply. I’m travelling home from Gisborne.
GDX had a false breakout today before reversing down on increased volume. The top may be in for now.
We’ll have to see if the purple trendline can actually be broken to the upside next week. If the pink uptrend line is broken to the downside first, that would be bearish and confirm a top.
Battle of the trendlines…
https://www.tradingview.com/x/lTewusCW/
Thanks Dreamer. Time to be cautious. Reminder when trading on Fridays to step back and look at big picture by analyzing daily and weekly charts to get a flavor of how following week will likely unfold. One can forget about the forest for the trees when looking at hourly count trying to scalp profits.
Agree. All this choppiness is rough on the hourly wave counts. Very difficult to get them correct right now without a trending market. Keeping the bigger picture in mind helps keep us on track 🙂