
Upwards movement for Wednesday’s session has unfolded as expected from both the main and alternate Elliott wave counts.
Summary: Upwards movement may end this week below 1,315.81. Thereafter, there may be a sharp trend change and a violent downwards movement.
Always use a stop. Invest only 1-5% of equity on any one trade.
New updates to this analysis are in bold.
Last monthly charts and alternate weekly charts are here, video is here.
Grand SuperCycle analysis is here.
MAIN ELLIOTT WAVE COUNT
WEEKLY CHART
Click chart to enlarge.
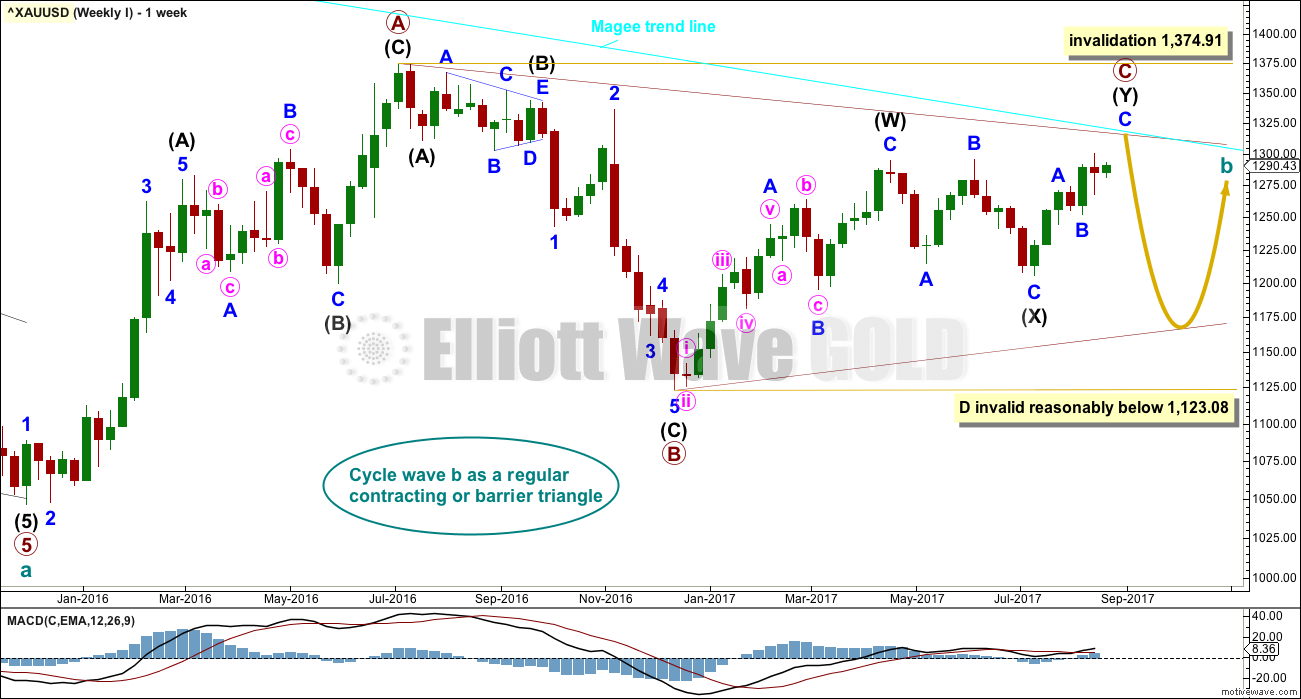
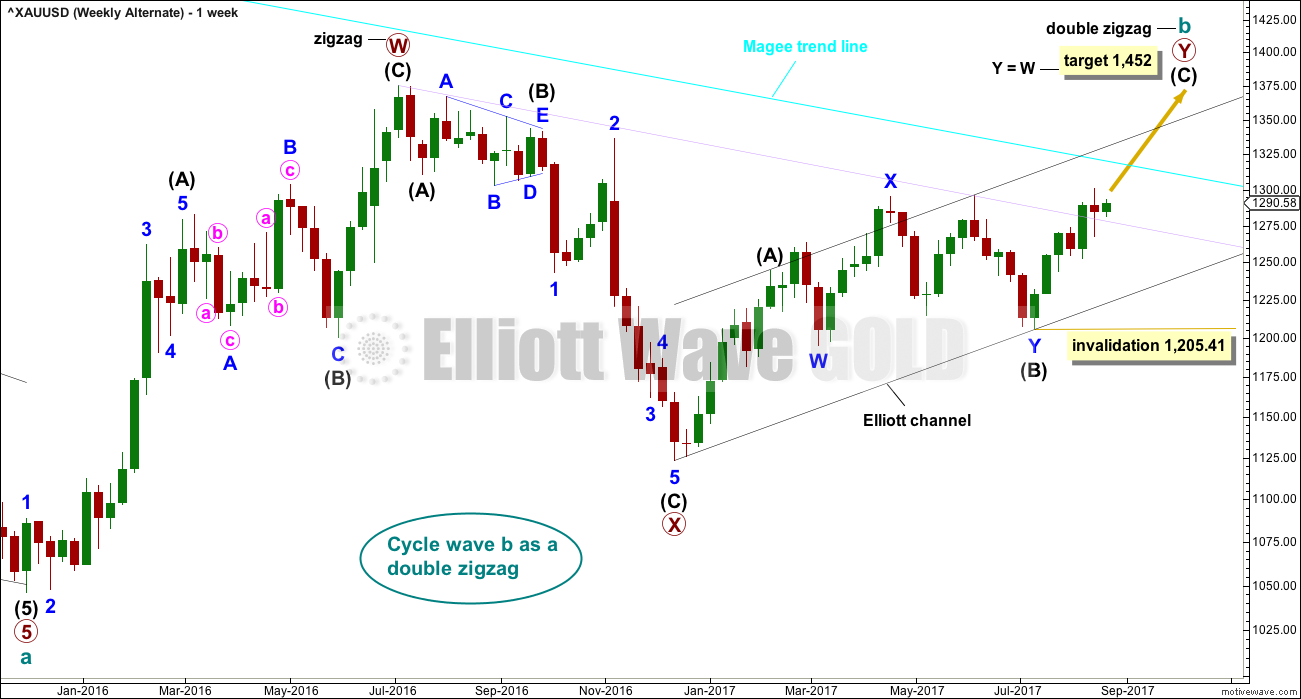
The Magee bear market trend line is added to the weekly charts. This cyan line is drawn from the all time high for Gold on the 6th of September, 2011, to the first major swing high within the following bear market on the 5th of October, 2012. This line should provide strong resistance.
To use this trend line in the way Magee describes, we should assume that price will find resistance at the line if it gets back up there. If the line is breached (by at least one or two full daily candlesticks above it), it will be signalling a major trend change from bear to bull. At that point the alternate Elliott wave count should be preferred.
At this stage, a triangle still looks possible and has the best fit for cycle wave b. It has strong support now from declining ATR and MACD hovering about zero.
Within a triangle, one sub-wave should be a more complicated multiple, which may be primary wave C. This is the most common sub-wave of the triangle to subdivide into a multiple.
Intermediate wave (Y) now looks like a developing zigzag at the weekly chart level, and minor wave B within it shows up with one red weekly candlestick. Primary wave C may end at the Magee trend line.
Primary wave D of a contracting triangle may not move beyond the end of primary wave B below 1,123.08. Contracting triangles are the most common variety.
Primary wave D of a barrier triangle should end about the same level as primary wave B at 1,123.08, so that the B-D trend line remains essentially flat. This involves some subjectivity; price may move slightly below 1,123.08 and the triangle wave count may remain valid. This is the only Elliott wave rule which is not black and white.
Finally, primary wave E of a contracting or barrier triangle may not move beyond the end of primary wave C above 1,295.65. Primary wave E would most likely fall short of the A-C trend line. But if it does not end there, then it can slightly overshoot that trend line.
Primary wave A lasted 31 weeks, primary wave B lasted 23 weeks, and primary wave C may now have just completed its 35th week. A double zigzag may be expected to be longer lasting than single zigzags within a triangle, and so this continuation of primary wave C is entirely acceptable and leaves the wave count with the right look at this time frame.
DAILY CHART
Click chart to enlarge.
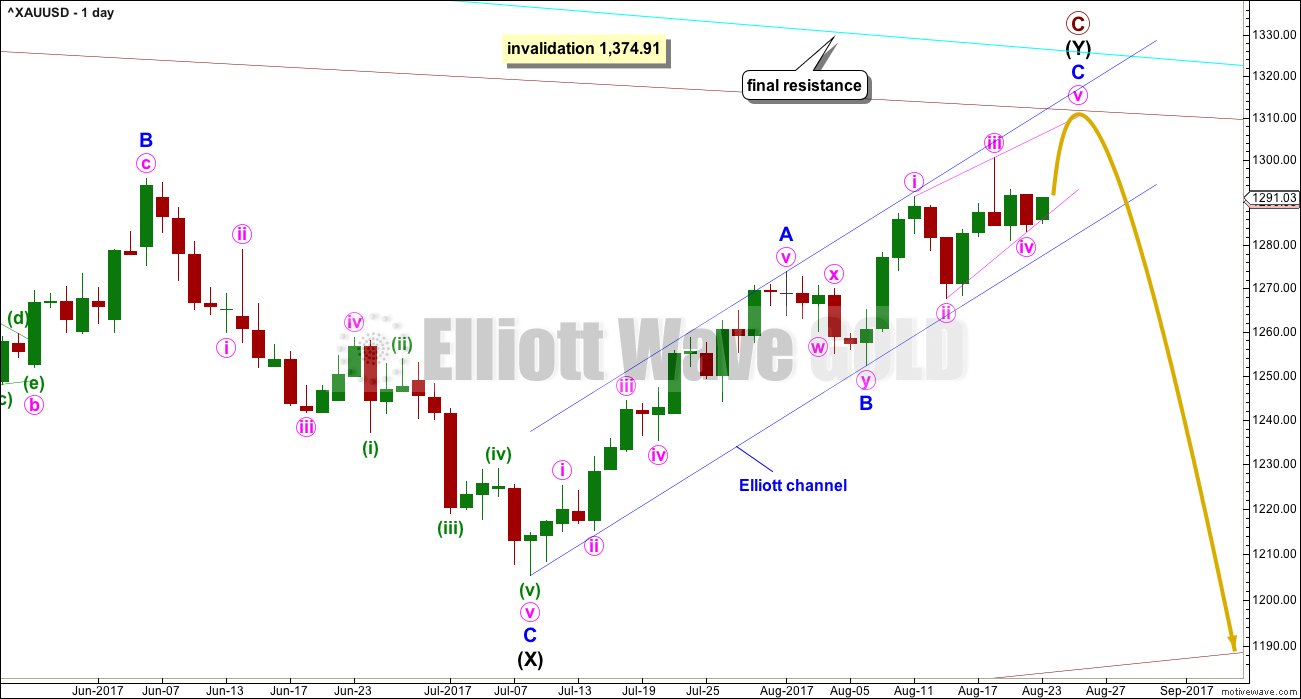
A target is no longer calculated for primary wave C to end. The best guide to where upwards movement may end may be trend lines.
The cyan Magee trend line should offer very strong resistance. This wave count does not expect it to be breached. Recently, price has found resistance a little below the line, so it may not be touched.
The pink i-iii diagonal trend line may be the best guide as to where upwards movement may end. As soon as that line is slightly overshot, then look out for a quick reversal.
The blue trend channel may be the best guide to confidence in a trend change. A breach of the lower edge of that channel would provide reasonable confidence that a high is in place.
There are two possible structures for minor wave C within the zigzag of intermediate wave (Y). Minor wave C must be a five wave structure, so it may only be an impulse or an ending diagonal. With overlapping of recent days, a diagonal now looks more likely and is the preferred hourly wave count.
FIRST HOURLY CHART
Click chart to enlarge.
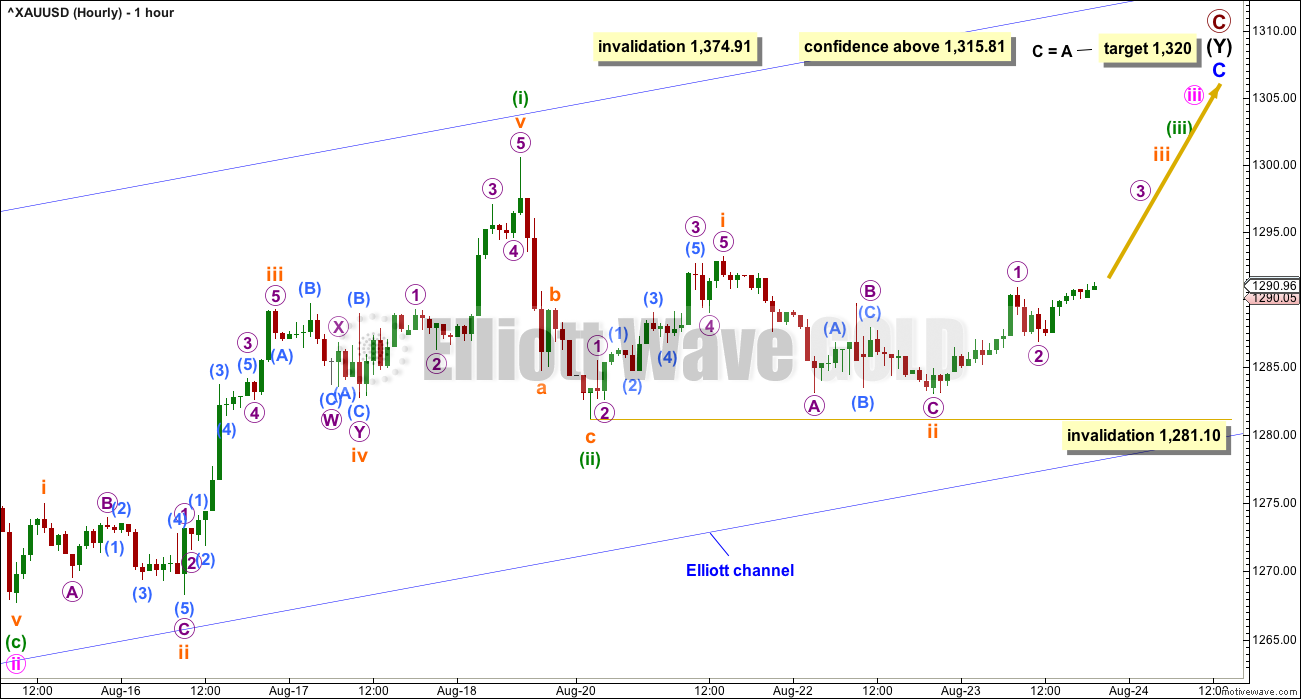
If minor wave C is an impulse, then it must have begun with four overlapping first and second waves.
This wave count now looks like the final target at 1,320 may not be high enough. It may not allow enough room for the structure of minor wave C to complete as an impulse. A higher target could be calculated, but that would require an overshoot or breach of the Magee trend line. That should not happen for this wave count.
At this stage, this first hourly wave count now expects to see a very strong increase in upwards momentum. The fact that this increase in momentum has so far failed to materialise is concerning for this wave count.
SECOND HOURLY CHART
Click chart to enlarge.
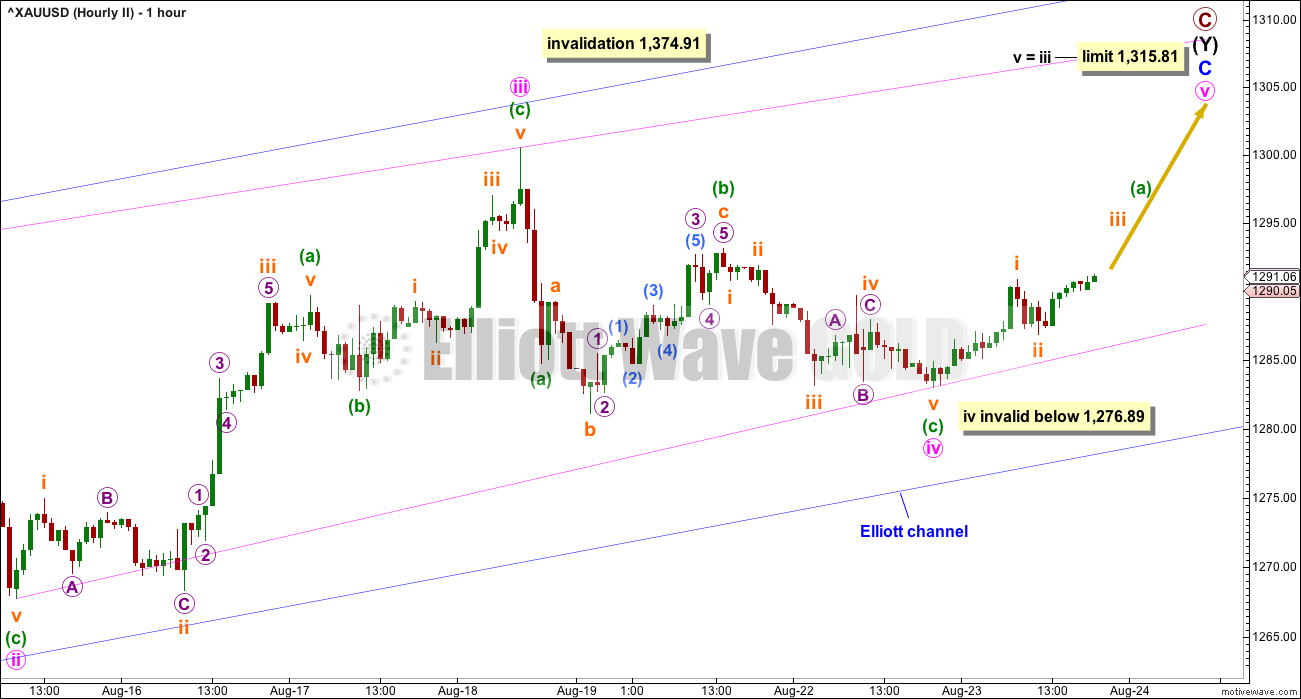
At this stage, this is still the preferred Elliott wave count.
The other structural possibility for minor wave C is an ending diagonal, which are more commonly contracting than expanding. The classic pattern equivalent here is a rising wedge. They are terminal structures.
This diagonal would be contracting because minute wave iii is slightly shorter than minute wave i.
Minute wave iv continued sideways during Tuesday’s session. If it continues any lower, it may not be longer than equality in length with minute wave ii, so it may not move below 1,276.89. If minute wave iv does move lower, then the diagonal trend lines must still converge.
Minute wave v may not be longer than minute wave iii. It must be shorter than minute wave iii, so it must end before the limit at 1,315.81.
No target is provided for minute wave v to end, and it may not exhibit a Fibonacci ratio to minute waves i or iii. The i-iii trend line should be used to indicate when minute wave v may be over. If price moves above the end of minute wave iii at 1,300.53 and then overshoots the i-iii trend line, then the diagonal may be complete. Contracting diagonals almost always end with overshoots of their i-iii trend lines.
Ending diagonals are commonly followed by sharp reversals. If this wave count is correct, then the first downwards movement after the diagonal is complete may be very strong and fast.
Use the blue Elliott channel as an indication of when primary wave C is over. A breach below the lower edge of the channel would be a strong indication of a trend change.
ALTERNATE ELLIOTT WAVE COUNT
WEEKLY CHART
Click chart to enlarge.
This wave count has been published only in historical analysis. At this stage, it will be published on a daily basis.
There are more than 23 possible corrective structures that B waves may take, and although cycle wave b fits best at this stage as a triangle (main wave count), it may still be another structure. This wave count looks at the possibility that it may be a double zigzag.
If cycle wave b is a double zigzag, then current upwards movement may be part of the second zigzag in the double, labelled primary wave Y.
The target remains the same as previously published for this wave count.
Along the way up, some resistance should be expected at the cyan Magee trend line. Because this wave count requires price to break above the Magee trend line, it must be judged to have a lower probability for this reason. This trend line is tested multiple times and goes back to 2011. It is reasonable to expect price to find resistance there, until proven otherwise.
Within intermediate wave (C), no second wave correction may move beyond the start of its first wave below 1,205.41.
DAILY CHART
Click chart to enlarge.
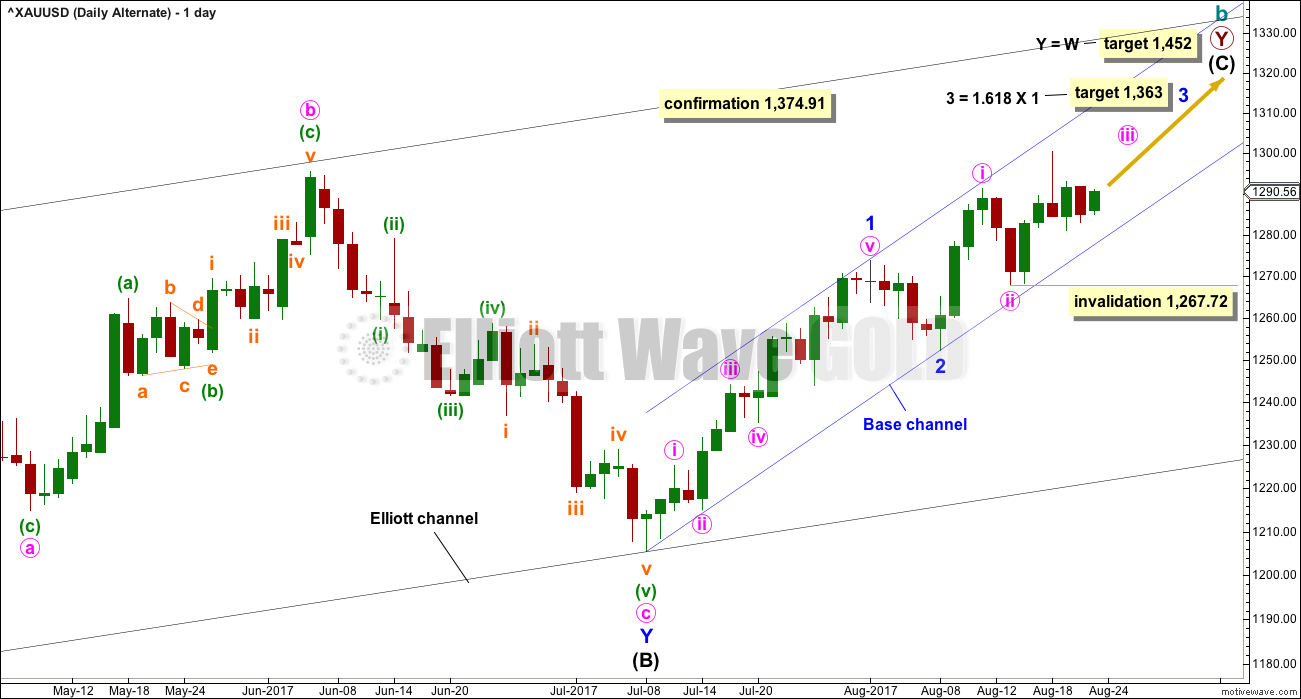
Intermediate wave (C) may be unfolding as an impulse.
Within the impulse, minor waves 1 and 2 would now be complete. Minor wave 3 must unfold as an impulse, and within it minute waves i and now ii would also be complete.
HOURLY CHART
Click chart to enlarge.
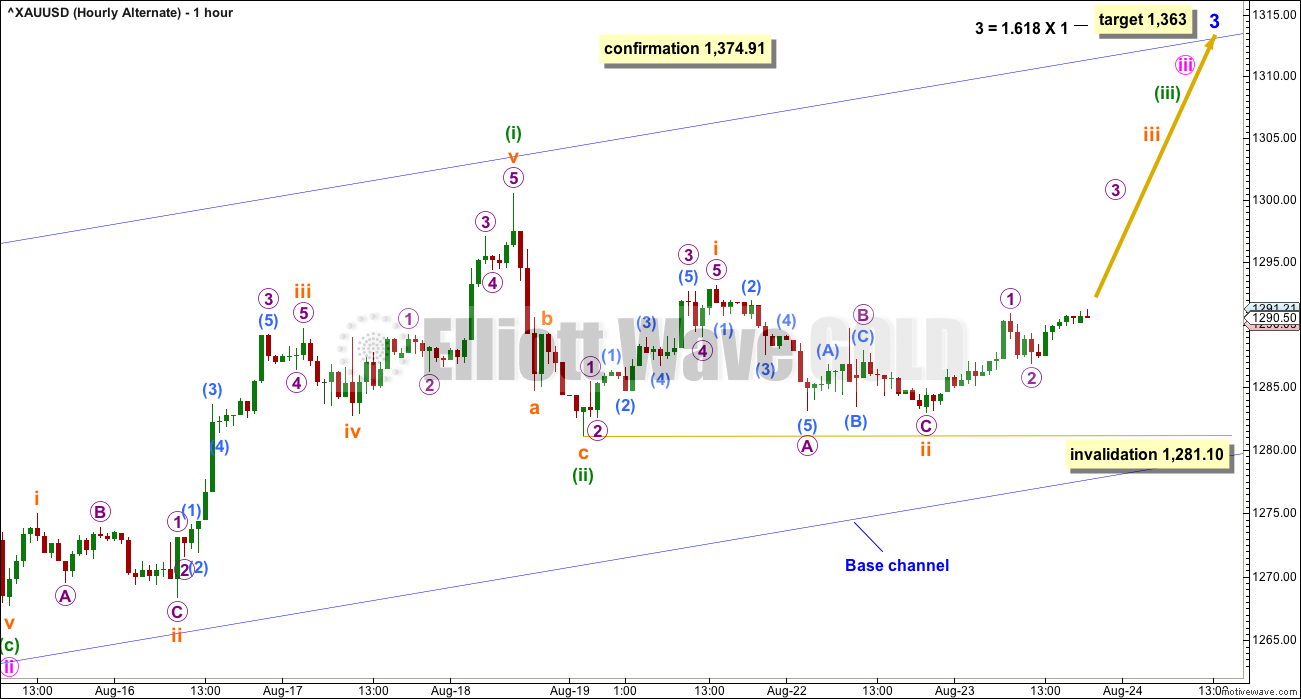
This hourly chart is exactly the same as the first hourly chart for the main Elliott wave count. 1-2-3 of an impulse subdivides exactly the same as A-B-C of a zigzag.
Minor wave 3 may only subdivide as an impulse for this alternate wave count. Minor wave 3 may not be a diagonal. The second hourly chart for the main wave count does not work for this alternate.
The target is now different. This wave count is more bullish, and it expects to see a breach of the Magee trend line.
TECHNICAL ANALYSIS
WEEKLY CHART
Click chart to enlarge. Chart courtesy of StockCharts.com.
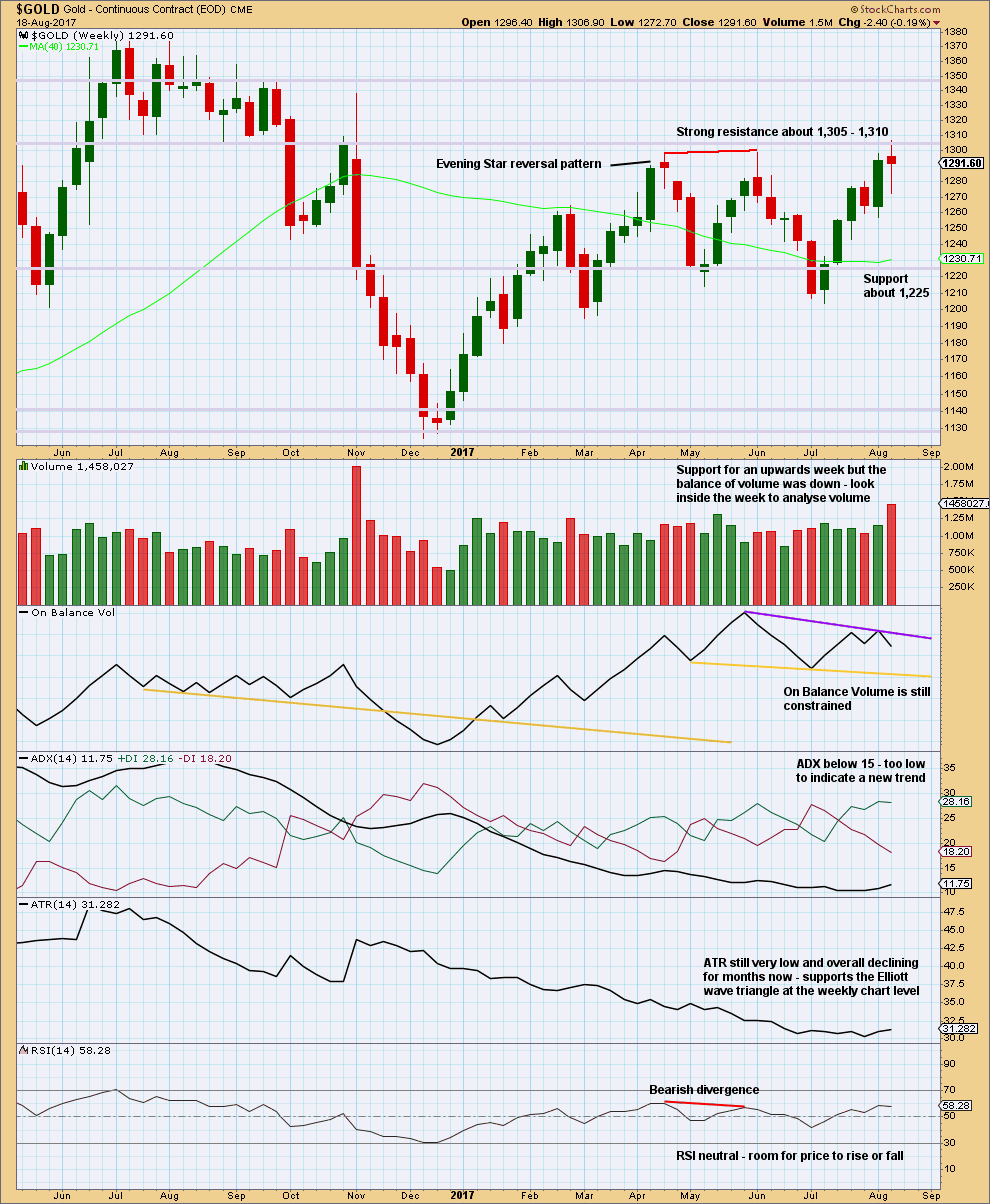
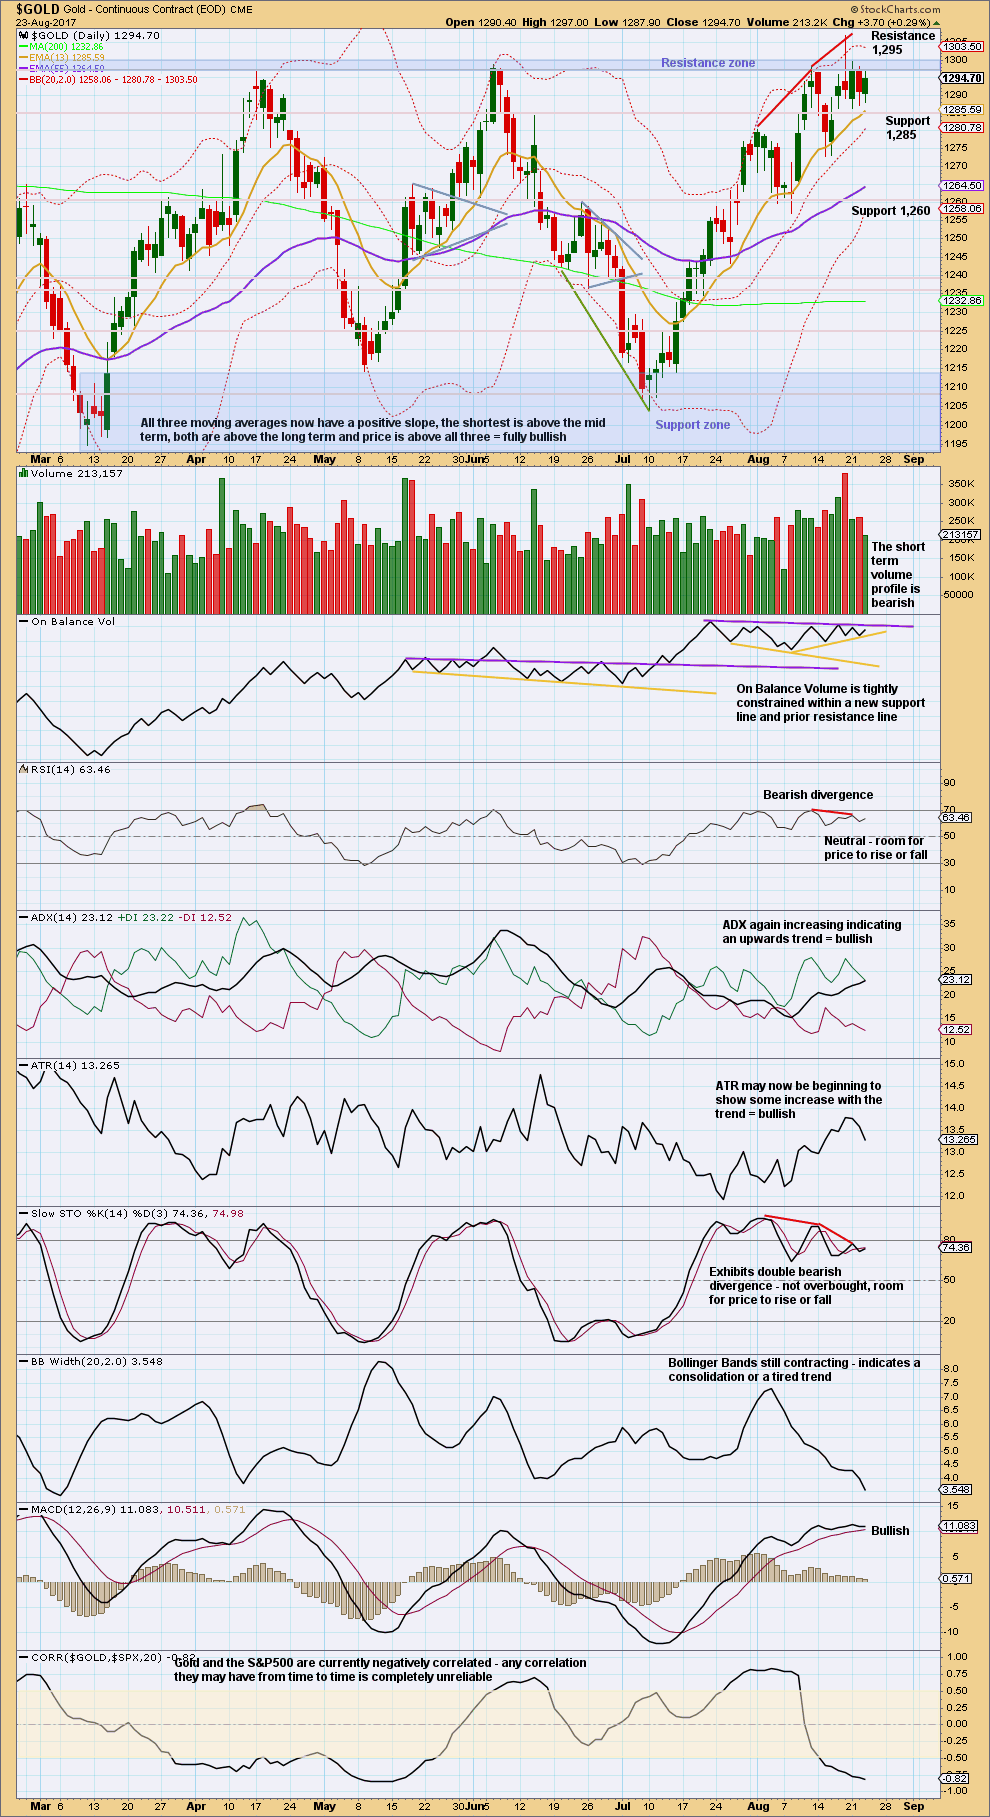
Price is finding very strong resistance about 1,310.
The upper purple resistance line for On Balance Volume is adjusted. On Balance Volume turning down from this line is a bearish signal.
ADX and ATR at the weekly chart level still strongly support the main Elliott wave count.
DAILY CHART
Click chart to enlarge. Chart courtesy of StockCharts.com.
During the long consolidation phase, it is now the 18th of August that has strongest volume. This session moved price higher with a higher high and a higher low, but the balance of volume during the session was downwards. There was strong support during the session for downwards movement, which created the Shooting Star candlestick pattern.
This now suggests that the breakout from this large consolidation may more likely be downwards than upwards, and this now agrees with the main Elliott wave count.
Today’s session moved price sideways to complete an inside day. The balance of volume was upwards and volume shows a strong decline. Upwards movement does not have support from volume. The volume profile remains bearish. Resistance continues to hold.
ADX is nearing extreme. If the black ADX line crosses above both directional lines, then an extreme trend would be indicated.
This chart supports the main Elliott wave count and an ending diagonal scenario.
GDX
DAILY CHART
Click chart to enlarge. Chart courtesy of StockCharts.com.
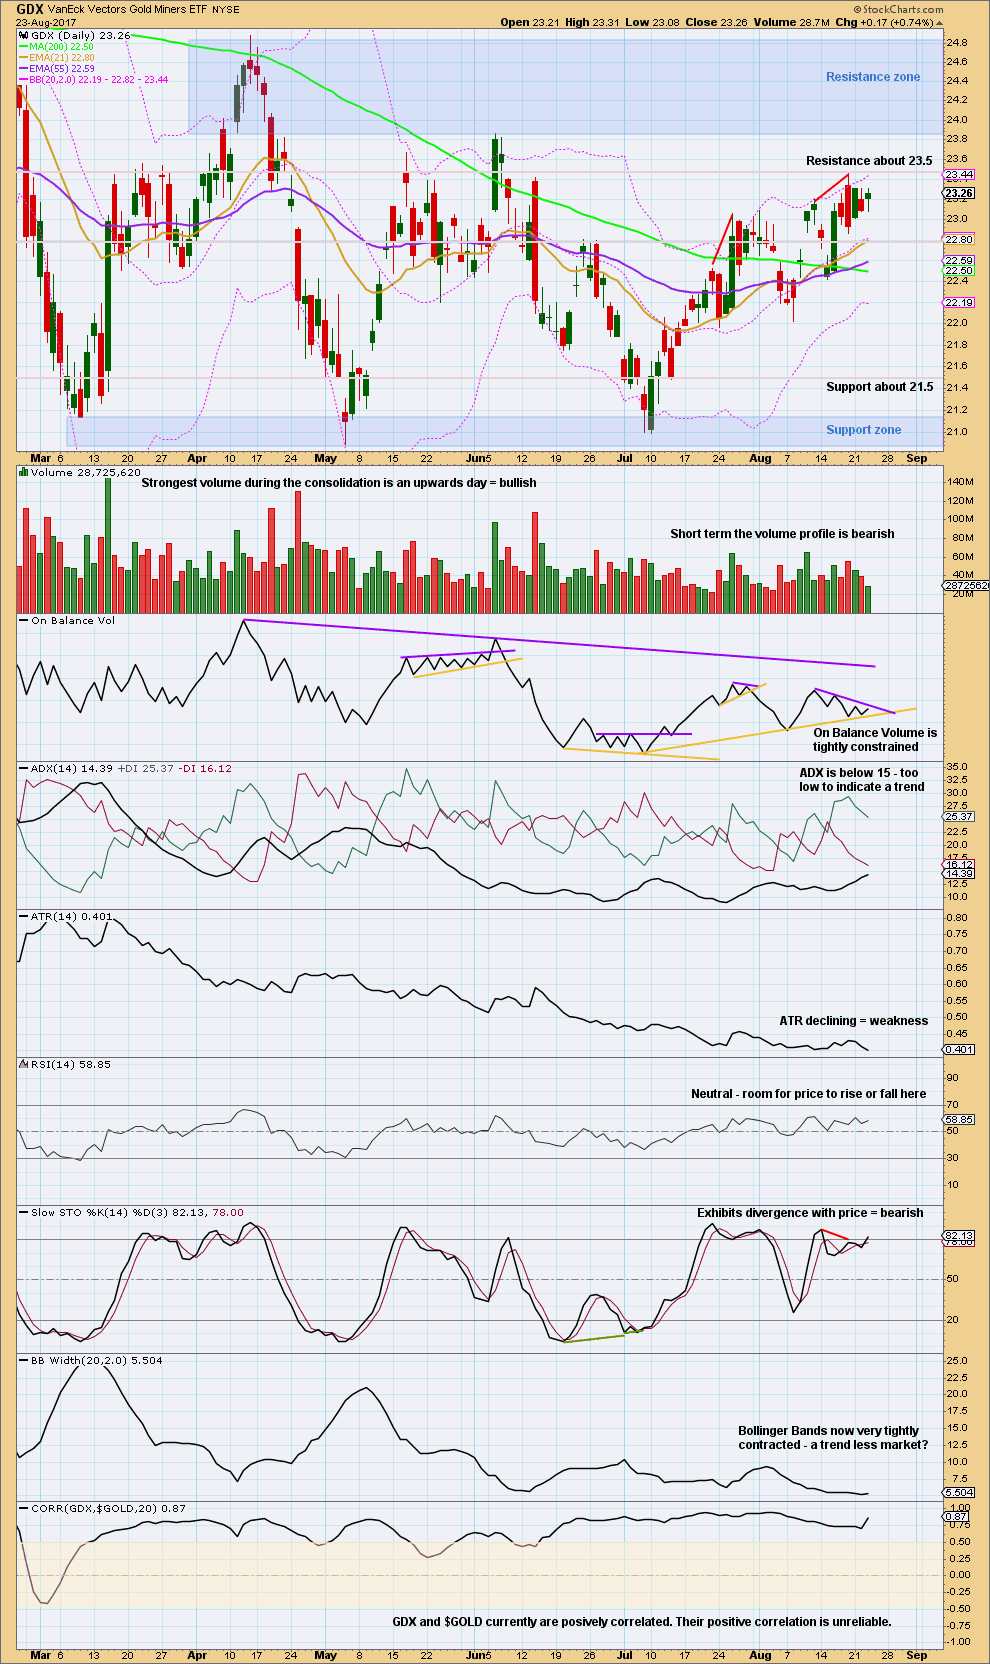
GDX is expected to be in a large consolidation. New support and resistance zones are outlined. Resistance is about 24.85 to 23.85, and support is a smaller zone about 21.15 to 20.90. During this consolidation, it is still an upwards day which has strongest volume suggesting an upwards breakout is more likely than downwards.
However, the signal from volume here regarding the breakout is not very clear. The next three strongest days are all downwards days.
Bollinger Bands continue to be tightly contracted and ATR continues to decline. This strongly suggests a large consolidation.
We need to wait for the breakout from the support or resistance zones to have confidence in the next trend for GDX. An upwards breakout should have good support from volume. A downwards breakout does not need to have support from volume, but if it does then more confidence may be had in it.
Price moved essentially sideways for Wednesday’s session with the same high and same low as Tuesday. A strong decline in volume is short term bearish. Upwards movement during the session does not have support from volume.
The long lower wick is bullish.
Published @ 08:22 p.m. EST.
Preferred count updated hourly chart:
Minute iv moving sideways? A triangle for wave B within it?
It sure does look like a triangle is forming. If it’s a fourth wave then there’s a final fifth wave up to come, which would expect essentially the same movement as this wave count but the subdivisions within intermediate (Y) would be different, and I haven’t been able to figure that out yet.
Nothing doing today it seems. I guess maybe it all comes down to Yellen’s speech or whatever she’s doing tomorrow morning. Looks like some sort of triangle in there somewhere although don’t know how it fits in the big picture. If it’s a second wave, can’t just be a triangle. Maybe it’s within a combination
Or the big C wave in the bearish cont completed as an ending diagonal already in the move over 1300, and this is and ABC second wave and about to head down hard. Could be that i suppose
Thanks for the comments, Eli! It’s nice to read some thoughts.
Looking at GDX on the daily, it appears it’s a rising wedge which can also suggest that downwards action is imminent. Per Lara, GDX shows resistance at 23.50 and it’s nearly there too.
Then again, it’s expected that gold is reach a new high above 1300.
Lots of signs with no real clarity, huh? I can’t imagine Yellen or Draghi saying anything that would rattle the markets. I would expect them to calm things down with their comments which would most likely pull the plug on gold for a little while and also stabilize the S&P.
I wonder what wave we’re in with the S&P because that could be a signal as well.
Hi Stephen. GDX tough to call as well. But it’s certainly been limping higher, and not signaling a big move up in gold. And it’s technically overbought. But i can see a few positives in its chart as well. Just nothing very exciting.
Spy is always tough to call and trade for me. Overall i think it’s neural at the moment, and i lean toward bearish but mostly because my biz partner is bullish. lol
I haven’t heard much chatter about the USD lately, and looking at the daily and weekly chart, it’s still pretty bearish. I wonder if that will change tomorrow.
I guess i should just be out of the market at the moment as there are no clear signals to me and i’m kinda gambling. I haven’t been able to exhibit that type of discipline yet and i think it’s my biggest flaw as a trader. No patience. Other than to keep the positions on the low side at the moment. Not making the big bet on this
is NFP this week, or next Friday?
NFP is definitely not taking place this Friday. However, Yellen is scheduled to speak at 10:00 this Friday following the conclusion of the symposium.
The last time NFP was released, I believe Lara was expecting a big breakout and published the topic as a separate item but gold traveled south instead. My stop had to kick in… whomp whomp!
Here’s a calendar of economic events:
https://www.bloomberg.com/markets/economic-calendar
I’m so sorry everybody, I read the date wrong 🙁
You’re right, it’s next week