
Another small range inside day suggests a small Pennant may be forming. A new Elliott wave count sees a possible triangle completing.
Summary: The breakout for the short term is expected to be upwards after sideways movement ends. It may end before 1,317.52, or it may possibly end at the Magee trend line about 1,320.
Thereafter, a new downwards wave should develop.
Always use a stop. Invest only 1-5% of equity on any one trade.
New updates to this analysis are in bold.
Last monthly charts and alternate weekly charts are here, video is here.
Grand SuperCycle analysis is here.
MAIN ELLIOTT WAVE COUNT
WEEKLY CHART
Click chart to enlarge.
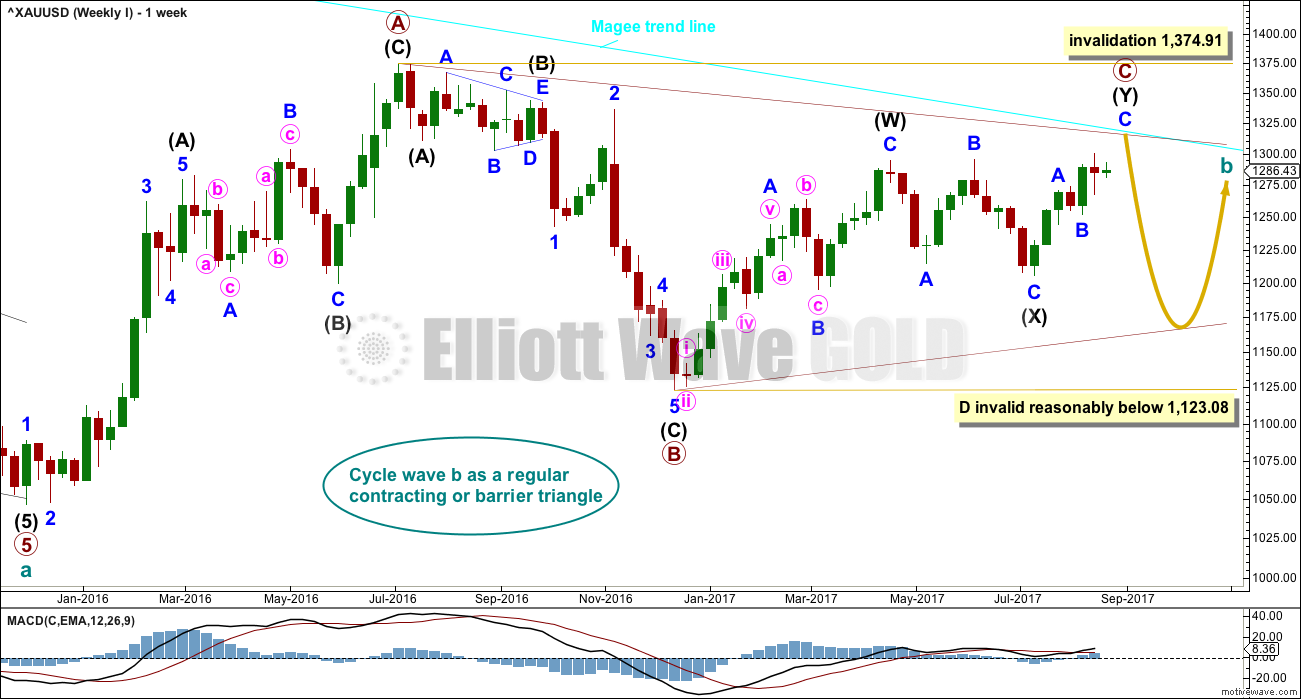
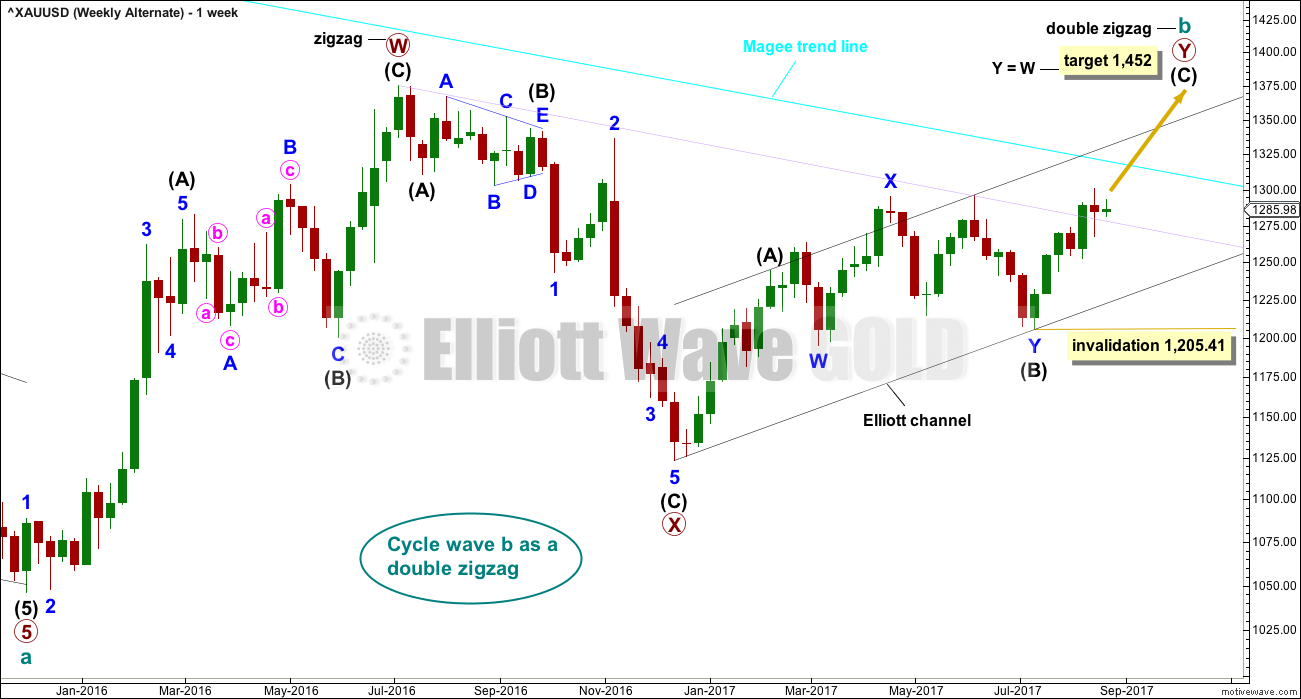
The Magee bear market trend line is added to the weekly charts. This cyan line is drawn from the all time high for Gold on the 6th of September, 2011, to the first major swing high within the following bear market on the 5th of October, 2012. This line should provide strong resistance.
To use this trend line in the way Magee describes, we should assume that price will find resistance at the line if it gets back up there. If the line is breached (by at least one or two full daily candlesticks above it), it will be signalling a major trend change from bear to bull. At that point the alternate Elliott wave count should be preferred.
At this stage, a triangle still looks possible and has the best fit for cycle wave b. It has strong support now from declining ATR and MACD hovering about zero.
Within a triangle, one sub-wave should be a more complicated multiple, which may be primary wave C. This is the most common sub-wave of the triangle to subdivide into a multiple.
Intermediate wave (Y) now looks like a developing zigzag at the weekly chart level, and minor wave B within it shows up with one red weekly candlestick. Primary wave C may end at the Magee trend line.
Primary wave D of a contracting triangle may not move beyond the end of primary wave B below 1,123.08. Contracting triangles are the most common variety.
Primary wave D of a barrier triangle should end about the same level as primary wave B at 1,123.08, so that the B-D trend line remains essentially flat. This involves some subjectivity; price may move slightly below 1,123.08 and the triangle wave count may remain valid. This is the only Elliott wave rule which is not black and white.
Finally, primary wave E of a contracting or barrier triangle may not move beyond the end of primary wave C above 1,295.65. Primary wave E would most likely fall short of the A-C trend line. But if it does not end there, then it can slightly overshoot that trend line.
Primary wave A lasted 31 weeks, primary wave B lasted 23 weeks, and primary wave C may now have just completed its 35th week. A double zigzag may be expected to be longer lasting than single zigzags within a triangle, and so this continuation of primary wave C is entirely acceptable and leaves the wave count with the right look at this time frame.
DAILY CHART
Click chart to enlarge.
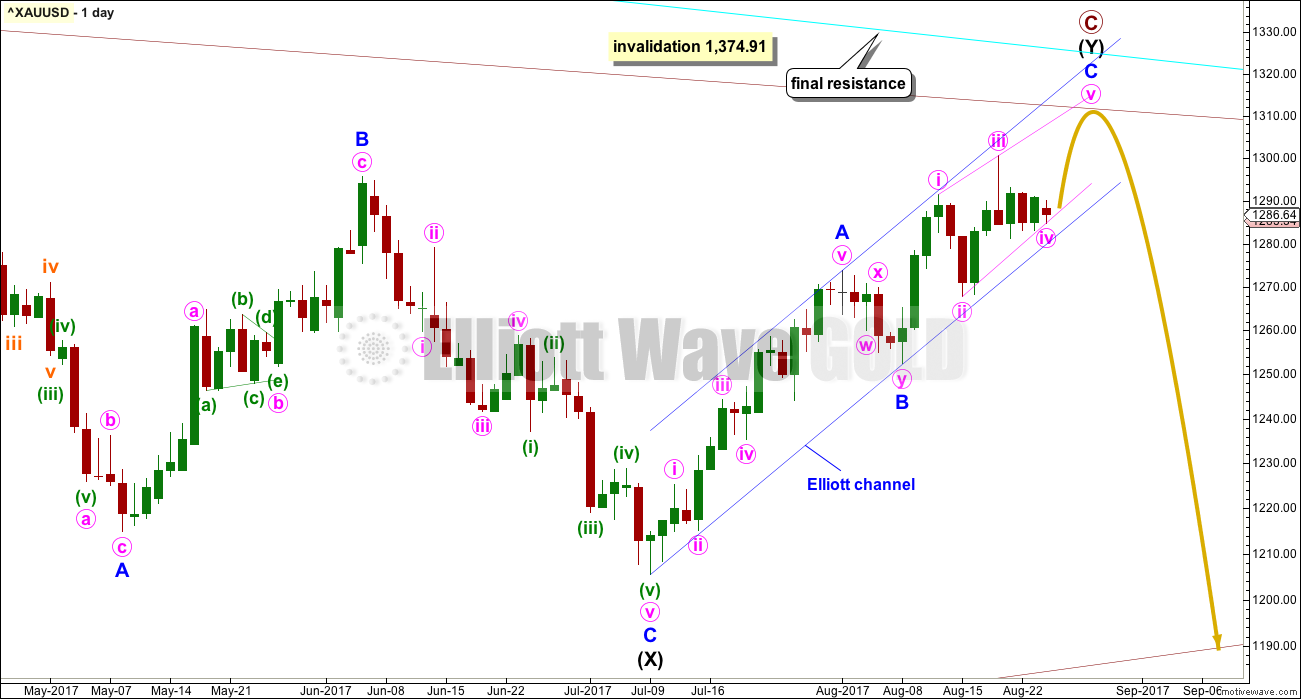
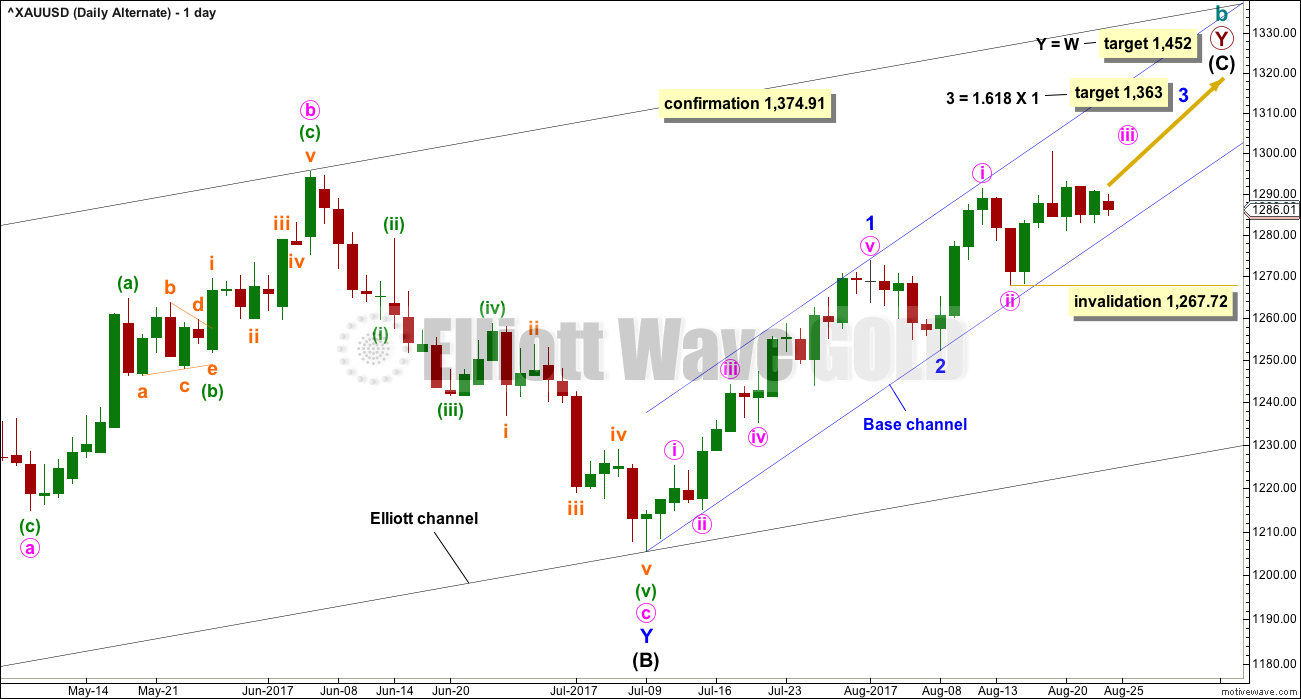
A target is no longer calculated for primary wave C to end. The best guide to where upwards movement may end may be trend lines.
The cyan Magee trend line should offer very strong resistance. This wave count does not expect it to be breached. Recently, price has found resistance a little below the line, so it may not be touched.
The pink i-iii diagonal trend line may be the best guide as to where upwards movement may end. As soon as that line is slightly overshot, then look out for a quick reversal.
The blue trend channel may be the best guide to confidence in a trend change. A breach of the lower edge of that channel would provide reasonable confidence that a high is in place.
There are two possible structures for minor wave C within the zigzag of intermediate wave (Y). Minor wave C must be a five wave structure, so it may only be an impulse or an ending diagonal.
Price has moved sideways in the last few days to complete three inside days in a row. It looks like a triangle may be forming. This may be minor wave B and is considered in a new alternate below.
A diagonal for minor wave C is still considered as labelled here on the daily chart, but an impulse will no longer be published. Overlapping of the last few days does not look like the start of a strong third wave upwards.
FIRST HOURLY CHART
Click chart to enlarge.
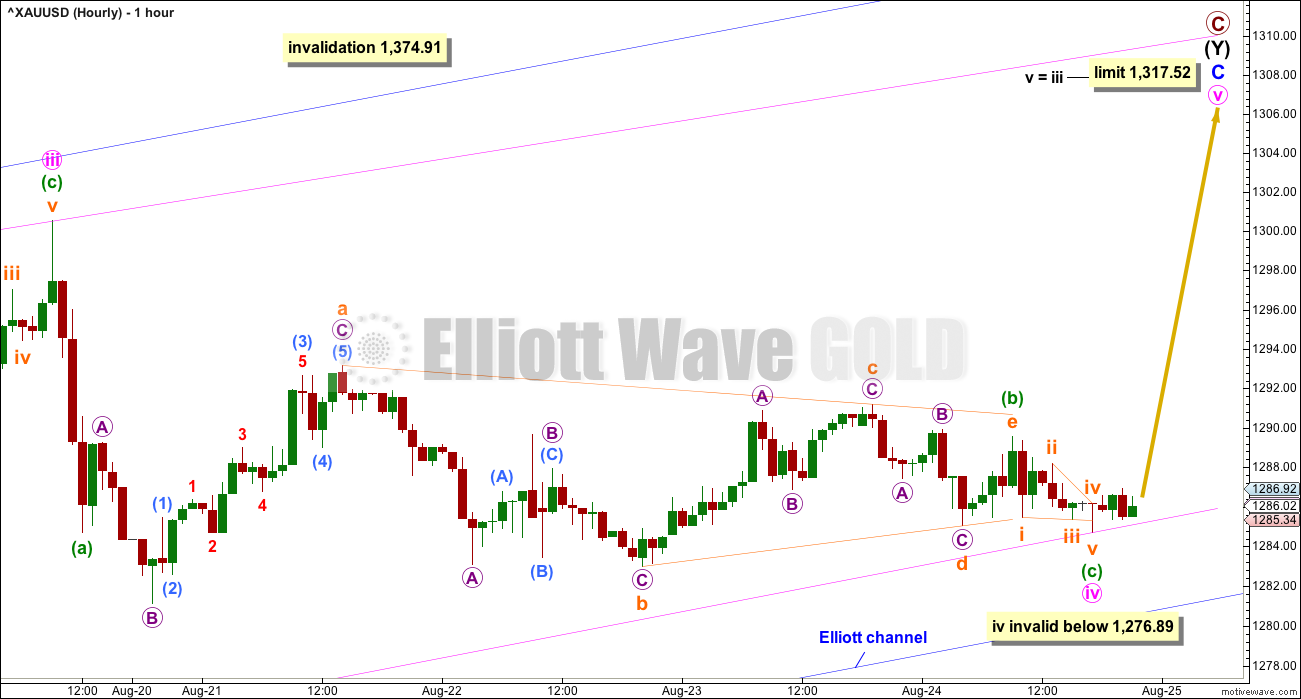
With sideways movement of the last three days, this is no longer the preferred wave count. It may be judged to have about an even probability with the new second wave count below.
Minor wave C may still be an ending diagonal, which is more common as contracting than expanding. The classic pattern equivalent here is a rising wedge. They are terminal structures.
This diagonal would be contracting because minute wave iii is slightly shorter than minute wave i.
Minute wave iv continued sideways. It may still be seen as a zigzag, but if minuette wave (c) is over, it is very slightly truncated by 0.01. If it continues any lower, it may not be longer than equality in length with minute wave ii, so it may not move below 1,276.89. If minute wave iv does move lower, then the diagonal trend lines must still converge.
Minute wave v may not be longer than minute wave iii. It must be shorter than minute wave iii, so it must end before the limit at 1,315.81.
No target is provided for minute wave v to end, and it may not exhibit a Fibonacci ratio to minute waves i or iii. The i-iii trend line should be used to indicate when minute wave v may be over. If price moves above the end of minute wave iii at 1,300.53 and then overshoots the i-iii trend line, then the diagonal may be complete. Contracting diagonals almost always end with overshoots of their i-iii trend lines.
Ending diagonals are commonly followed by sharp reversals. If this wave count is correct, then the first downwards movement after the diagonal is complete may be very strong and fast.
Use the blue Elliott channel as an indication of when primary wave C is over. A breach below the lower edge of the channel would be a strong indication of a trend change.
SECOND HOURLY CHART
Click chart to enlarge.
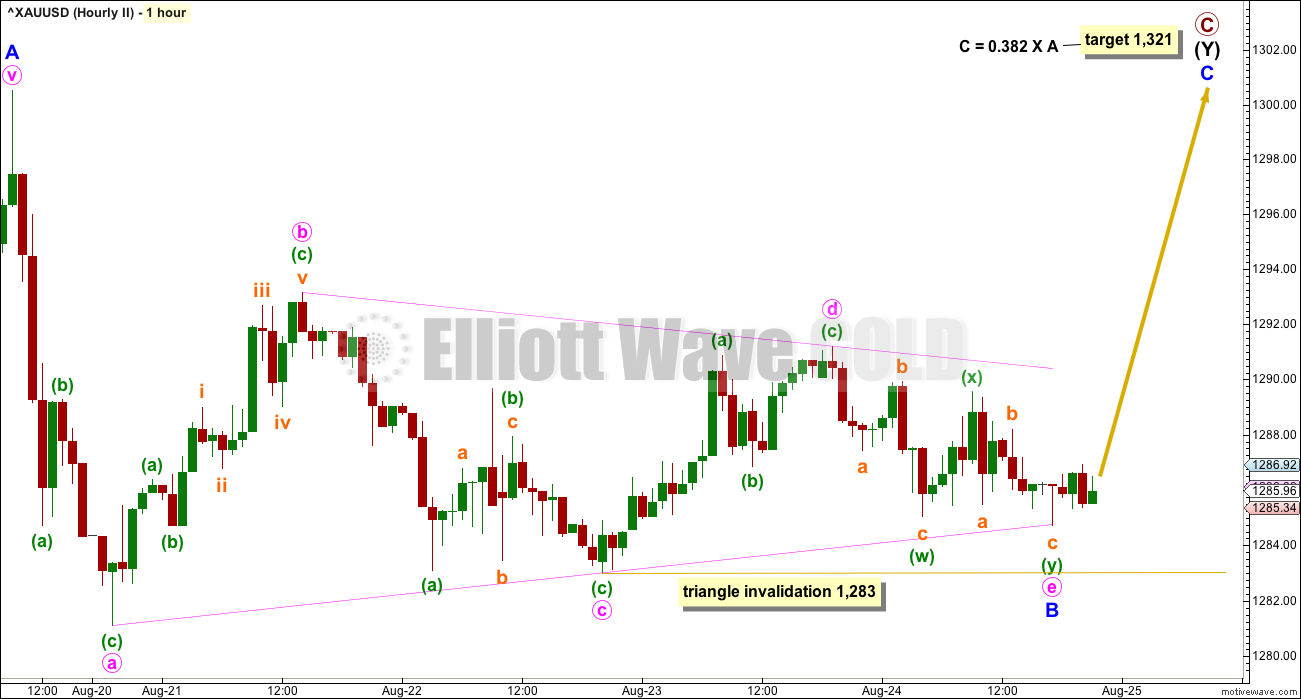
This idea is new. I have tried to see if a triangle may be unfolding in a fourth wave position, but I was not able to resolve how the upwards movement at the high labelled minor wave A could only be the end of a third wave. It will fit as the end of a fifth wave though, so the triangle may be in wave B position.
Minor wave B may be a regular contracting triangle. The more complicated multiple of a double zigzag may be minute wave e. E waves most commonly end short of the A-C trend line, but occasionally they may overshoot the line. Here, minute wave e ends at the trend line; this is unusual, so it may not be over and may end after some further sideways movement.
If minor wave C begins about today’s low, then about 1,321 it would exhibit a Fibonacci ratio of 0.382 to minor wave A. This Fibonacci ratio is chosen for the target calculation because it fits nicely with resistance at the cyan Magee trend line on weekly and daily charts.
If the target is wrong, it may be too high. There would still be very strong resistance to overcome about 1,305 to 1,310.
Within the triangle, minute wave e may not move beyond the end of minute wave c below 1,283.00.
ALTERNATE ELLIOTT WAVE COUNT
WEEKLY CHART
Click chart to enlarge.
This wave count has been published only in historical analysis. At this stage, it will be published on a daily basis.
There are more than 23 possible corrective structures that B waves may take, and although cycle wave b fits best at this stage as a triangle (main wave count), it may still be another structure. This wave count looks at the possibility that it may be a double zigzag.
If cycle wave b is a double zigzag, then current upwards movement may be part of the second zigzag in the double, labelled primary wave Y.
The target remains the same as previously published for this wave count.
Along the way up, some resistance should be expected at the cyan Magee trend line. Because this wave count requires price to break above the Magee trend line, it must be judged to have a lower probability for this reason. This trend line is tested multiple times and goes back to 2011. It is reasonable to expect price to find resistance there, until proven otherwise.
Within intermediate wave (C), no second wave correction may move beyond the start of its first wave below 1,205.41.
DAILY CHART
Click chart to enlarge.
Intermediate wave (C) may be unfolding as an impulse.
Within the impulse, minor waves 1 and 2 would now be complete. Minor wave 3 must unfold as an impulse, and within it minute waves i and now ii would also be complete.
HOURLY CHART
Click chart to enlarge.
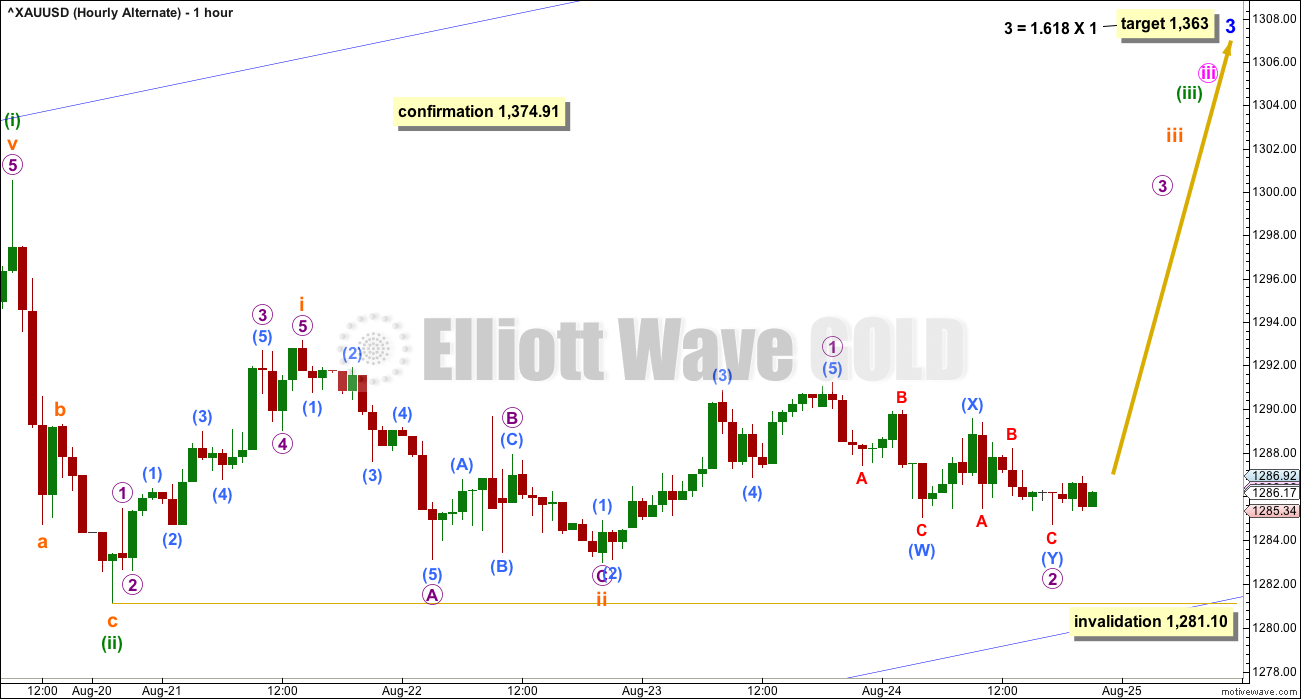
Minor wave 3 may only subdivide as an impulse for this alternate wave count. Minor wave 3 may not be a diagonal.
At this stage, with sideways movement for three days in a row, this does not look like the start of a strong third wave upwards. Although they can sometimes start off slowly, that slow beginning usually includes new highs and not inside days.
The target is now different. This wave count is more bullish, and it expects to see a breach of the Magee trend line.
TECHNICAL ANALYSIS
WEEKLY CHART
Click chart to enlarge. Chart courtesy of StockCharts.com.
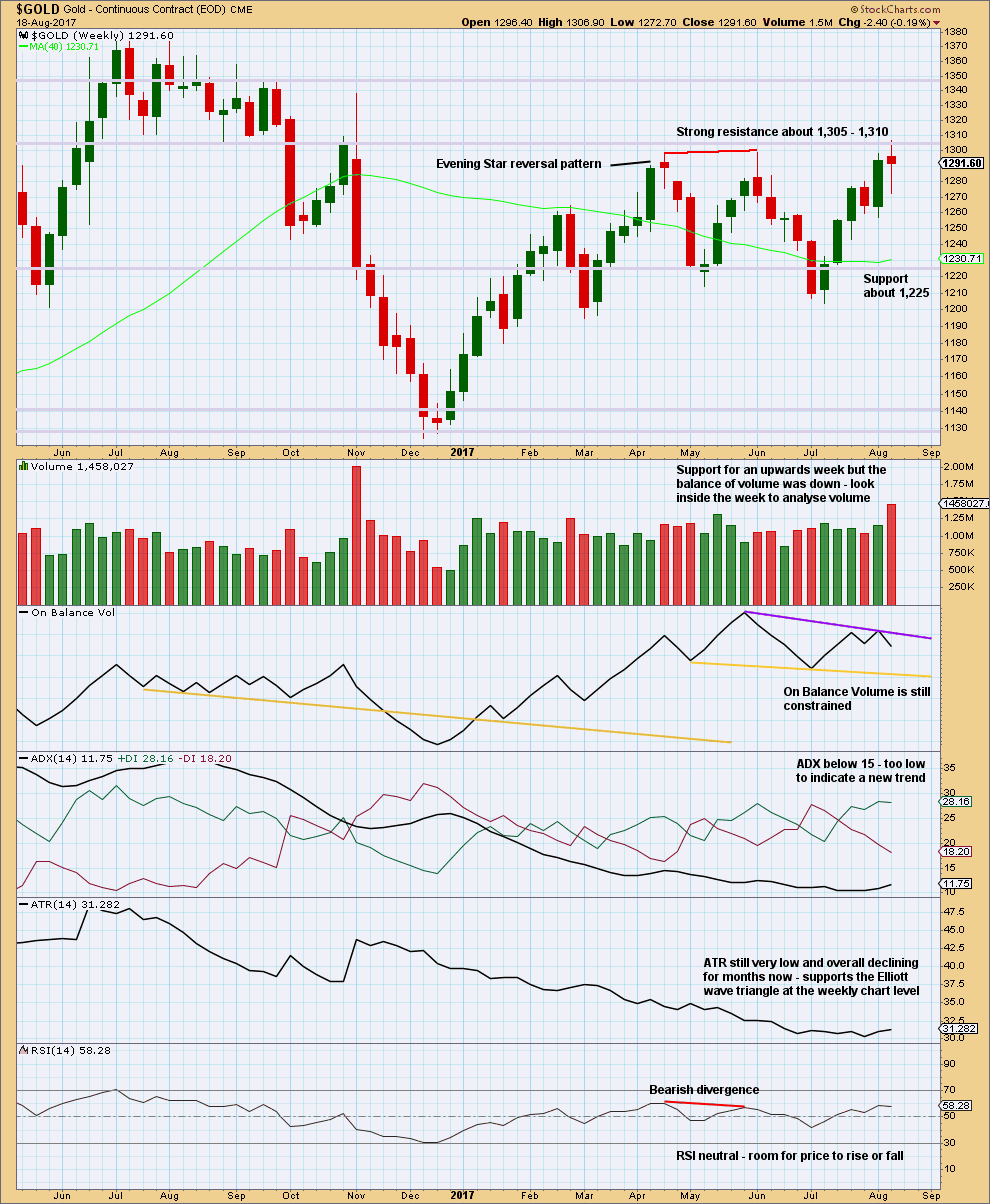
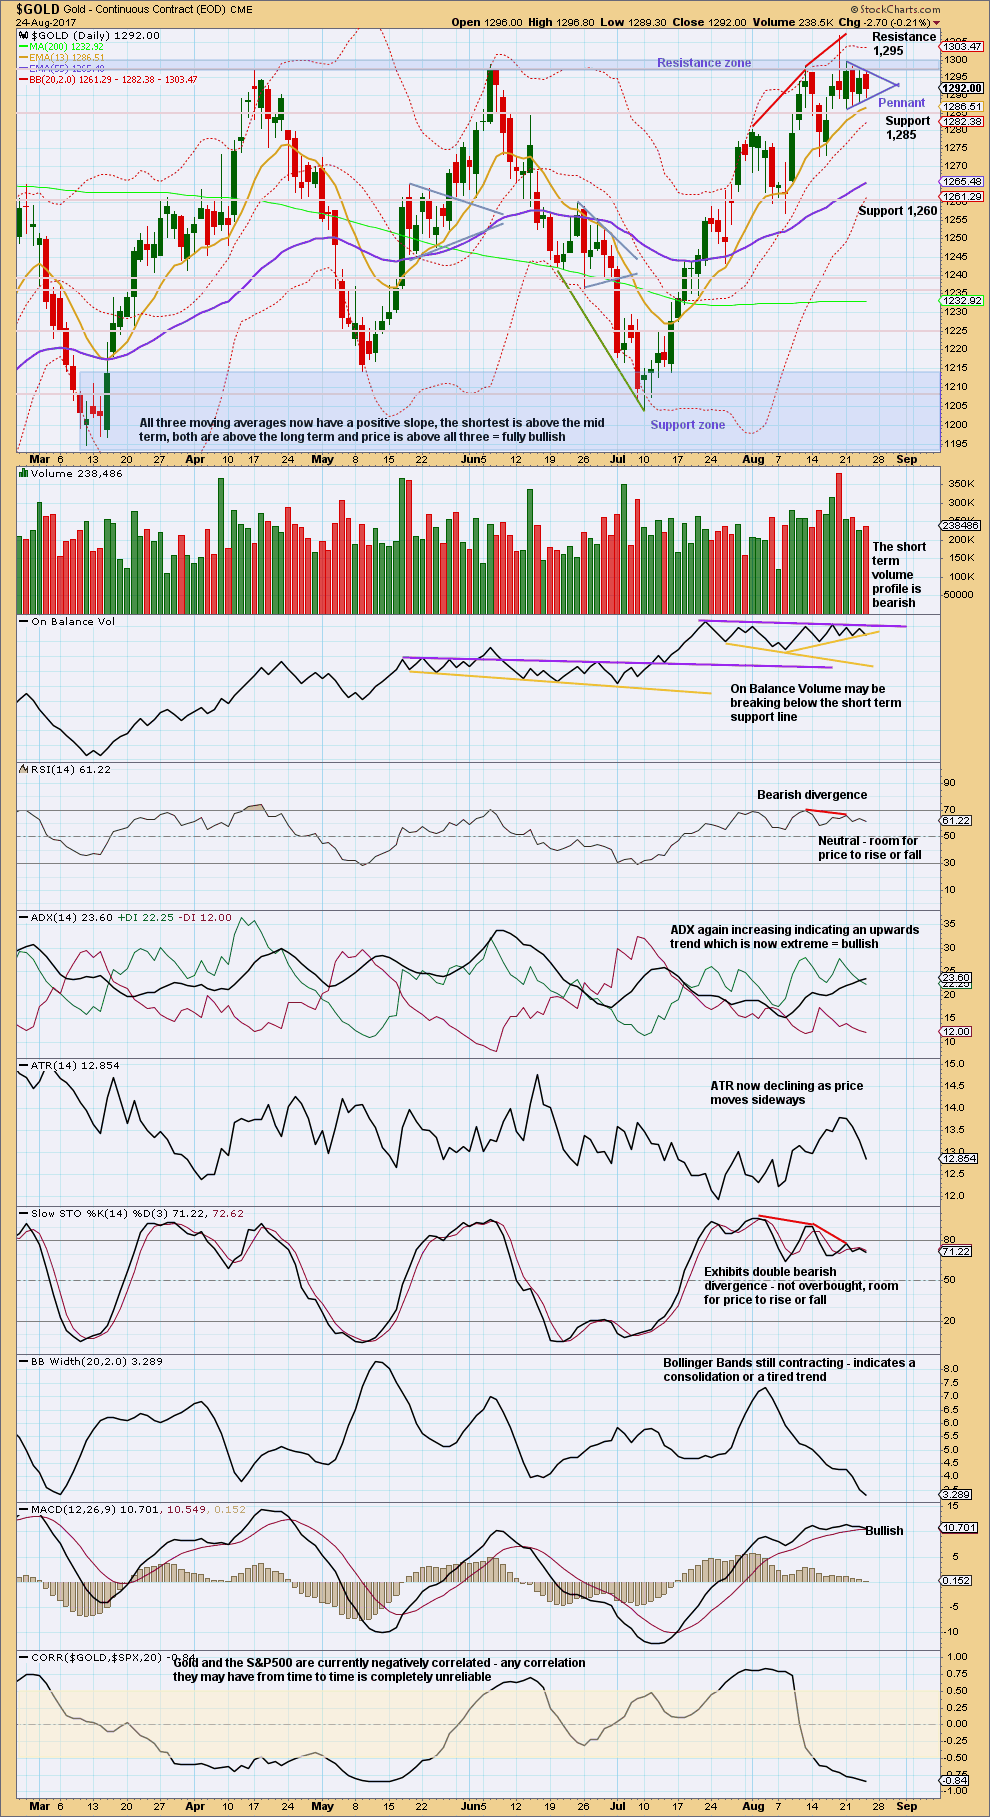
Price is finding very strong resistance about 1,310.
The upper purple resistance line for On Balance Volume is adjusted. On Balance Volume turning down from this line is a bearish signal.
ADX and ATR at the weekly chart level still strongly support the main Elliott wave count.
DAILY CHART
Click chart to enlarge. Chart courtesy of StockCharts.com.
During the long consolidation phase, it is now the 18th of August that has strongest volume. This session moved price higher with a higher high and a higher low, but the balance of volume during the session was downwards. There was strong support during the session for downwards movement, which created the Shooting Star candlestick pattern.
This now suggests that the breakout from this large consolidation may more likely be downwards than upwards, and this now agrees with the main Elliott wave count.
Above resistance at 1,305 to 1,310 is further resistance up to about 1,320. Price continues to find very strong resistance about 1,305.
A small pennant pattern now looks to be unfolding for Gold as well as GDX. Using the measured rule gives a target here at about 1,398. However, this is contradicted by most recent volume being stronger for downwards days suggesting a downwards breakout.
On Balance Volume may today be giving a weak bearish signal. I would want the breach of the upwards sloping yellow line to be clearer though before having confidence in this signal. The line has a slight slope and has been tested four times, but is not long held. The signal is only a weak one.
This chart still is reasonably bearish despite the Pennant pattern.
GDX
DAILY CHART
Click chart to enlarge. Chart courtesy of StockCharts.com.
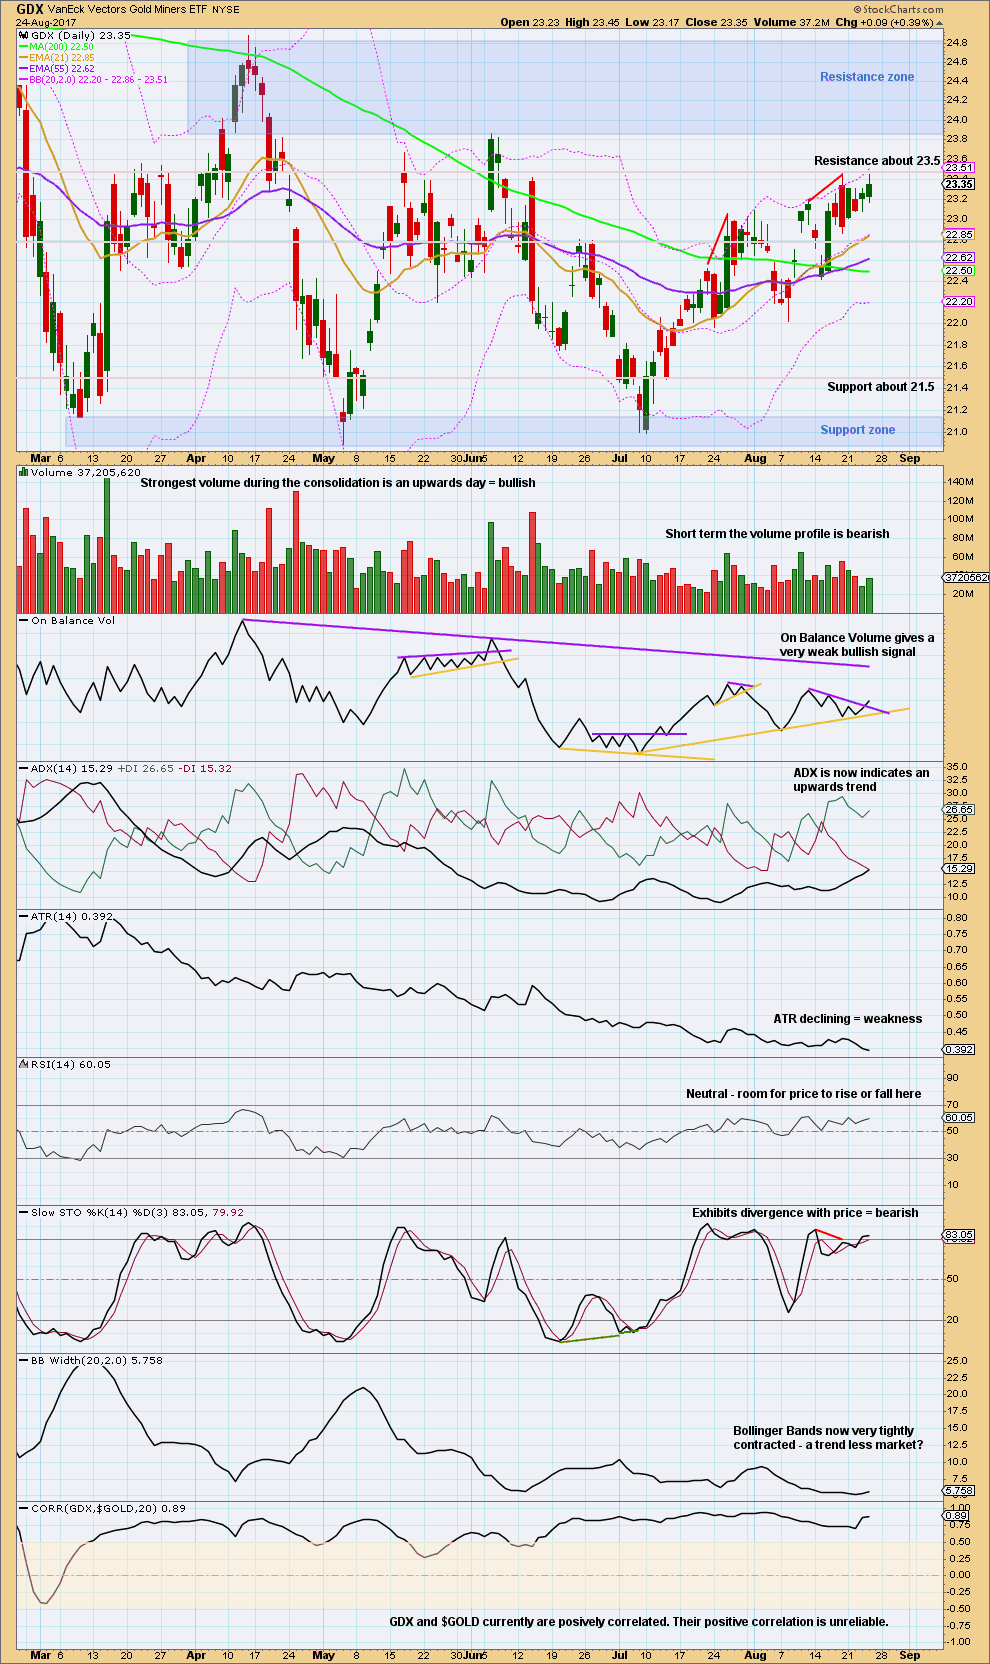
GDX is expected to be in a large consolidation. New support and resistance zones are outlined. Resistance is about 24.85 to 23.85, and support is a smaller zone about 21.15 to 20.90. During this consolidation, it is still an upwards day which has strongest volume suggesting an upwards breakout is more likely than downwards.
However, the signal from volume here regarding the breakout is not very clear. The next three strongest days are all downwards days.
Bollinger Bands continue to be tightly contracted and ATR continues to decline. This strongly suggests a large consolidation.
We need to wait for the breakout from the support or resistance zones to have confidence in the next trend for GDX. An upwards breakout should have good support from volume. A downwards breakout does not need to have support from volume, but if it does then more confidence may be had in it.
Price continues to move in a very small and declining range, with strong resistance about 23.50.
The only thing that is clear for GDX at this time is it is trendless. The next direction is unclear.
Very little weight will be given today to the possible signal from On Balance Volume. The purple trend line is short held, has a slope, and has only been tested twice before.
Published @ 10:46 p.m. EST.
Regarding the expected direction of Gold and GDX:
At this time GDX is unclear. I would rather let my analysis of Gold lead and GDX follow.
Both may break out downwards, and both may break out upwards.
The only thing which is clear is that both are in a huge consolidation.
I am expecting that a downwards breakout for both is more likely.
A possible structure for the last consolidation: a zigzag, wave (b) within it a running flat.
At this stage I have not been able to see an alternate way of labelling this, but I’ll keep looking because a running flat is rare.
The diagonal still works if the trend lines still converge. A new limit is calculated.
USD got creamed today. Gold doesn’t seem to care. Seems only concerned with what the stock market does, at least for the time being
Per PMBull data both hourly wave counts got invalidated.Price spiked to 1276.196.
Target now for 1320.
Low was 1,280.76 using Lara’s data
Treacherous trading conditions lol… Not too sure if it matters what the low of the day was [[Bar Chart 1280.76, Gold Price 1275.34, Net Dania 1275.09, Futures December contract (GCZ7) 1281.56]].
Imo what matters is that 1275 held, Gold price rebounded with some vigor from the low, is bullish and we have a higher low than previous 1267. Notwithstanding an expected pullback (possible snap drop) for Monday, can still expect Gold price to attempt to reach 1300-1305 despite tough resistance 1295+. Lets see what happens. Waited and waited and waited since 17-Aug for a break below 1281 to go long, got it! 🙂
Gold is looking good to the upside it seems with strong candlestick reversal.
2nd Hourly is invalidated with a price drop below 1283.00.
I show 1274.47 ?
Possible ideas in play include expanded flat for minute 2 for alternate hourly. Diagonal still in play for main.
Zig zag for Minute 4 of 1st Hourly.
Alternate Hourly is invalidated, but not the Daily.
Minuette 2 continued as a zigzag to 1280.76.
what just happened?
The recent choppy rangebound motion of gold left me in the doldrums. Currently wedged between 1282 and 1295, the trend is neutral. Price is waiting for some external stimulus to push it beyond the boundaries. Perhaps Yellen may be able to work her magic.
Personally, I expect prices to respect the 1282 support and start a new upward move soon, with a short-term target of 1320. But, if in the event that prices break below 1275, the short-term trend will be in danger, and a push towards 1250 (top cloud boundary on the daily chart) is possible. However, with prices trading above the tenkan-sen in the daily timeframe, plus the fact that tenkan-sen lies above kijun, and both lying above the kumo, a drop is quite unlikely.
GDX remains within a trading range and I’ve been monitoring several possible counts, but have not felt confident of the mid term direction. I can see both bull and bear outcomes. Frustrating to trade at the least.
Today GDX showed some strength relative to Gold. An up day with a slight volume increase while gold slightly declined. GDX is trying to break above the purple downtrend line that has held since February. It closed above the line. If tomorrow’s candle is 100% above the trendline, that would be a short term bullish sign which could lead to upside follow-through.
Conversely, if tomorrow closes back below the trendline, that may be a bearish signal. We may have a rising wedge in play. These often, but not always, resolve to the downside.
https://www.tradingview.com/x/Np9V62cL/
Chart masterpiece. Thanks. Be nice to hit the most upper trendline. 🙂
Posting an excerpt from a free video from EWI’s Tom Denham. He says there’s no such thing as “Triple Tops” and expects Gold to move higher. How much higher, is not disclosed.
http://www.elliottwave.com/ElliottWaveTV/Will-Golds-Non-Rally-Continue?sc_camp=1A64C75170D748128982672C2487330E