
Upwards movement was expected to continue to a target at 1,317. Price has reached 5.03 above the target.
Summary: Assume the trend remains the same until proven otherwise. Assume the larger bear market remains intact while price remains below the bear market trend line.
Price must turn here for the main wave count to print a red daily candlestick tomorrow. The high is right below the Magee trend line. Volume does not support upwards movement for Monday, so it is suspicious.
If the Magee trend line is breached by one or two full daily candlesticks above it, then the alternate wave count would be preferred. On Balance Volume today warns the alternate may be correct.
New updates to this analysis are in bold.
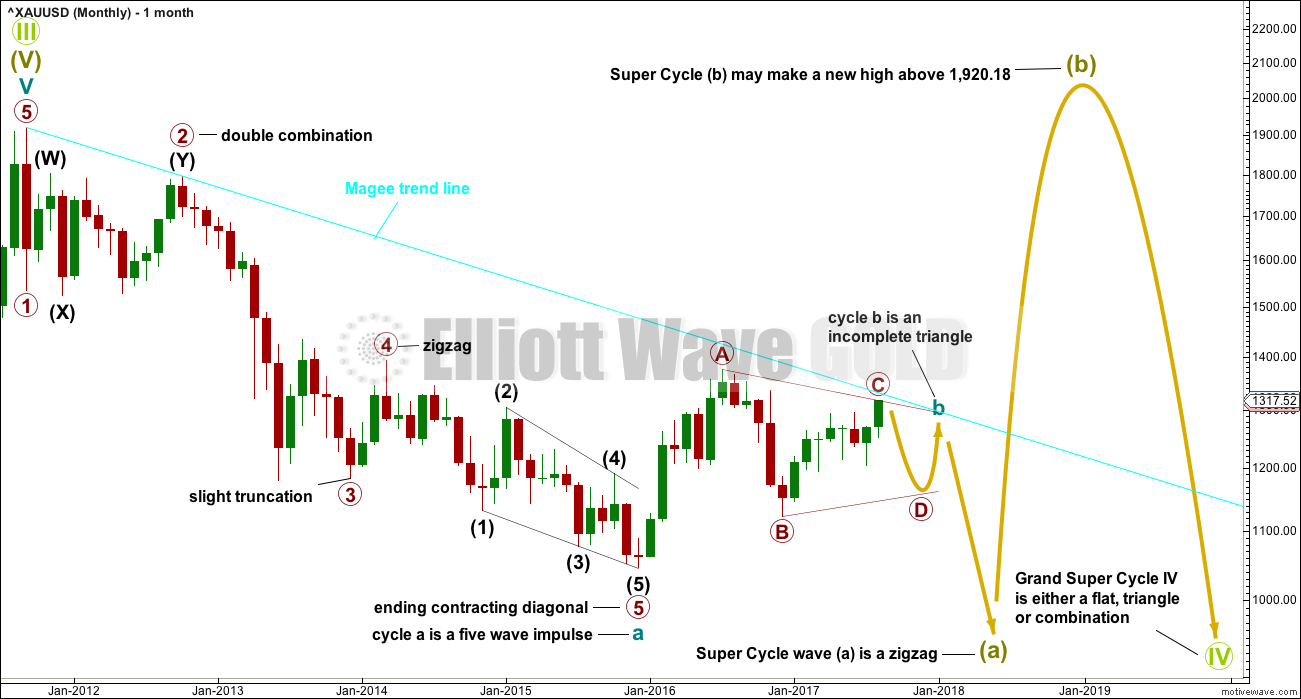
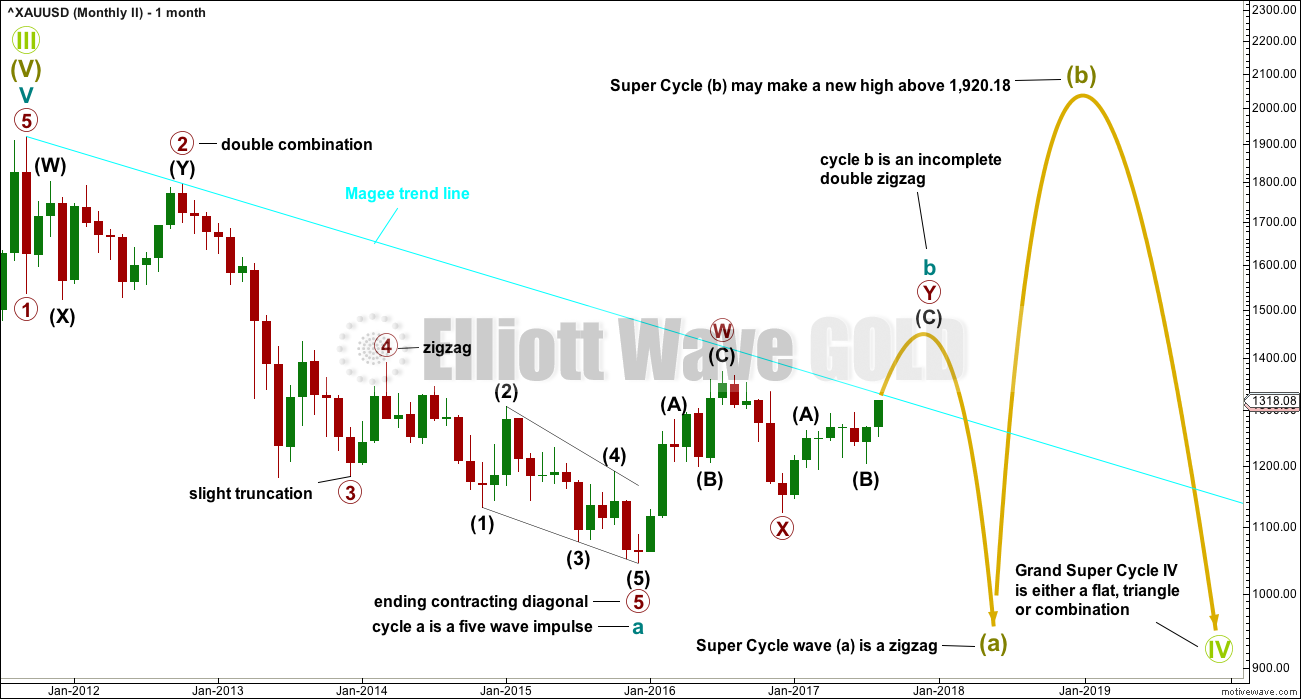
Grand SuperCycle analysis is here.
MAIN ELLIOTT WAVE COUNT
MONTHLY CHART
Click chart to enlarge.
The large downwards wave from September 2011 to December 2015 will fit as a five wave impulse.
Within the impulse, primary wave 3 ends with a truncation. This is acceptable, it came after a movement which may be described as “too far, too fast” for the middle of the third wave.
There is alternation between the double combination of primary wave 2 and the brief zigzag of primary wave 4. Zigzags are usually more brief structures than combinations, so this disproportion is acceptable.
Primary wave 5 is an ending contracting diagonal, meeting all rules for diagonals.
If the downwards wave labelled cycle wave a is a five, then the correction cannot be over there. This also suggests that the correction is a zigzag, or the first wave within it is a zigzag. Because of the expected duration of Grand Super Cycle wave IV, it looks best if Super Cycle wave (a) is seen as an incomplete zigzag.
The problem now becomes what to make of cycle wave b?
Cycle wave b may still yet morph into a combination or flat correction as its structure continues.
A bear market trend line is drawn from the all time high in September 2011 to the first major swing high in October 2012. This cyan trend line is copied over to weekly and daily charts. The bear market may be expected to remain intact while price remains below this line. Price may find strong resistance if it comes up again to touch the line.
Price today is almost touching this line. The first assumption should be to expect resistance. The line is very long held and has been tested twice before. A breach of this line at the daily chart level would be required to assume a more bullish wave count.
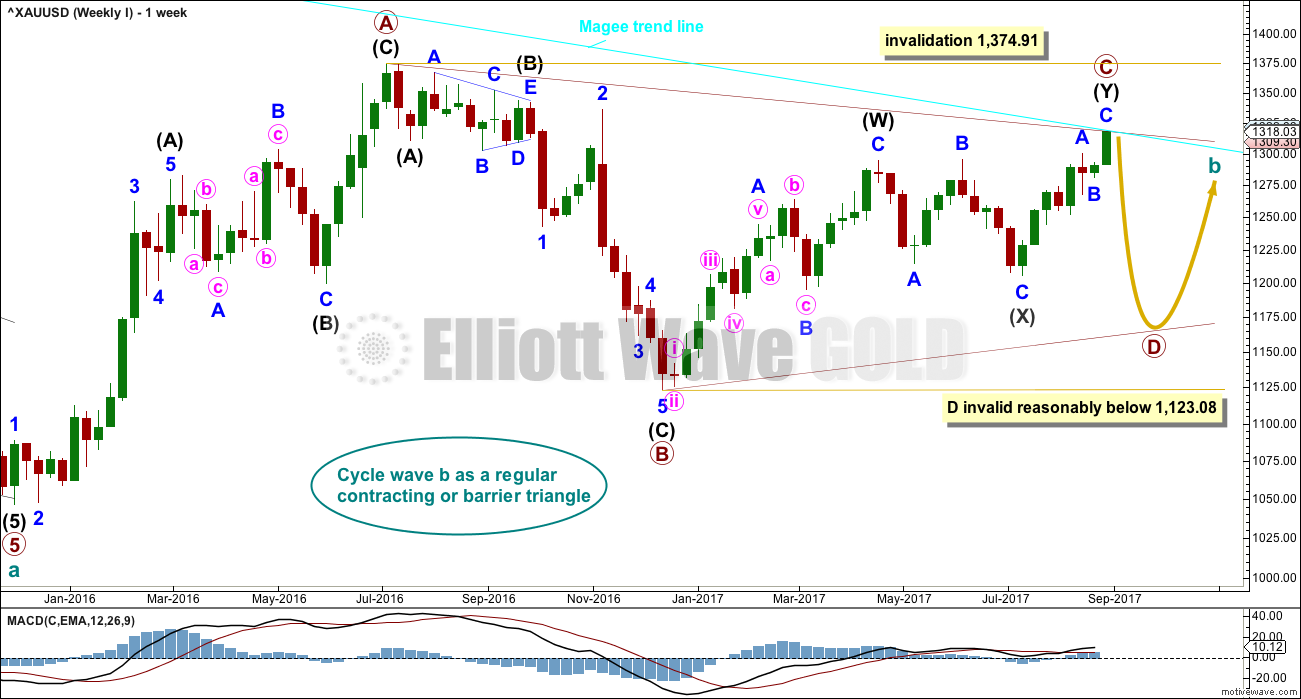
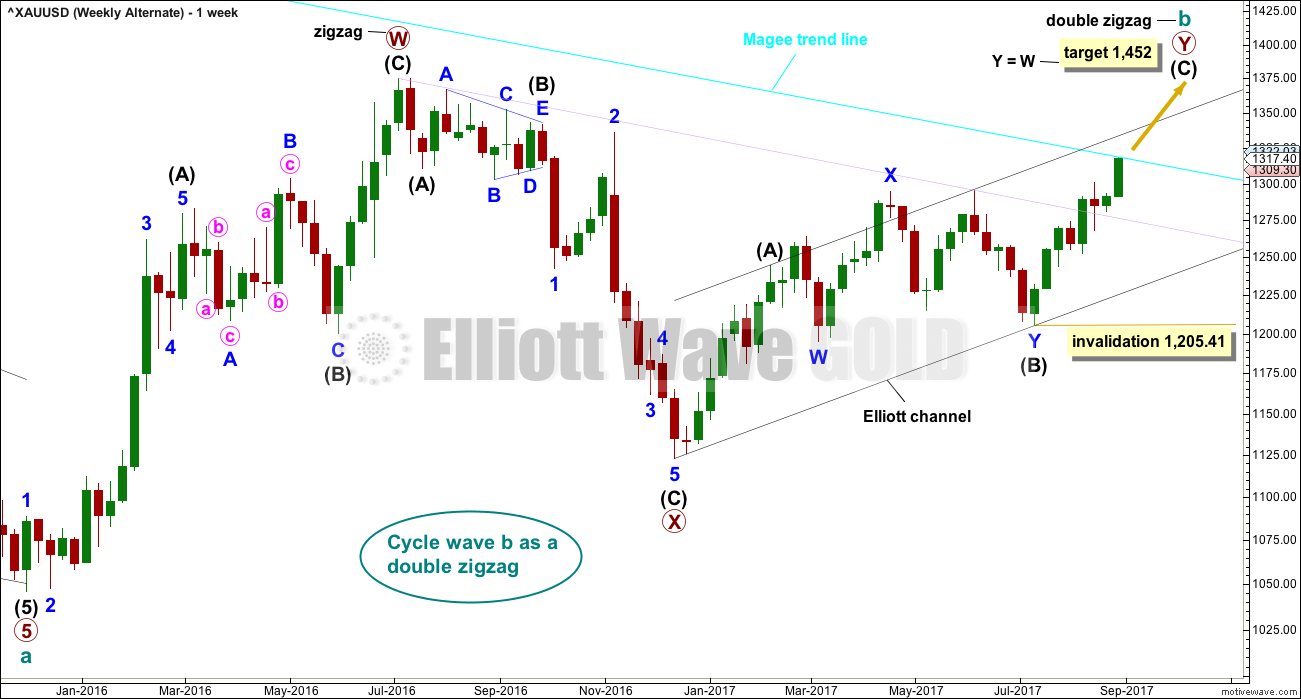
WEEKLY CHART
Click chart to enlarge.
The Magee bear market trend line is added to the weekly charts. This cyan line is drawn from the all time high for Gold on the 6th of September, 2011, to the first major swing high within the following bear market on the 5th of October, 2012. This line should provide strong resistance.
To use this trend line in the way Magee describes, we should assume that price will find resistance at the line if it gets back up there. If the line is breached (by at least one or two full daily candlesticks above it), it will be signalling a major trend change from bear to bull. At that point the alternate Elliott wave count should be preferred.
At this stage, a triangle still looks possible and has the best fit for cycle wave b. It has strong support now from declining ATR and MACD hovering about zero.
Within a triangle, one sub-wave should be a more complicated multiple, which may be primary wave C. This is the most common sub-wave of the triangle to subdivide into a multiple.
Intermediate wave (Y) now looks like a developing zigzag at the weekly chart level, and minor wave B within it shows up with one red weekly candlestick. Primary wave C may end at the Magee trend line.
Primary wave D of a contracting triangle may not move beyond the end of primary wave B below 1,123.08. Contracting triangles are the most common variety.
Primary wave D of a barrier triangle should end about the same level as primary wave B at 1,123.08, so that the B-D trend line remains essentially flat. This involves some subjectivity; price may move slightly below 1,123.08 and the triangle wave count may remain valid. This is the only Elliott wave rule which is not black and white.
Finally, primary wave E of a contracting or barrier triangle may not move beyond the end of primary wave C above 1,295.65. Primary wave E would most likely fall short of the A-C trend line. But if it does not end there, then it can slightly overshoot that trend line.
Primary wave A lasted 31 weeks, primary wave B lasted 23 weeks, and primary wave C may now have just completed its 36th week. A double zigzag may be expected to be longer lasting than single zigzags within a triangle, and so this continuation of primary wave C is entirely acceptable and leaves the wave count with the right look at this time frame.
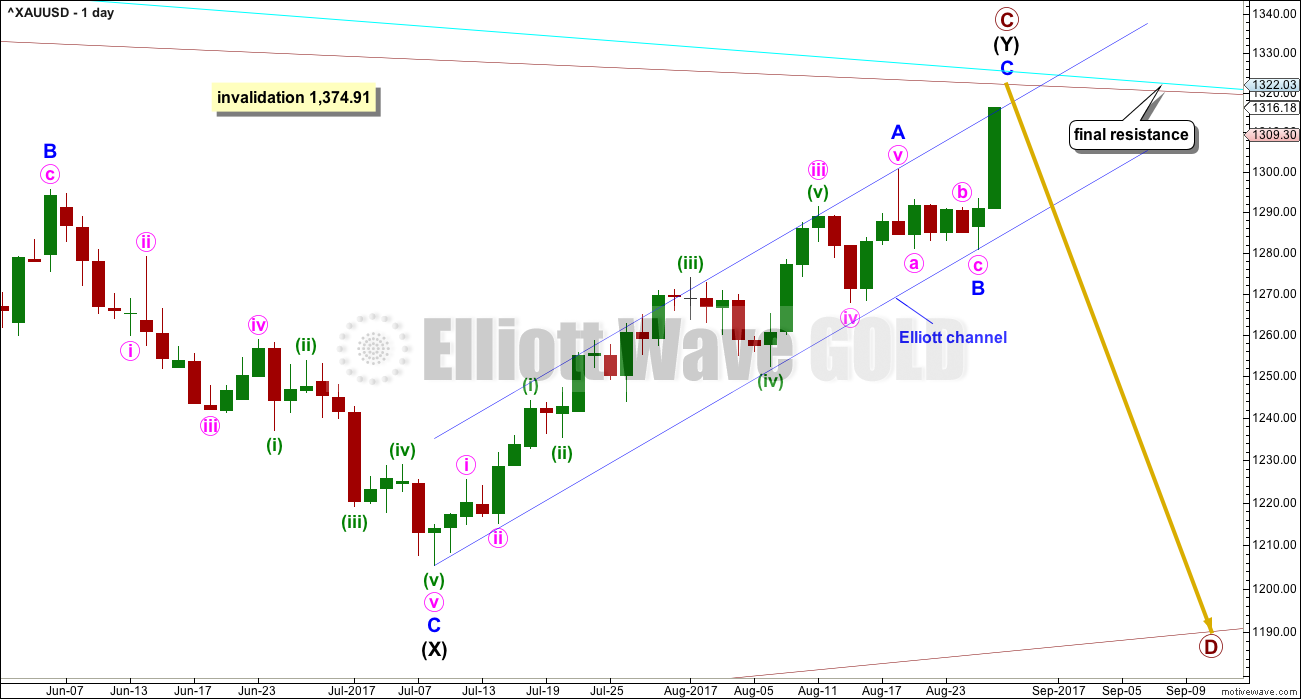
DAILY CHART
Click chart to enlarge.
The cyan Magee trend line should offer very strong resistance. This wave count does not expect it to be breached. Recently, price has found resistance a little below the line, so it may not be touched.
The high for Monday’s session is not showing in the last candlestick, so I have moved the label for primary wave C up to the high about 1,322. At this point the Magee trend line would be almost touched and so far price would remain just below it.
Intermediate wave (Y) may now be a complete zigzag. Minor wave C within it may now be a complete five wave impulse.
This wave count now requires a trend change.
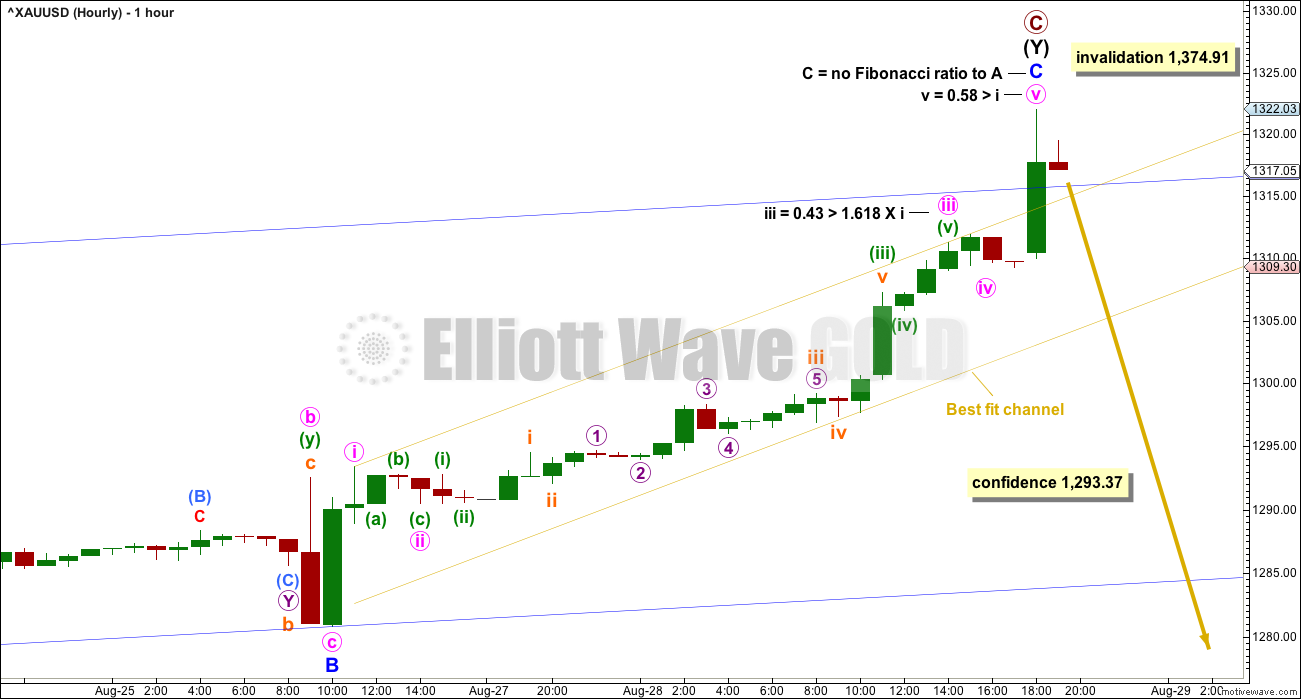
HOURLY CHART
Click chart to enlarge.
If minor wave C is over, then there are now Fibonacci ratios between all three actionary waves within it.
The earliest indication that price may be turning would be a breach of the yellow best fit channel. Thereafter, a breach of the blue channel would provide strong confidence in a trend change.
A new low below 1,293.37 would provide reasonable confidence in a trend change.
ALTERNATE ELLIOTT WAVE COUNT
MONTHLY CHART
Click chart to enlarge.
The alternate wave count is here shown on a monthly chart. It would require the Magee trend line to be breached by cycle wave b, and then for price to continue the bear market for cycle wave c. This would be odd behaviour with the trend line, but certainly is possible. It must be judged to have a lower probability while price remains below the line.
Both wave counts see the downwards structure labelled cycle wave a in the same way as a five wave impulse. But there are alternate ways to see this downwards wave though, it may also be a double zigzag. If the Magee trend line is breached, then another even more bullish alternate would be published.
WEEKLY CHART
Click chart to enlarge.
There are more than 23 possible corrective structures that B waves may take, and although cycle wave b fits best at this stage as a triangle (main wave count), it may still be another structure. This wave count looks at the possibility that it may be a double zigzag.
If cycle wave b is a double zigzag, then current upwards movement may be part of the second zigzag in the double, labelled primary wave Y.
The target remains the same.
Along the way up, some resistance should be expected at the cyan Magee trend line. Because this wave count requires price to break above the Magee trend line, it must be judged to have a lower probability for this reason. This trend line is tested multiple times and goes back to 2011. It is reasonable to expect price to find resistance there, until proven otherwise.
Within intermediate wave (C), no second wave correction may move beyond the start of its first wave below 1,205.41.
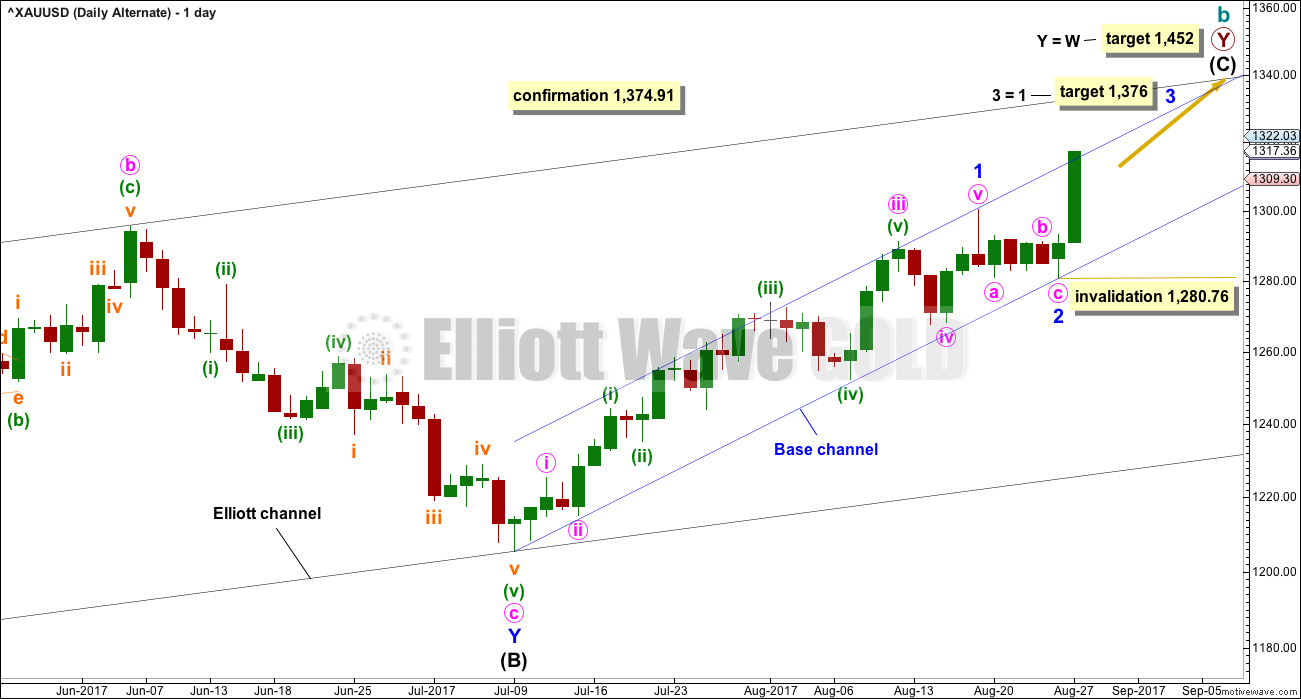
DAILY CHART
Click chart to enlarge.
Intermediate wave (C) may be unfolding as an impulse.
Within the impulse, minor waves 1 and 2 would now be complete.
Minor wave 2 may have ended at Friday’s low. This resolves the problem in last analysis of too much overlapping and a lack of momentum for the start of minor wave 3.
However, it is unusual for second wave corrections to be this shallow.
With minor wave 1 a very long extension, the Fibonacci ratio of equality is used for a target for minor wave 3 now.
Within minor wave 3, no second wave correction may move beyond its start below 1,280.76.
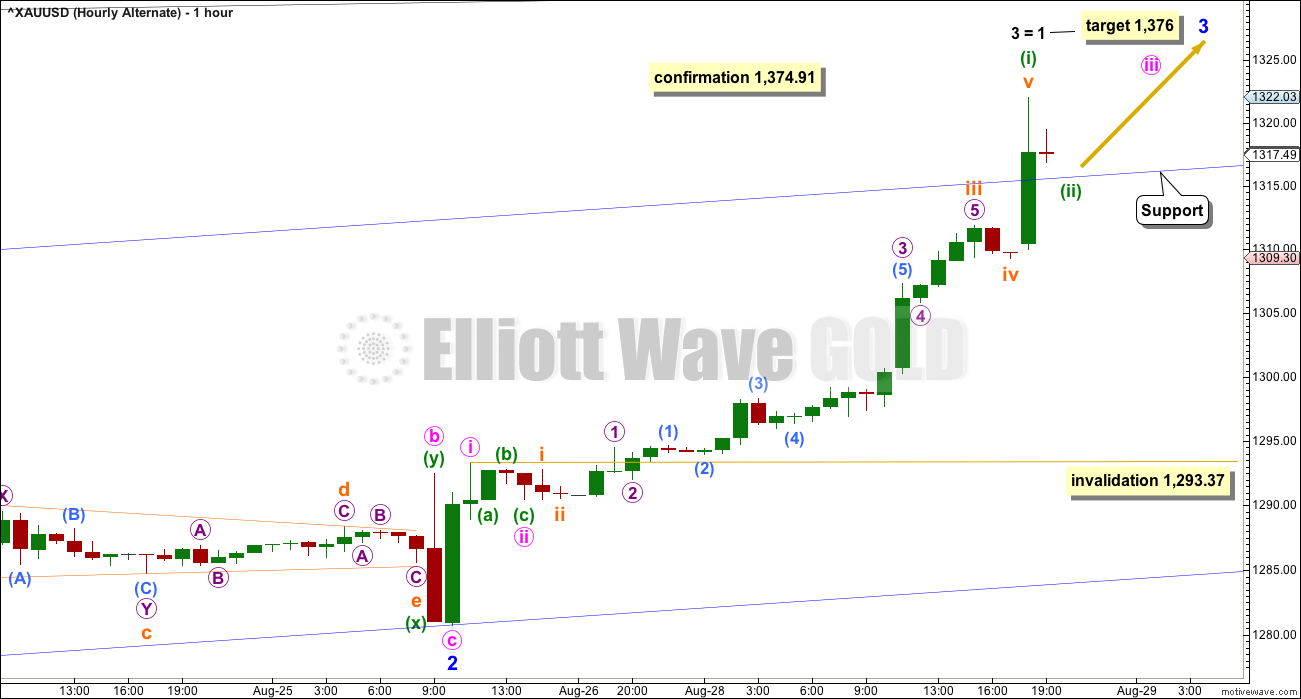
HOURLY CHART
Click chart to enlarge.
Minor wave 3 has now moved above the end of minor wave 1, but not yet far enough above it to allow room for minor wave 4 to unfold and remain above minor wave 1 price territory.
Minor wave 3 may only subdivide as an impulse. Within minor wave 3, minute waves i and ii may be complete.
Minute wave iii may only subdivide as an impulse. Within minute wave iii, minuette wave (i) may be complete. Minuette wave (ii) may be shallow and may find support now about the upper edge of the base channel.
Minute wave iv, when it arrives, may not move into minute wave i price territory below 1,293.37.
This wave count expects to see a further increase in upwards momentum, and upwards movement for a third wave should have support from increasing volume.
TECHNICAL ANALYSIS
WEEKLY CHART
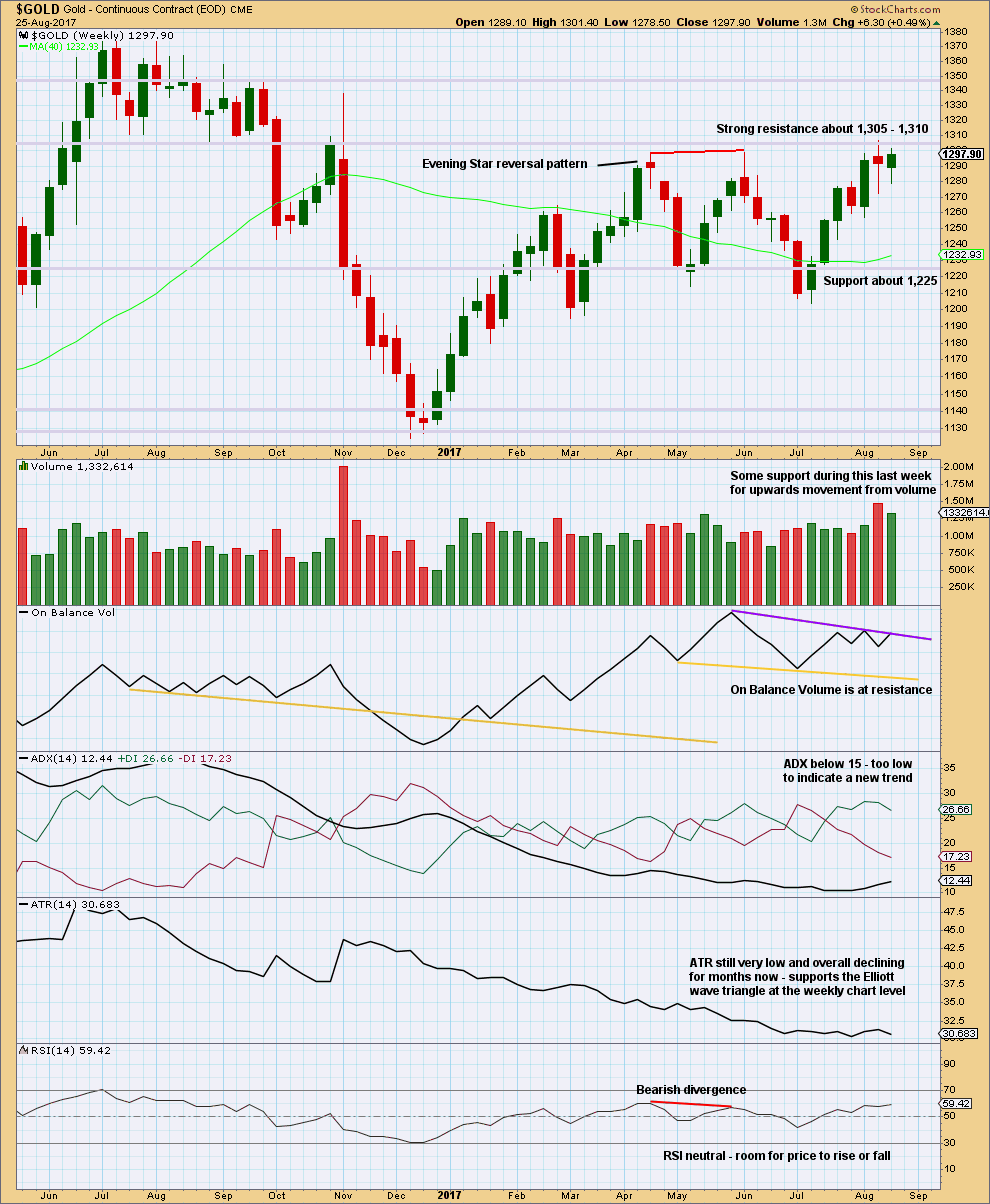
Click chart to enlarge. Chart courtesy of StockCharts.com.
Resistance about 1,305 – 1,310 continues to hold. Each time resistance is tested, and holds, it is strengthened.
Volume is slightly bullish. The long lower wicks on the last two weekly candlesticks is bullish.
The resistance line for On Balance Volume has only been tested twice and is not long held, so it does not offer good technical significance. It offers some weak resistance. If it is breached, that would be a weak bullish signal.
DAILY CHART
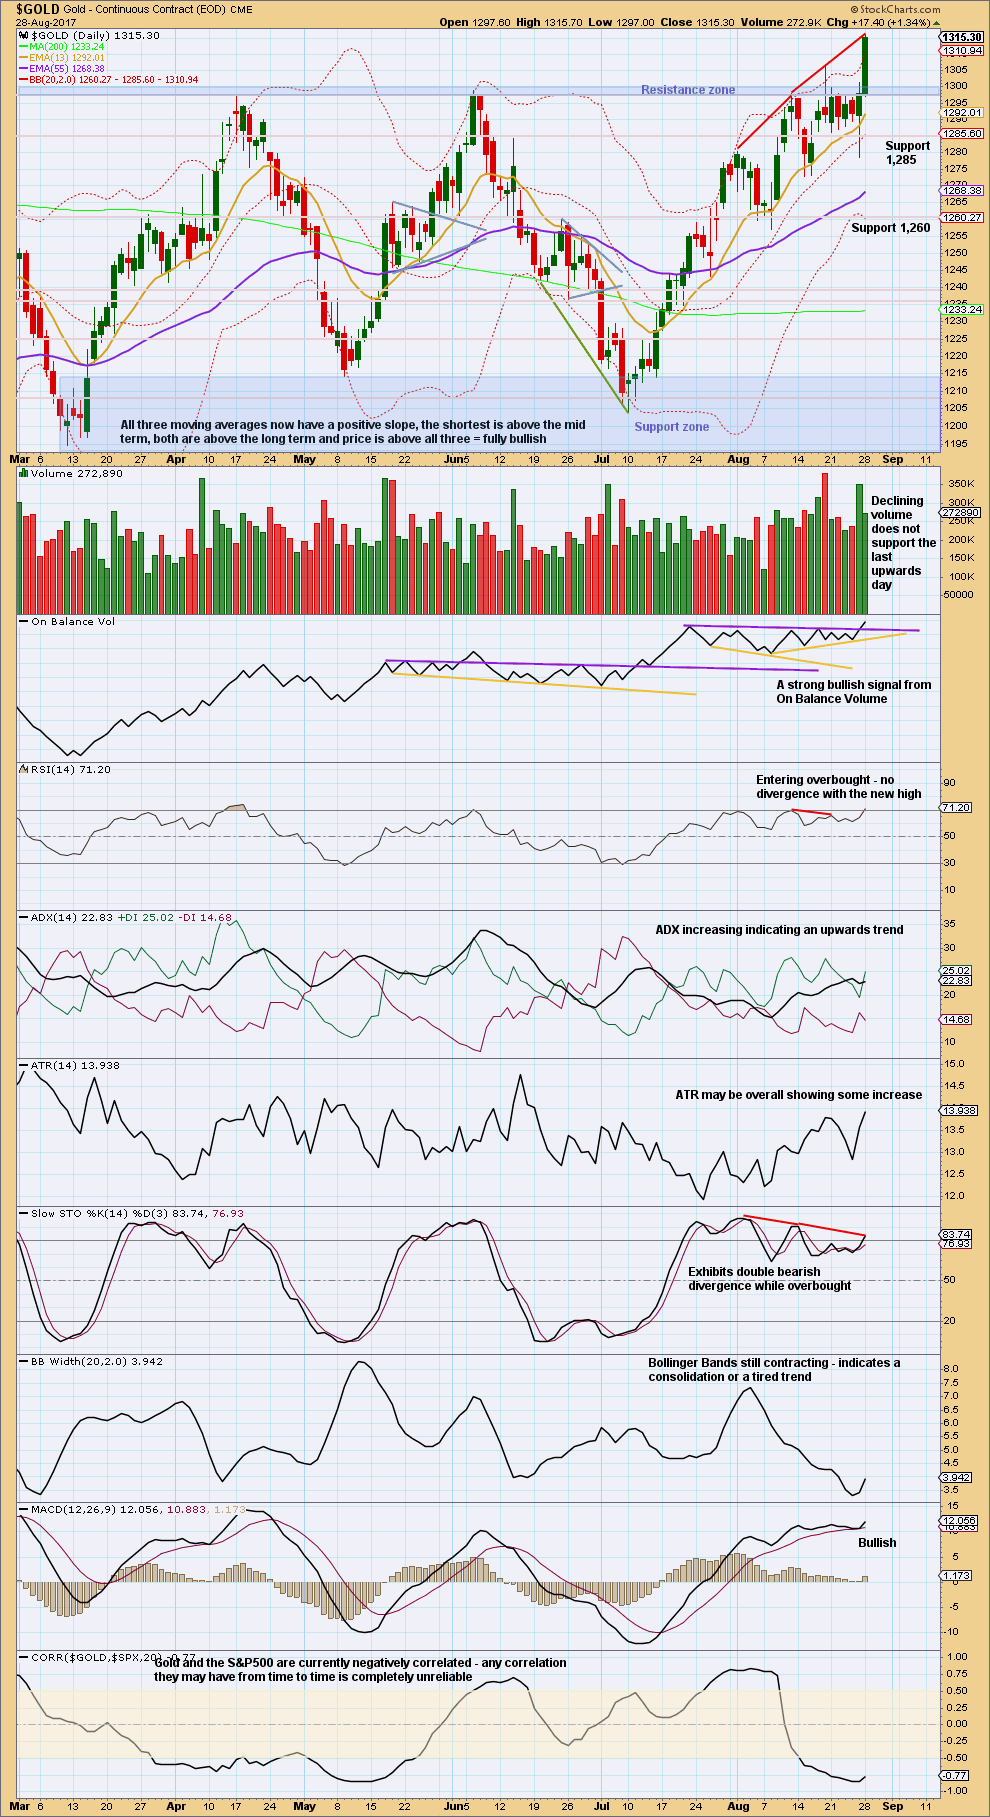
Click chart to enlarge. Chart courtesy of StockCharts.com.
A strong upwards day has closed above prior resistance about 1,305 to 1,310. Price is now finding some resistance higher up at the next zone about 1,320.
Upwards movement does not have support from volume today. This is concerning for the alternate Elliott wave count because a third wave should be unmistakably strong and show increasing volume.
The strong bullish signal today from On Balance Volume gives good support to the alternate Elliott wave count.
RSI and Stochastics may remain extreme for a while longer before upwards movement ends. But they do offer some support today to the main Elliott wave count.
Overall, this chart offers support to the main wave count with the exception of the strong signal from On Balance Volume, which should be taken seriously. This technique does not always work (there is an example of failure in the middle of the chart), but it does work more often than it fails.
GDX
DAILY CHART
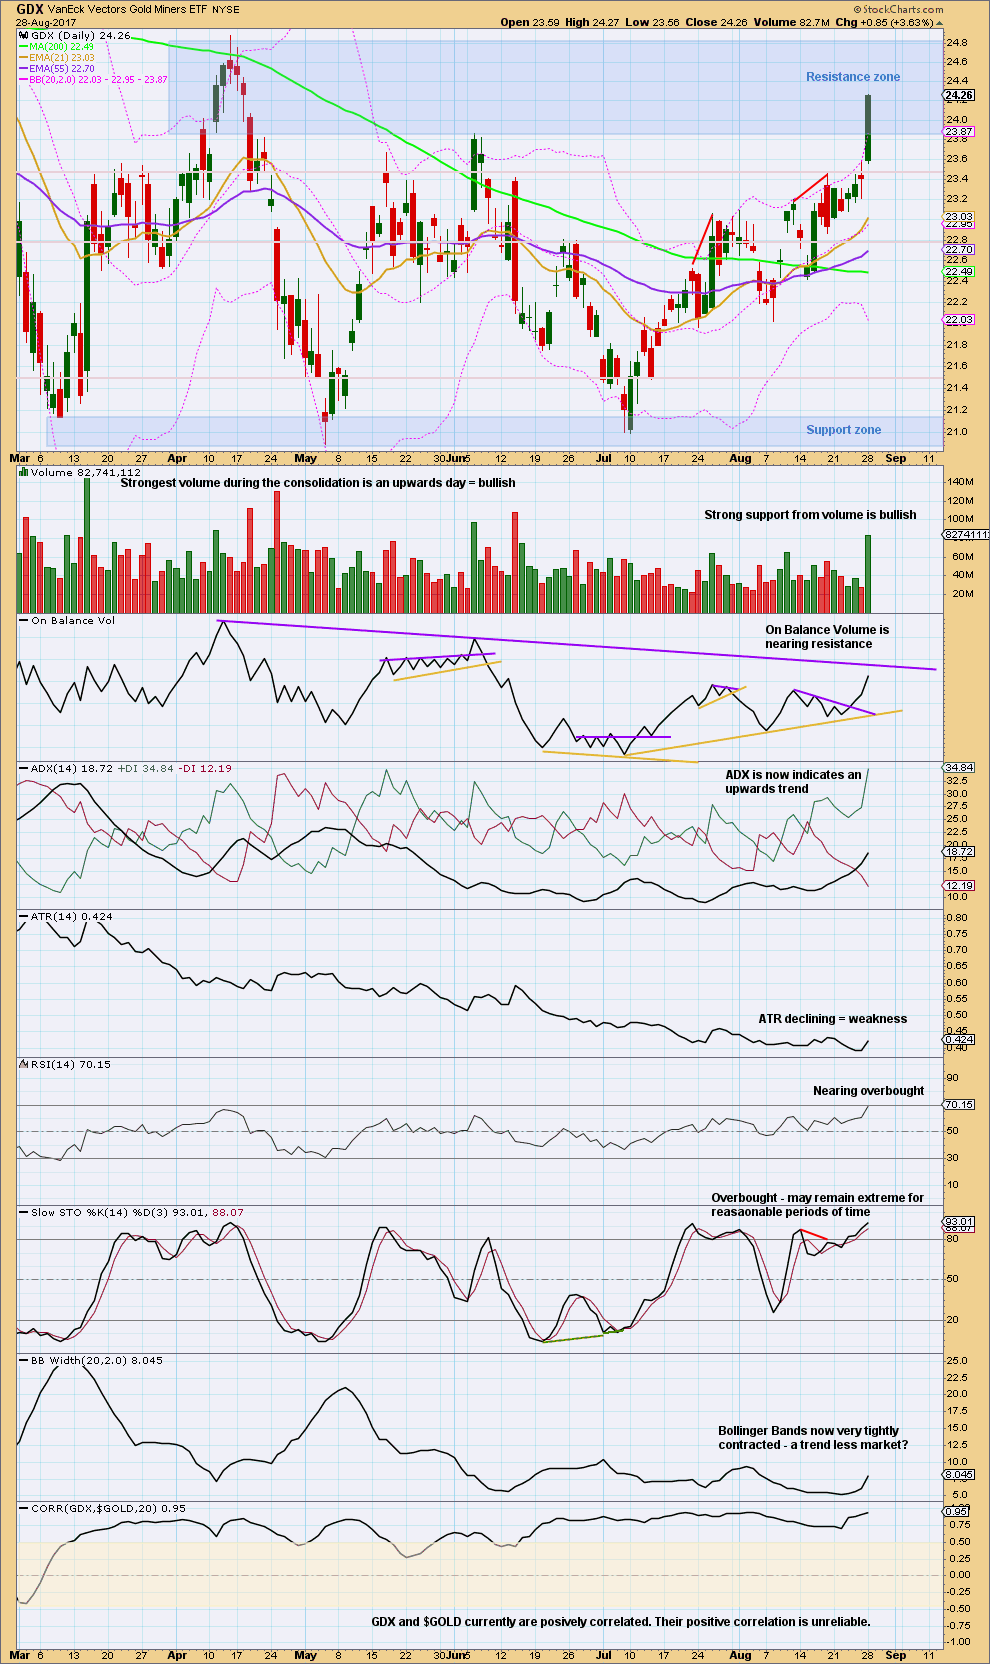
Click chart to enlarge. Chart courtesy of StockCharts.com.
Despite a strong upwards day, GDX is still within a resistance zone.
Volume supports this upwards day. Resistance above for price and On Balance Volume may halt the rise in price in another day or two.
ATR showed some increase and Bollinger Bands slightly widened today. One day of increase is not enough yet to expect a new trend is returning, but it does look bullish today for GDX.
Published @ 08:58 p.m. EST.
Lara, can you take a look at the very bottom post regarding non log charts? Thoughts appreciated 😀
Thanks for the question Dreamer. It gave me a great idea for a short education post.
I was having real trouble last week coming up with new ideas.
hourly chart updated:
On the daily chart the upper shadow of todays candlestick absolutely perfectly hits the Magee trend line. And reacts from there.
Boo ya! Profit taking day while we’re over all sorts of BB’s. Let the dust settle. Wonder what happens next?
The long upper wick and reaction from the trend line indicates another downwards day, at least one.
The question then will be, is that a small pullback within an ongoing upwards trend (bull count) or a change (main count)
Thanks Lara. I still think the key may be in the stock market. The recovery in the market today was unfriendly for gold, and gold was in nosebleed territory and vulnerable for a correction. Not sure if it was THE top though, that will remain to be seen in the coming days/weeks. Pretty exciting though
Very detailed post on the overall commodities complex, including Gold. The author strongly feels that a parabolic top is in the making over the next decade into the mid 2020’s. It’s a long post but worth a look if you have the time.
https://goldtadise.com/?p=410909#comments
Lara, I know you are waiting for a breakout to take a more bullish view, but would be interested in your thoughts on this authors viewpoints and technical analysis.
Other’s comments welcome too.
I do not find that article clear to follow.
For example: “And do note the MACD on the chart below and contemplate that it is BT the support line of my 220 year symmetrical expanding wedge”
What is “BT the support line”?
I don’t like the parabola, it looks forced. Parabolas aren’t a classic pattern I’ve come across before. I’m not saying that price can’t make parabolic moves because it obviously can, just that a parabola as drawn there isn’t a pattern I have encountered.
But I do like Kondratieff cycles, they’re certainly valid.
In terms of Elliott wave, I don’t have an alternate that may fit that. Unless this one really takes its time to complete Super Cycle (b). That could top in about 2020. But it has to have a very deep cycle b within it that must retrace minimum 0.9 of cycle a.
I agree that the parabolic lines are easily manipulated. The cycles are very interesting though.
He also has a very powerful 30 year commodity cycle to contend with. I think Lara’s count and analysis is spot-on, and added to short positions on the Magee trend line rejection. It was absolutely text book. Besides, bulls abound! 🙂
Gold Ichimoku Daily Analysis
Data as at market close, August 28
===========================
Gold prices soared yesterday to a 10-month high, breaking through the 1305-1310 resistance with ease. Investors had felt that Yellen was a disappointment, and they voted. After market close, Kim had contributed tremendous effort in helping gold prices breach the long-term resistance trendline. As it stands, the daily candlestick has poked above that trendline. If the next one or two days see prices comfortably above that trendline, then the winds of change have come. Already, bulls are seen cavorting.
On the daily chart, the tenkan-sen is comfortably above the kijun-sen, and both are way above the kumo. Prices remain above the tenkan-sen and the kijun-sen. The trend is clearly bullish. Having reached my first target of 1320, gold could reverse a little to backtest the long-term trendline, or 1300 and even 1280 but overall, I remain long term bullish. Support is seen at 1300.67 tenkan-sen, followed by 1284.97 kijun-sen. At the very worst, prices could drop as low as kumo support at 1250.54. Whether prices would rise higher today or scale back for profit-taking would depend largely on crowd sentiment. The push factors are clear for all to see. The ominous triple top reversal at 1300 had been cancelled, paving the way for higher prices. Uncertainty over the renegotiation of NAFTA had left investors sceptical about stocks, hence supporting gold. The speeches by Yellen and Draghi were far from satisfactory, which together with the concerns over billions of dollars’ damage caused by Harvey, had plunged the US dollar to its lowest levels in 16 months. Moreover, Trump has not given any response yet, but if he does feel angry I would expect prices to quickly test 1336 followed by 1352, the two previous highs recorded in November and September last year.
Great post Alan. Looks like your bullish view is paying off 🤑
$USD is really crashing. You would think that is helping gold go up, but when you look at the sometimes inverse correlation, it’s so inconsistent that you can’t rely on it at all.
Rambus on GLD Breakout
https://rambus1.com/2017/08/28/gld-update-257/
I published this chart a couple of months ago. I gotta say, it looks pretty good now for the bullish case since the descending broadening wedge broke to the upside.
https://www.tradingview.com/x/WWJ712sU/
GDX technical thoughts
GDX Bull chart – this count will have a good probability if gold properly breaks the Magee Bear trendline and Lara’s gold alternate becomes the main count. We should know soon.
https://www.tradingview.com/x/d8HQlo2w/
GDX Bear chart – we should know pretty soon if this count is likely. If gold has topped, then this count is likely for GDX. It fits well with Lara’s gold triangle count.
https://www.tradingview.com/x/59dSOmU8/
Lara, I saw this on Stocktwits (a blog site).
Does this wedge and apparent breakout look correct to you? Thanks, so much.
Mother or no mother; imo as it stands, at cmp 1316, lucky if we can get a break below 1313 for 1310-08; upside 1330 to play for…?
John / Lara,
That chart is drawn on a non-log (arithmetic) scale. Using that scale, it does look like a clear breakout and backtest when you look at the zoomed in chart. The breakout occurred 23 trading days ago. Many analysts around the web, pro and amateur, have been calling it a breakout.
Lara only uses log scale for her daily charts and above. That’s why her charts do not show a breakout (yet).
I have not found a definitive source that says you must use log scale for daily and above charts for trendline accuracy. That said, the basic logic of log vs arithmetic makes sense that you would do so.
Lara, in your opinion is there any value in plotting longer term charts with arithmetic scale in addition to log scale? When you draw the Bear trendline using arithmetic scale, there are many touch points, including a backtest of the breakout, so it does seem to be “hot”. It seems to be a trendline of some value (early breakout notice?)
Your thoughts?
From one of my favourite texts, Kirkpatrick and Dhalquist, “Technical Analysis” page 214:
“Although the arithmetic scale is the scale most often used, sometimes adjustments need to be made, especially when observing long-term price movements”.
There follows a long discussion with charts to illustrate why a semi-log scale is better for longer term price movement.
This trend line we are looking back goes back to 2011, and so 6 years of price movement definitely is longer term. Because it includes the end of a parabolic rise to the all time high it is my firm conclusion that the following fall for price and its trend line should be viewed on a semi-log scale.
As far as I am aware that is the correct convention for charting.
Great. Thank you for the reference!