
An upwards day was expected, but this is not what happened.
Two hourly Elliott wave counts are used today.
Summary: While price remains above 1,255.16 and within the blue channel, it is entirely possible that a high is not yet in place. There is some support today from classic analysis for a new high within the next 24 hours.
If price breaks fully below the channel (not just an overshoot) and then below 1,255.16, expect that Gold has likely had a trend change.
Always use a stop. Invest only 1-5% of equity on any one trade.
New updates to this analysis are in bold.
Last monthly charts and alternate weekly charts are here, video is here.
Grand SuperCycle analysis is here.
MAIN ELLIOTT WAVE COUNT
WEEKLY CHART
Click chart to enlarge.
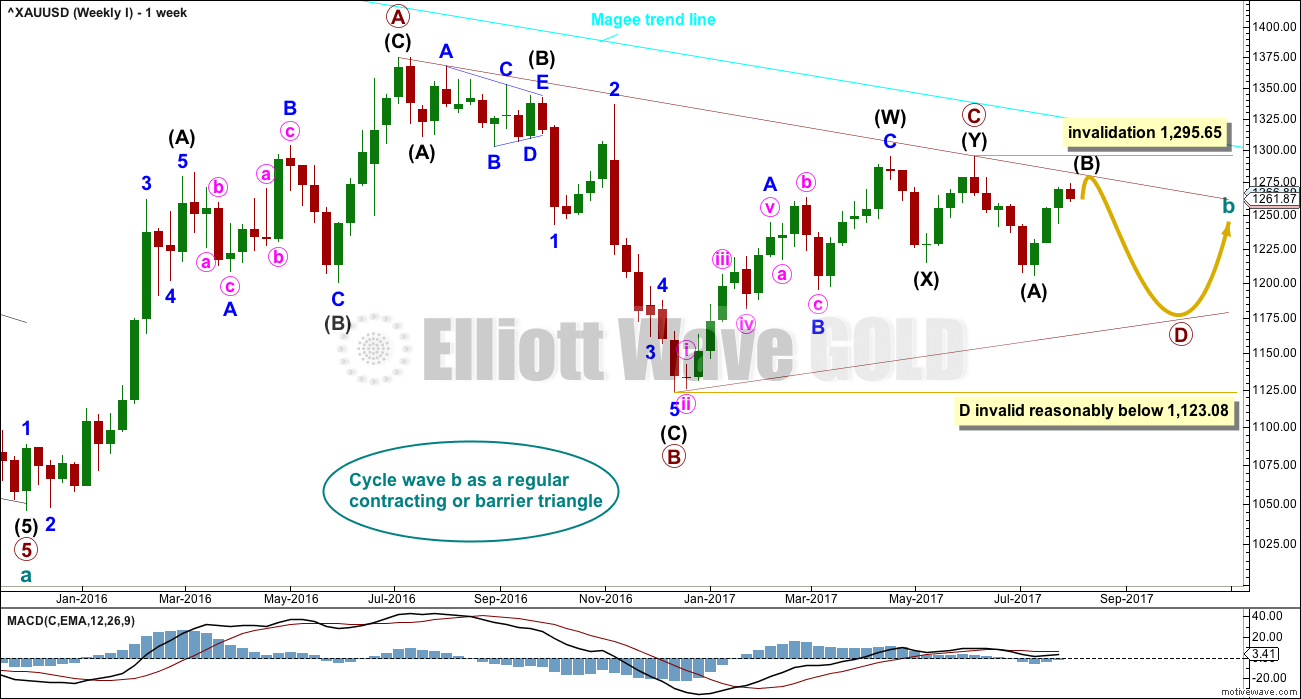
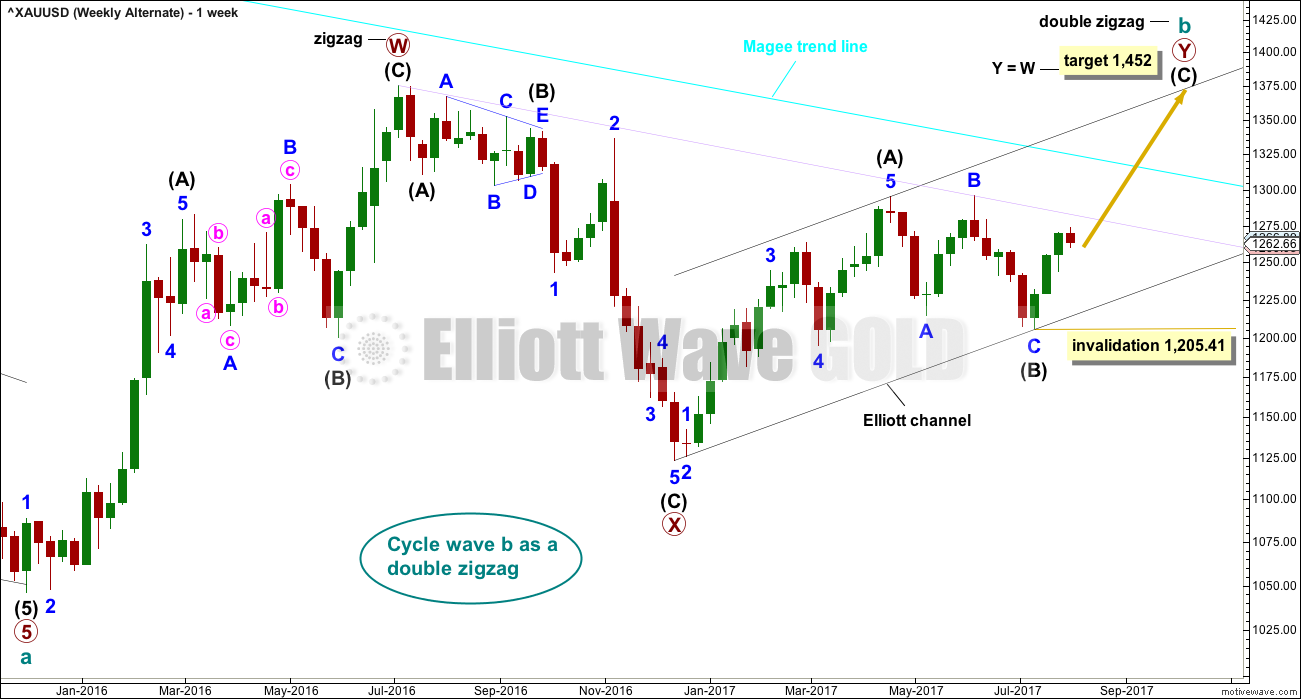
The Magee bear market trend line is added to the weekly charts. This cyan line is drawn from the all time high for Gold on the 6th of September, 2011, to the first major swing high within the following bear market on the 5th of October, 2012. This line should provide strong resistance.
At this stage, a triangle still looks possible and has the best fit for cycle wave b. It has some support from declining ATR and MACD now beginning to hover about zero.
Within a triangle, one sub-wave should be a more complicated multiple, which may be primary wave C. This is the most common sub-wave of the triangle to subdivide into a multiple.
Primary wave D of a contracting triangle may not move beyond the end of primary wave B below 1,123.08. Contracting triangles are the most common variety.
Primary wave D of a barrier triangle should end about the same level as primary wave B at 1,123.08, so that the B-D trend line remains essentially flat. This involves some subjectivity; price may move slightly below 1,123.08 and the triangle wave count may remain valid. This is the only Elliott wave rule which is not black and white.
Triangles normally adhere very well to their trend lines. So far the A-C trend line has been tested 11 times; this line has very strong technical significance. If this wave count is correct, then intermediate wave (B) should find very strong resistance if it gets up to the A-C trend line. A small overshoot is acceptable. A breach is not. If price reaches up to that trend line in the next one to few days, it would offer a good entry point for a short position. Stops then may be set a little above the line, or just above the invalidation point.
Finally, primary wave E of a contracting or barrier triangle may not move beyond the end of primary wave C above 1,295.65. Primary wave E would most likely fall short of the A-C trend line. But if it does not end there, then it can slightly overshoot that trend line.
Primary wave A lasted 31 weeks, primary wave B lasted 23 weeks, and primary wave C may have been complete in 25 weeks.
Primary wave D should now be expected to last a Fibonacci 13 or 21 weeks in total.
DAILY CHART
Click chart to enlarge.
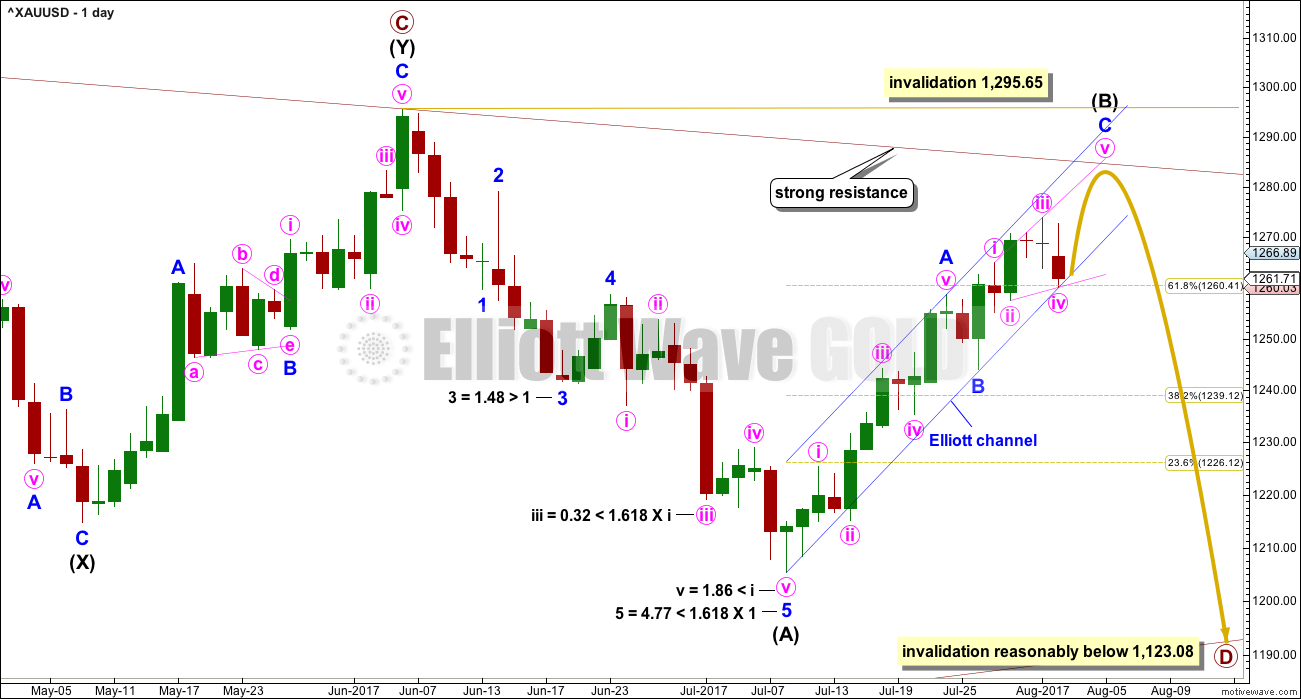
A common range for triangle sub-waves is from about 0.8 to 0.85 the prior sub-wave, this gives a range for primary wave D from 1,158 to 1,149.
At this stage, to try and see the whole of primary wave D complete at the last low does not look right. The B-D trend line would be too steep for a normal looking contracting Elliott wave triangle, and primary wave D would have been far too brief at only 5 weeks duration. For the wave count to have the right look and good proportions (as Gold almost always does), primary wave D should not be labelled over yet.
If primary wave C is correctly labelled as a double zigzag, then primary wave D must be a simple A-B-C structure and would most likely be a zigzag.
With intermediate wave (A) complete and now intermediate wave (B) a large and deep correction, primary wave D is beginning to look very typically like a large exaggerated zigzag.
Intermediate wave (B) looks to be unfolding as a zigzag, a three wave structure. Corrective waves have a count of 3, 7, 11, 15 etc. Each extension adds another 4. So far intermediate wave (B) has a count of 10 on the daily chart, so it now again looks incomplete. However, if the doji of the 31st of July is also counted, it is possible that intermediate wave (B) could have a complete count of 11.
Draw an Elliott channel about the zigzag of intermediate wave (B). Use this as a guide to when it may be over. When price breaks below the lower edge, that may be taken as an indication of a trend change.
So far intermediate wave (B) has lasted 17 days. It may not exhibit a Fibonacci duration now if it ends below the maroon A-C trend line.
Within the zigzag of primary wave D, intermediate wave (B) may not move beyond the start of intermediate wave (A) above 1,295.65.
HOURLY CHART
Click chart to enlarge.
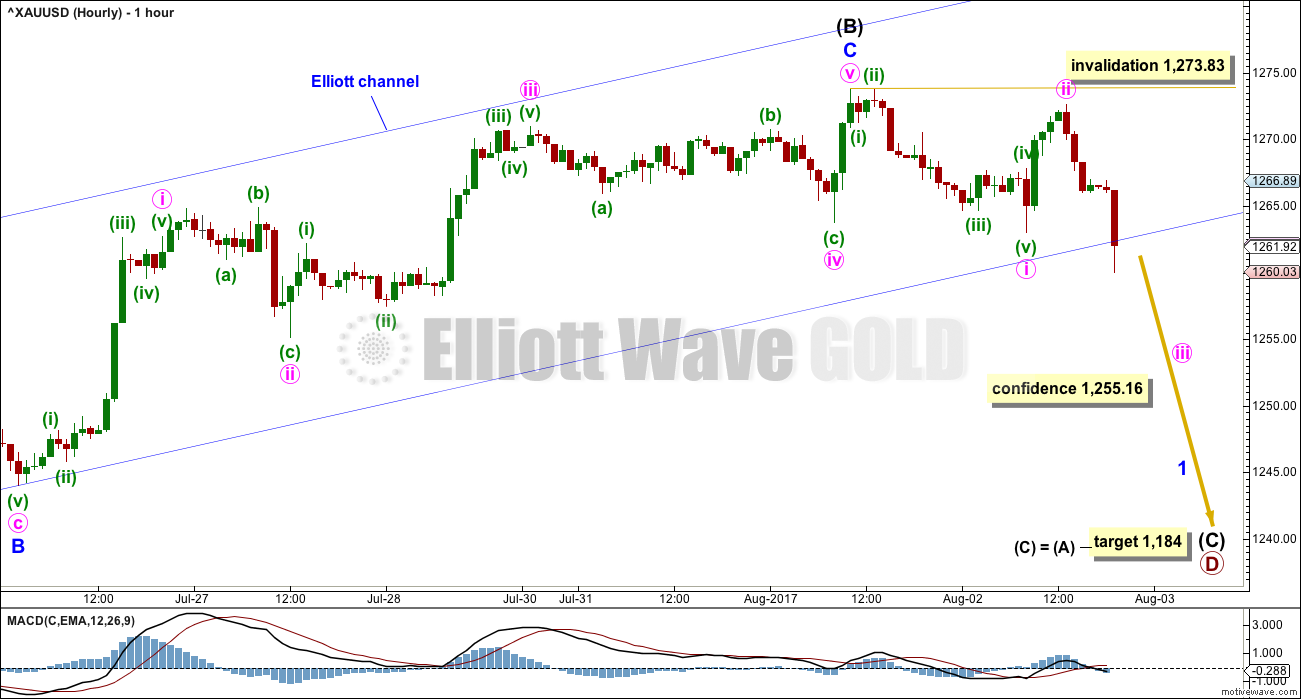
There are two possible structures for minor wave C: an impulse or an ending diagonal. This first hourly wave count looks at the possibility of an impulse, which could be complete.
If the high of minute wave i is moved lower, then there is no overlap between minute waves i and iv.
Minute wave ii is an expanded flat correction. Within Minute wave ii, minuette wave (b) is longer than the maximum convention of 2 times the length of minuette wave (a), so this must reduce the probability of this wave count.
Some confidence may be had in this wave count if the lower edge of the Elliott channel is properly breached. My definition of a breach is at least one full hourly candlestick below and not touching the lower trend line, preferably by clear downwards movement and not just sideways movement.
After that further confidence may be had in a trend change if price makes a new low below 1,255.16.
SECOND HOURLY CHART
Click chart to enlarge.
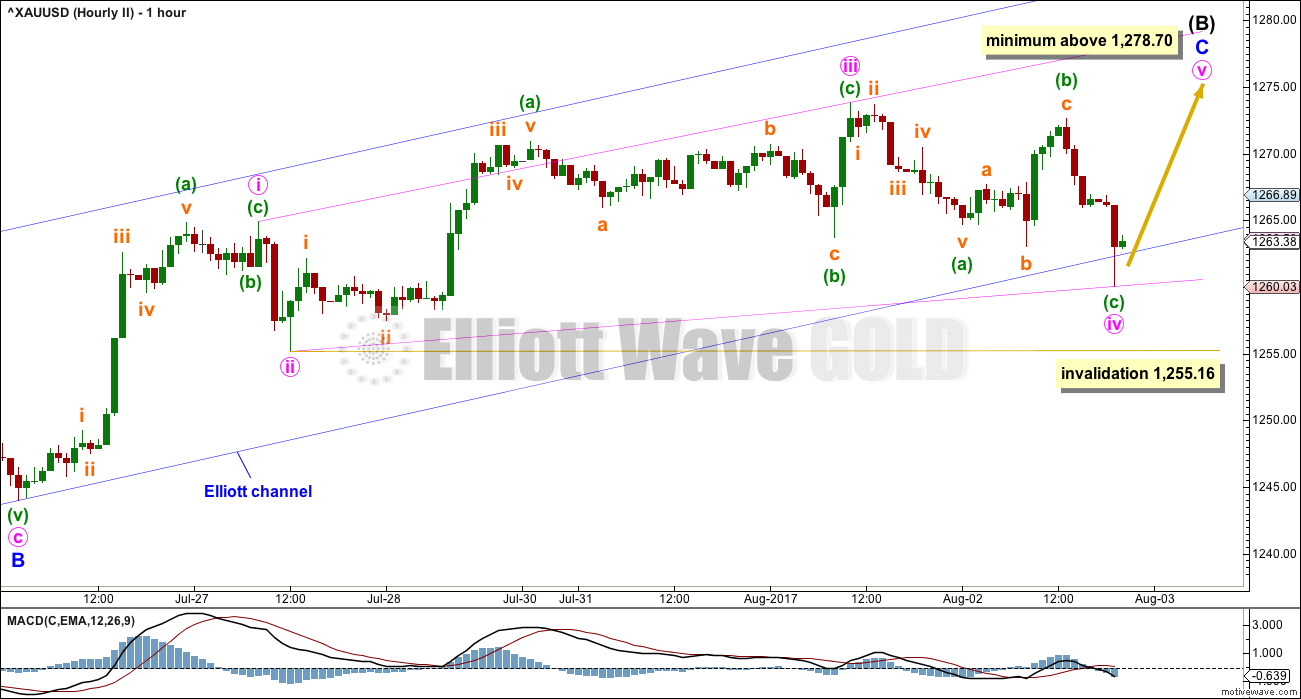
The other possible structure for minor wave C is an ending diagonal. In this instance, the diagonal would be expanding.
Because the diagonal would be expanding minute wave v must be longer than minute wave iii, so upwards movement must reach at least slightly above the minimum requirement.
This second wave count would allow for intermediate wave (B) to move higher over another two to three days and possibly come up to touch the maroon trend line on the weekly and daily charts.
While price remains above 1,255.16, this wave count will remain viable. Minute wave iv of the diagonal may not move beyond the end of minute wave ii.
ALTERNATE ELLIOTT WAVE COUNT
WEEKLY CHART
Click chart to enlarge.
This wave count has been published only in historical analysis. At this stage, it will be published on a daily basis.
There are more than 23 possible corrective structures that B waves may take, and although cycle wave b fits best at this stage as a triangle (main wave count), it may still be another structure. This wave count looks at the possibility that it may be a double zigzag.
If cycle wave b is a double zigzag, then current upwards movement may be part of the second zigzag in the double, labelled primary wave Y.
The biggest problem with this wave count is the structure of intermediate wave (A) within primary wave Y. This upwards wave looks very much like a three and not a five. This upwards wave must be seen as a five for this wave count to work.
Within the second zigzag of primary wave Y, intermediate wave (B) is a completed regular flat correction. Minor wave C ends just slightly below the end of minor wave A avoiding a truncation. There is no Fibonacci ratio between minor waves A and C.
The target remains the same as previously published for this wave count.
Along the way up, some resistance should be expected at the cyan Magee trend line.
Within intermediate wave (C), no second wave correction may move beyond the start of its first wave below 1,205.41.
DAILY CHART
Click chart to enlarge.
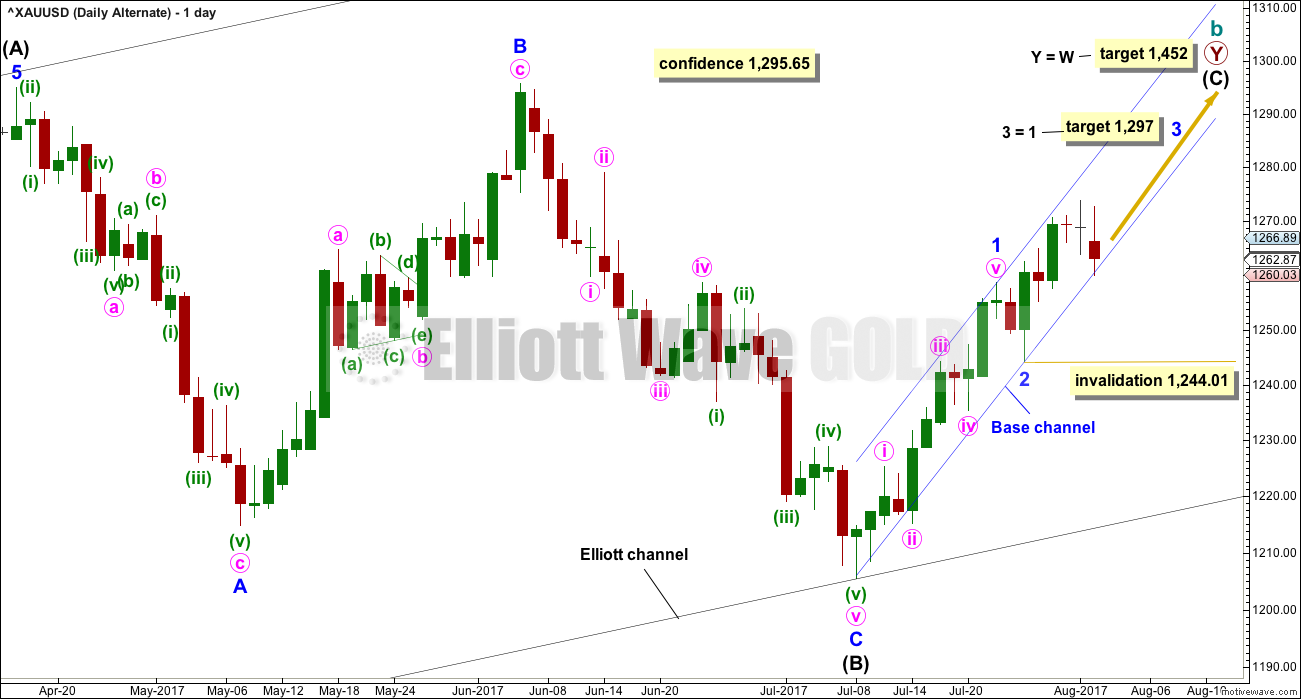
Intermediate wave (C) may be unfolding as an impulse.
Minor wave 2 may be over as a very quick and shallow zigzag.
Because minor wave 1 was a long extension, the target for minor wave 3 is for equality with minor wave 1.
Within minor wave 3, no second wave correction may move beyond the start of its first wave below 1,244.01.
HOURLY CHART
Click chart to enlarge.
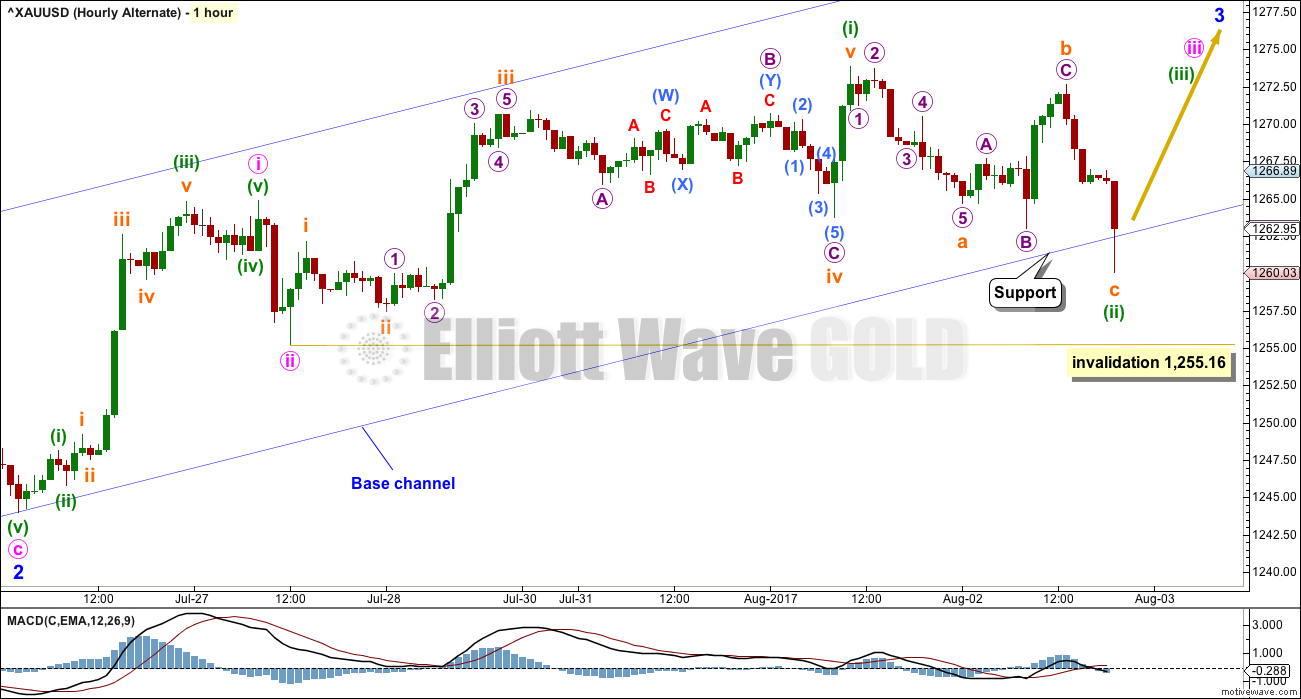
If minor wave 3 for this alternate is to be an extension reaching equality with minor wave 1, then its subdivisions may show up on the daily chart like those for minor wave 1 do.
This wave count would now expect a strong increase in upwards momentum as the middle of a third wave passes. It is now quite concerning that momentum has not increased and is showing a strong decline. This does not support this wave count today. It is also concerning that the last week overall shows a decline in volume. A third wave should be strong, unmistakable, and have support from volume. However, this wave count remains viable; sometimes a third wave can start out a little slow.
Minuette wave (ii) may not move beyond the start of minuette wave (i) below 1,255.16.
TECHNICAL ANALYSIS
WEEKLY CHART
Click chart to enlarge. Chart courtesy of StockCharts.com.
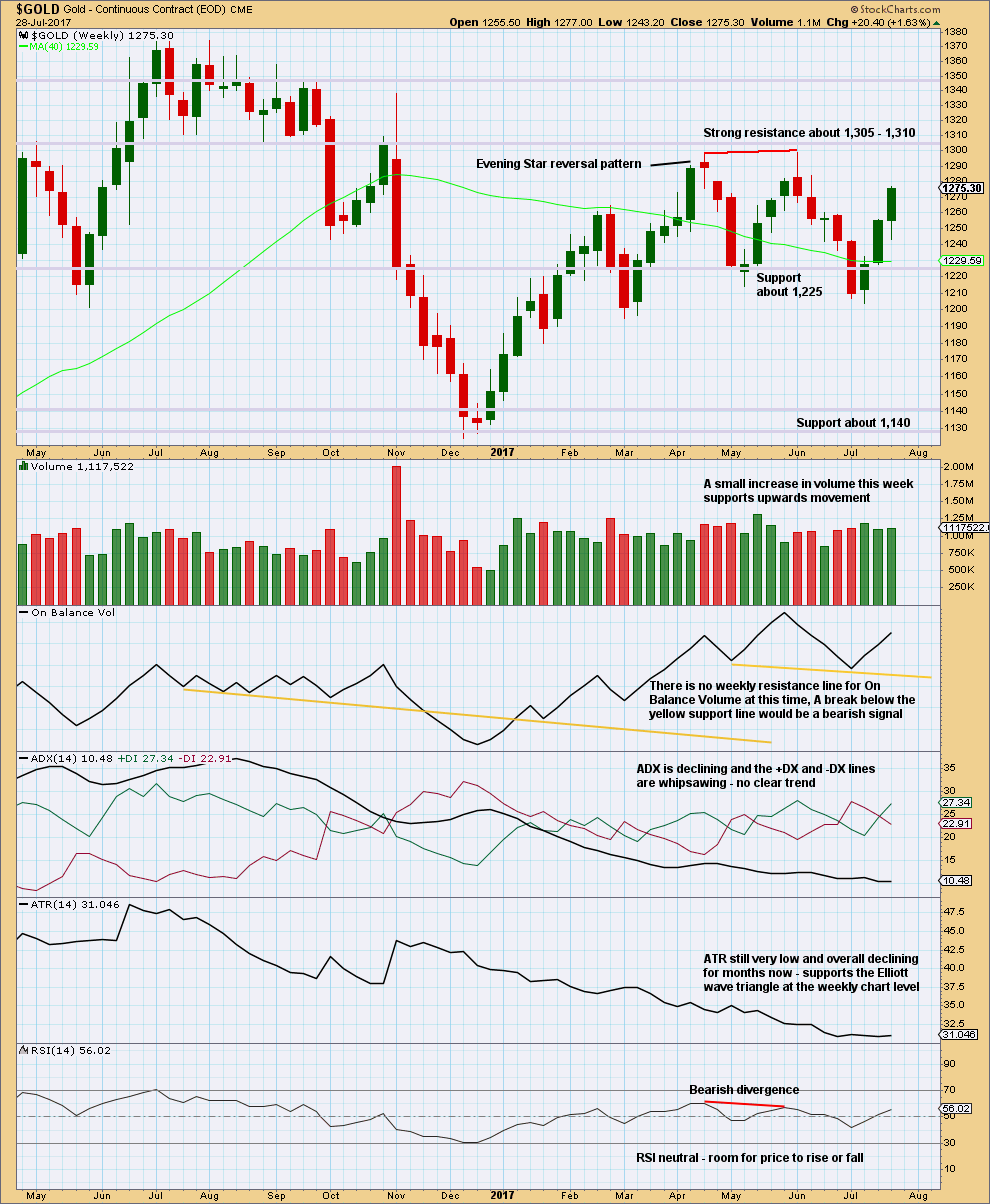
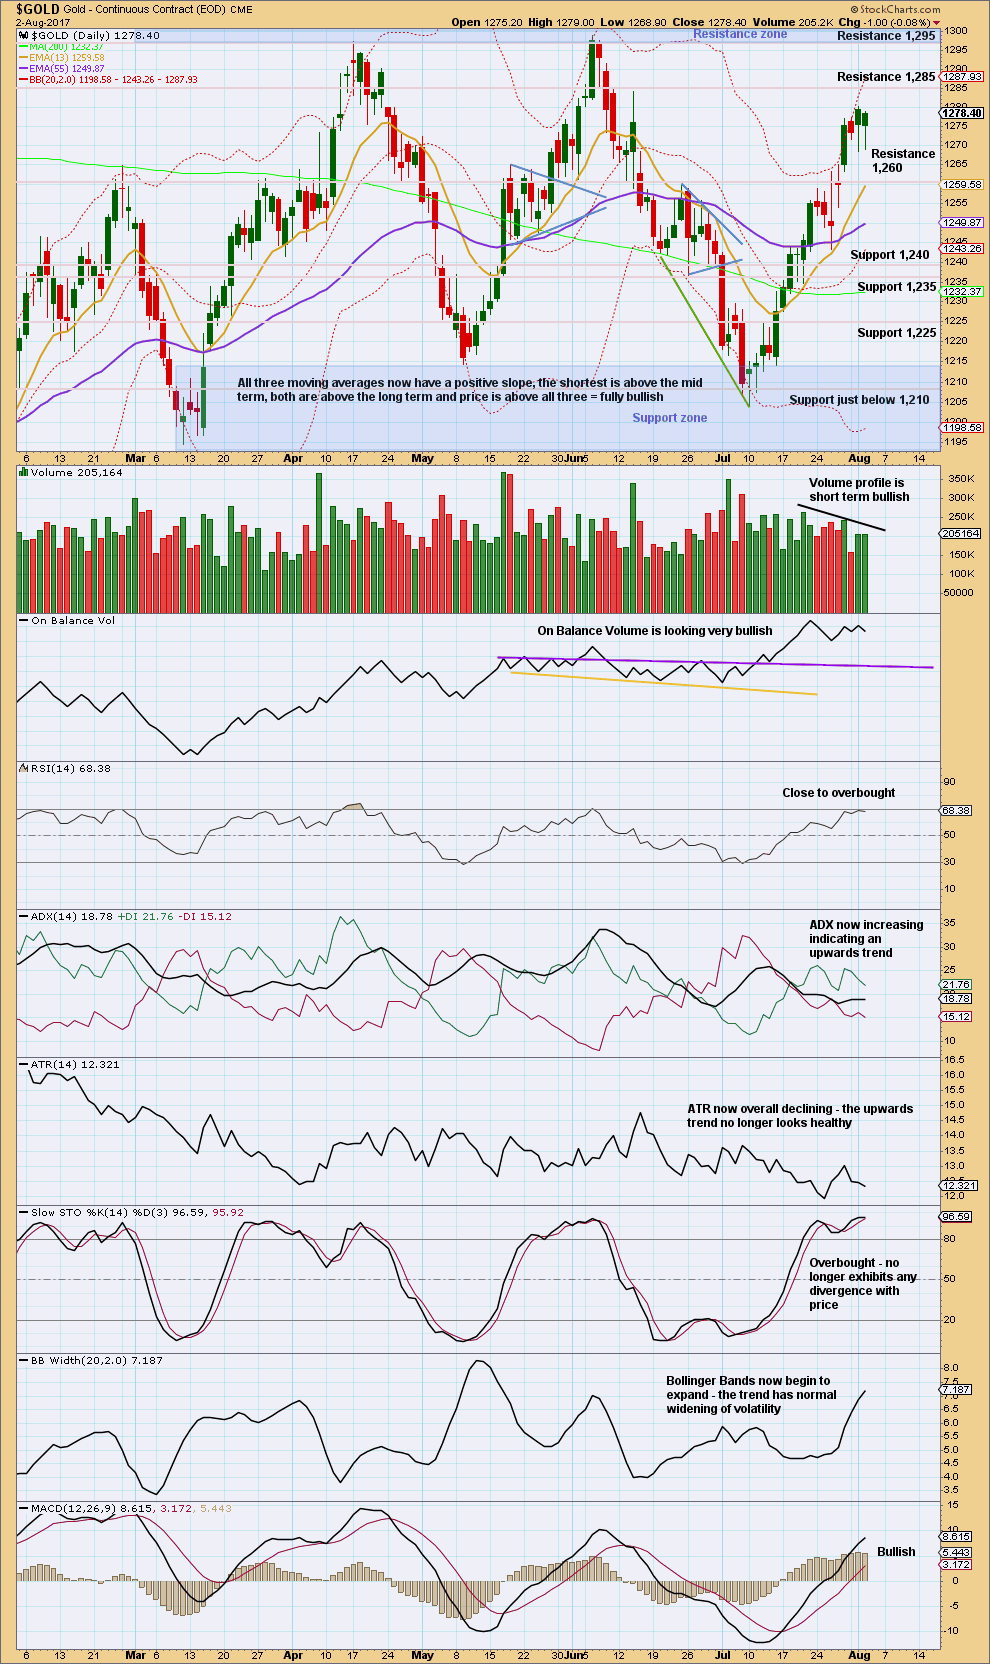
A long lower wick and some support from volume suggest more upwards movement this week.
Price is range bound with resistance about 1,305 to 1,310 and support about 1,225 to 1,205. During this range bound period, it is an upwards week that has strongest volume suggesting an upwards breakout may be more likely than downwards. This is contrary to the main Elliott wave count.
ATR continues to decline, which does support the main Elliott wave count.
DAILY CHART
Click chart to enlarge. Chart courtesy of StockCharts.com.
Stepping back and looking at the larger consolidation, Gold moved into a range back in February this year, delineated by support and resistance zones. During this consolidation, it is two upwards days of 7th of April and the 17th of May that have strongest volume. This suggests an upwards breakout is more likely than downwards, and it supports the alternate Elliott wave count and not the main Elliott wave count.
A day with the balance of volume downwards comes with very slightly lighter volume, so for the very short term the volume profile is still slightly bullish. However, volume has been declining overall as price moves higher indicating it may not last much longer.
Long lower wicks on the last two daily candlesticks favour the second hourly wave count over the first. Any members trying to pick a high here and enter short are strongly advised to either exercise patience and wait, or reduce risk to no more than 1-3% of equity.
GDX
DAILY CHART
Click chart to enlarge. Chart courtesy of StockCharts.com.
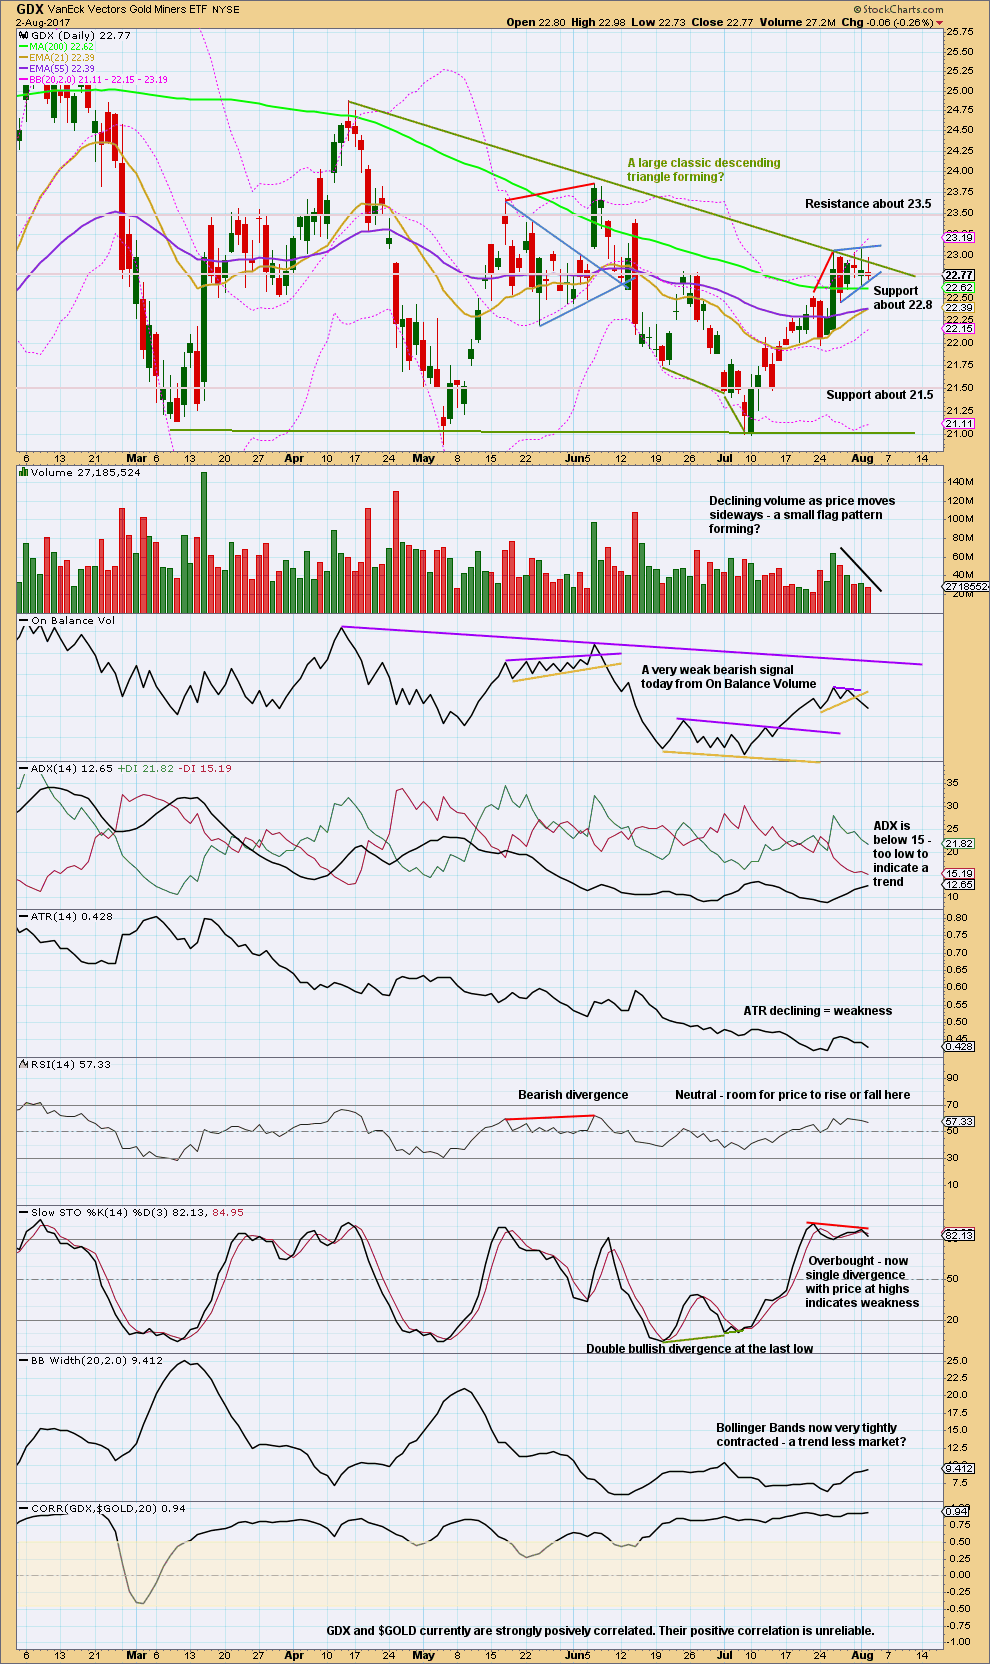
Stepping back for GDX too, to look at the past six months, a large descending triangle looks like it has formed and may be close to a breakout. Breakouts from descending triangles are usually downwards.
During this structure though it is an upwards day for the 15th of March that has strongest volume suggesting an upwards breakout may be more likely than downwards.
There is overall some decline in volume lately. This supports the view that a triangle is nearing completion. ATR also supports this view.
Trend lines are added today to the small consolidation. This looks like it may be a small flag pattern, but it has a slight upwards slope. Flags are more reliable when they slope against the trend, not with it. This one may not be so reliable.
Published @ 09:03 p.m. EST.
Yesterday I posted another Elliott wave quiz for those who want to learn more Elliott wave, here.
Will leave it for a few more hours before posting the answers.
Actually, I’ll be posting the answers chart and the “fixed it” chart now, because Eli got both the mistakes perfectly. Nicely done!
Thanks Lara. Interesting anecdote for everyone. My biz partner has been talking to me about stocks lately. He just ran his portfolio by me and stocks he’s been purchasing this summer. I will tell you this – he’s not like the proverbial cab driver giving out stock tips, but he’s pretty darn close! I recall he asked me how to short oil when it was around 30 way back when. And he asked about going long gold at a recent interim top not so long ago. Stocks are in a huge bull market and I’ve sworn off trying to short it at the top, so we may have some ways to go before that’s over. But with guys like that buying up stocks, it can’t be that long until there is some kind of washout
so he wanted to short oil at 30 and i just checked, it was June 4 of this year he asked about going long gold. Look at the chart. He’s a very good contrarian indicator! I fear for stocks lol
Me too. I can see a massive correction coming, but not yet. Market breadth still has to show 4-6 months of divergence with price before conditions are right for a high to be in place.
Next year I’m figuring at the earliest.
But right now, a mid term pullback is what I’m expecting before the final run up.
second hourly chart updated:
with price now back in the channel, and the breach an unconvincing sideways movement, this may be the preferred count
I think I’ll be redrawing that channel now that the lower edge has been weakened
NUGT just hit support at lower trendline on hourly chart.
Low volume on GDX and SPY declines today.
Tomorrow will be the tell after 8:30am est with jobs report.
Looks like bull flags on GDX and NUGT – Daily candlesticks. An upwards break for GDX would match up with Dreamer’s GDX count. However, it looks short lived being that GDX is expected to retreat, thereafter.
Agree with you that tomorrow’s report will send gold and GDX in one direction or the other.
GDX giving the earliest of sell signals today, but can be easily reversed. I thought it might have been higher today in order to avoid that, but day is not over lol. Needs a late day surge
I’m longer than i want to be going into tomorrow. let’s see what happens
Sideways consolidation to nowhere. Baffling and probably very frustrating. Imo needs a break below 1260 (spot) to take the initiative away from the bulls else a takeout of 1273-74 should be on the cards…. Oh well, just have to stay alert lol…. 🙂
Looking for the second option. LOL!
Seems like the three times gold has tried to rally it has been rejected all three times on that 2011 downtrend line. That trendline has resisted at least 7 upward movements. Interesting to see if gold breaks through, or fall back to 1180 support. I’m going with 1180
Back into channel.
This kitco day over day price action chart and article do make you think…
http://www.zerohedge.com/news/2017-08-02/its-7pm-new-york-do-you-know-where-your-precious-metals-manipulators-are
Sorry guys. I was down with a bad flu the past two days and hence was not able to post anything. Now, I’m better, with a sore throat, but otherwise fairly normal.
============================
Gold Ichimoku Daily Analysis
Data as at market close, August 2
============================
Gold markets initially dipped lower at the open on Wednesday, but found support at the 1260 level to turn around. I believe that gold prices would continue to rise, and they would try to reach the 1275-1280 level, and then possibly extend to the 1300 level after that. The 1300 level should be rather resistive though as it has been the top of the consolidation band for several months in the market. The overall uptrend still remains intact; price > 50 SMA > 200 SMA. From the Daily Ichimoku Chart, tenkan-sen lies above the kijun-sen, and price trades above these two lines. Gold prices trade above the kumo, which is still green, at least until August 8. This is the classic strongly bullish scenario by Ichimoku definition. It is not until prices break below cloud cover that a bearish scenario can be seriously considered.
In the very short term, gold prices had tried to push higher on Monday and Tuesday but they had been beaten back by strong selling above the 1270 region. The prices had corrected both times, and both times it had taken a lot of time and effort for the gold bulls to push prices higher. Prices formed something like a double top, which means that a downward trend is likely to have begun. Positive momentum is decelerating as the MACD is still in the black but with a downward sloping trajectory which points to consolidation. The 5-day RSI is hovering in the overbought region. There seems to be a lot of negativity in the market, but this could also be a pullback in anticipation of much greater prices ahead.
The market is likely to wait in anticipation of the NFP report tomorrow and until that time, we can expect some more consolidation and ranging in the prices. If the NFP comes in stronger than expected, we can expect the dollar to continue to recover in a strong manner which will then lead to a deeper correction in the gold prices.
I reckon the situation should clear up after the release of the NFP report tomorrow. Right now, there is a fierce tug of war between the bulls and the bears, and I feel it is best to sit on the sidelines. The Chinese have a fable in which a snipe and a clam were fighting. The wading bird put its beak into the shell of the clam to extricate the tender morsel, but the clam slammed its shell shut, trapping the snipe’s beak. While they were grappling with each other, a fisherman passed by and gathered up both … for his dinner.
Glad you’re feeling better Alan 🙂
Thanks Dreamer for your kind concern.
I’ll second that Alan. Being sick is awful. Glad you’re better quickly 🙂