
An upwards day has not made a new high and has closed just below the trend line. Classic analysis supports the alternate wave count.
Summary: Assume the trend remains the same until proven otherwise. Assume the larger bear market remains intact while price remains below the bear market trend line.
If the Magee trend line is breached by one or two full daily candlesticks above it, then the alternate wave count would be preferred. On Balance Volume today warns the alternate may be correct.
Specific trading advice is given at the end of this analysis today.
New updates to this analysis are in bold.
Last monthly charts for the main wave count are here, another monthly alternate is here, and video is here.
Grand SuperCycle analysis is here.
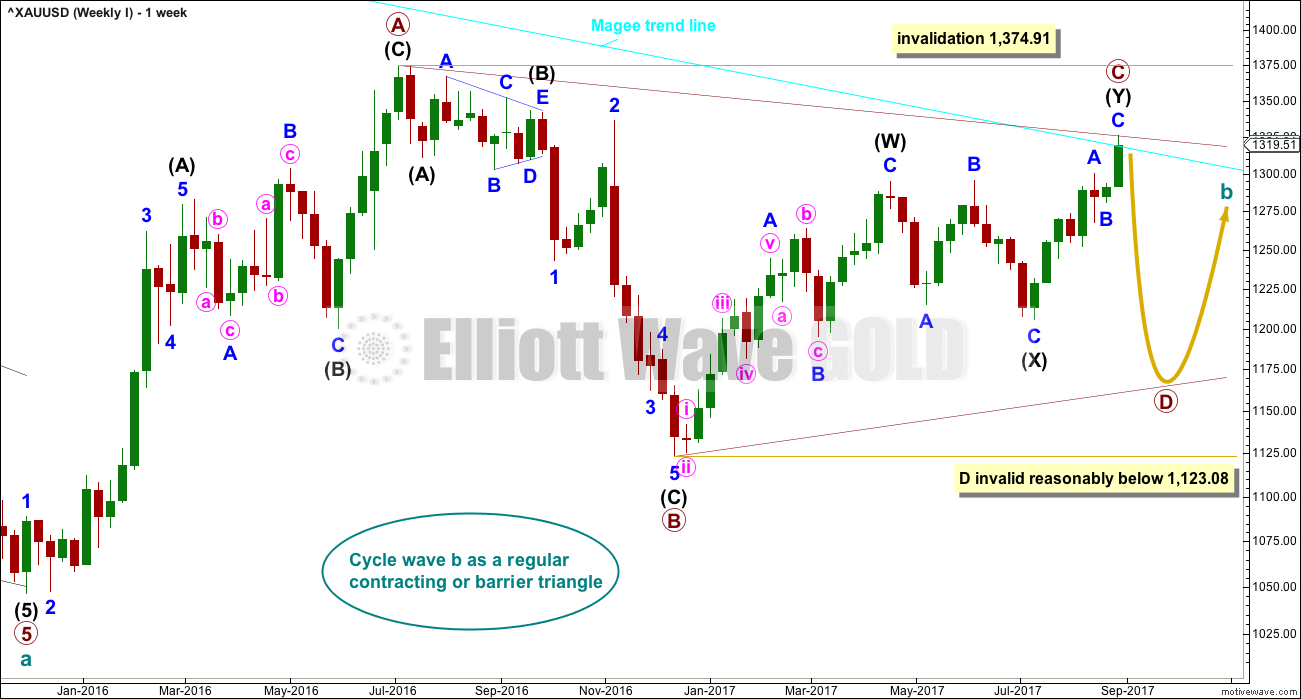
MAIN ELLIOTT WAVE COUNT
WEEKLY CHART
Click chart to enlarge.
Price has closed below the Magee trend line and the line has not been breached, so this shall remain the main wave count. However, the line is overshot and classic analysis favours the alternate wave count over this main wave count. If the Magee trend line is breached by a full daily candlestick, this main wave count would substantially reduce in probability.
The Magee bear market trend line is added to the weekly charts. This cyan line is drawn from the all time high for Gold on the 6th of September, 2011, to the first major swing high within the following bear market on the 5th of October, 2012. This line should provide strong resistance.
To use this trend line in the way Magee describes, we should assume that price will find resistance at the line if it gets back up there. If the line is breached (by at least one or two full daily candlesticks above it), it will be signalling a major trend change from bear to bull. At that point the alternate Elliott wave count should be preferred.
At this stage, a triangle still looks possible and has the best fit for cycle wave b. It has strong support now from declining ATR and MACD hovering about zero.
Within a triangle, one sub-wave should be a more complicated multiple, which may be primary wave C. This is the most common sub-wave of the triangle to subdivide into a multiple.
Intermediate wave (Y) now looks like a developing zigzag at the weekly chart level, and minor wave B within it shows up with one red weekly candlestick.
Primary wave C may have ended at the Magee trend line. At this stage, price has closed back well below the line, so the overshoot is acceptable. For the line to be breached one or two full daily candlesticks need to close above the line and not be touching the line.
Note: The Magee trend line is sitting slightly differently on the main daily chart to the weekly charts. The weekly charts show a small overshoot, but the daily chart shows price exactly touched the line. The line is drawn from exactly the same price points and all charts are on a semi-log scale. The difference is in how Motive Wave formats the primary chart.
Primary wave D of a contracting triangle may not move beyond the end of primary wave B below 1,123.08. Contracting triangles are the most common variety.
Primary wave D of a barrier triangle should end about the same level as primary wave B at 1,123.08, so that the B-D trend line remains essentially flat. This involves some subjectivity; price may move slightly below 1,123.08 and the triangle wave count may remain valid. This is the only Elliott wave rule which is not black and white.
Finally, primary wave E of a contracting or barrier triangle may not move beyond the end of primary wave C above 1,295.65. Primary wave E would most likely fall short of the A-C trend line. But if it does not end there, then it can slightly overshoot that trend line.
Primary wave A lasted 31 weeks, primary wave B lasted 23 weeks, and primary wave C may now be completing its 37th week. A double zigzag may be expected to be longer lasting than single zigzags within a triangle, and so this continuation of primary wave C is entirely acceptable and leaves the wave count with the right look at this time frame.
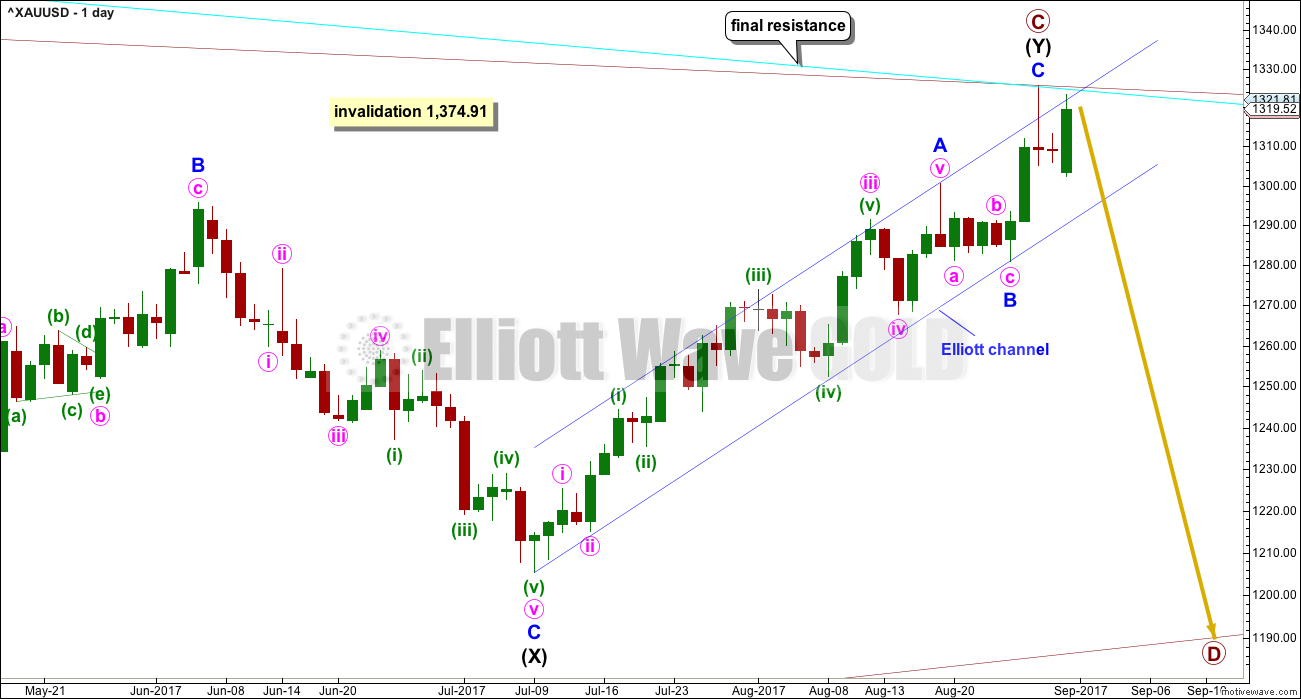
DAILY CHART
Click chart to enlarge.
The cyan Magee trend line should offer very strong resistance. This wave count does not expect it to be breached.
On this daily chart, drawn on a semi-log scale, price has exactly touched the trend line and reacted downwards from there. While price remains below the Magee trend line but within the dark blue Elliott channel, both wave counts will be valid and it will be uncertain what direction may be next.
A breach of the blue Elliott channel by downwards movement would see this main wave count further increase in probability. That would indicate a trend change.
Intermediate wave (Y) may now be a complete zigzag. Minor wave C within it may now be a complete five wave impulse.
This wave count now requires a trend change.
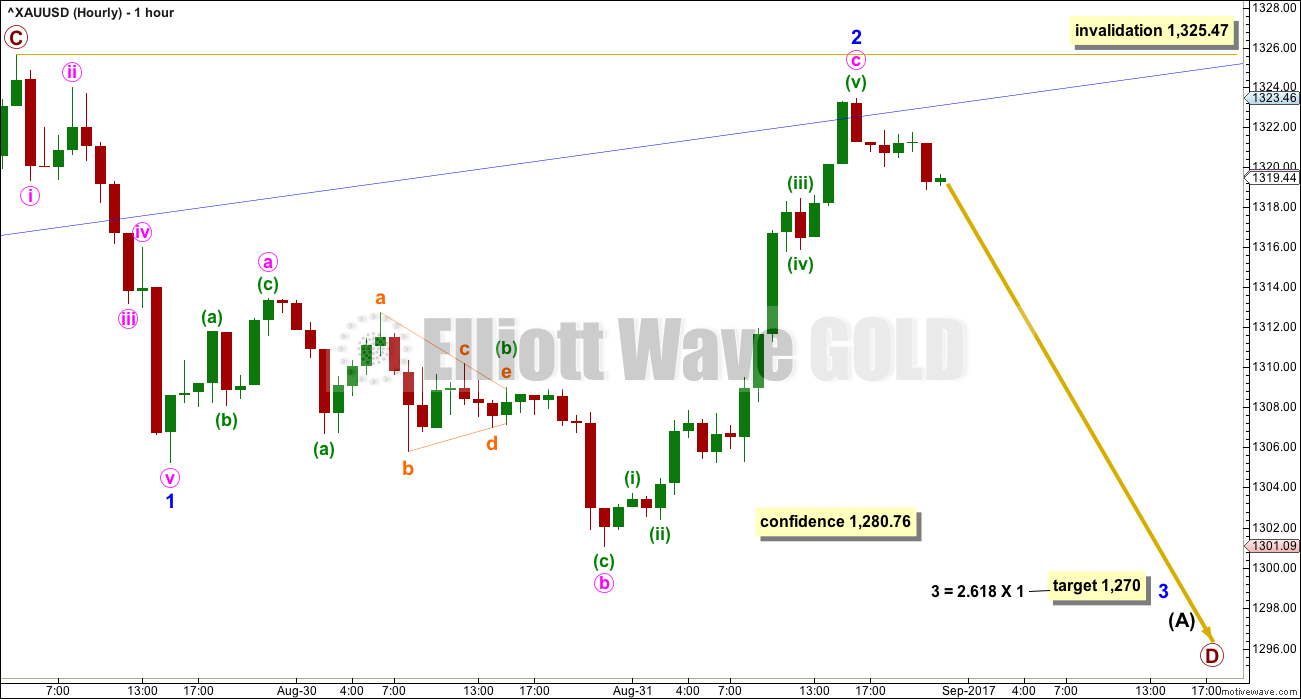
HOURLY CHART
Click chart to enlarge.
If primary wave C is over and primary wave D downwards is now beginning, then a clear five down should develop first at the hourly chart level, then at the daily chart level.
A five down may be complete at the hourly chart level, and minute wave iv is more brief than minute wave ii. This is acceptable. Gold often exhibits impulses which have a curved look when its fourth wave is quicker than its second wave.
Minor wave 2 may be a complete expanded flat correction; these are very common structures. Within the expanded flat, both minute waves a and b subdivide as threes, and minute wave b is a 1.51 length to minute wave a. This is a little longer than the common range of up to 1.38 but it is entirely acceptable. Minute wave c is just 1.06 longer than 2.618 the length of minute wave a.
Minor wave 2 may not move beyond the start of minor wave 1 above 1,325.47. Minor wave 2 is now very deep. It is very common for the first second wave correction within a new trend for Gold to be very deep. So far this looks normal.
A new low below the lower edge of the dark blue channel would add substantial confidence to this main wave count. A new low below 1,280.76 would add further confidence.
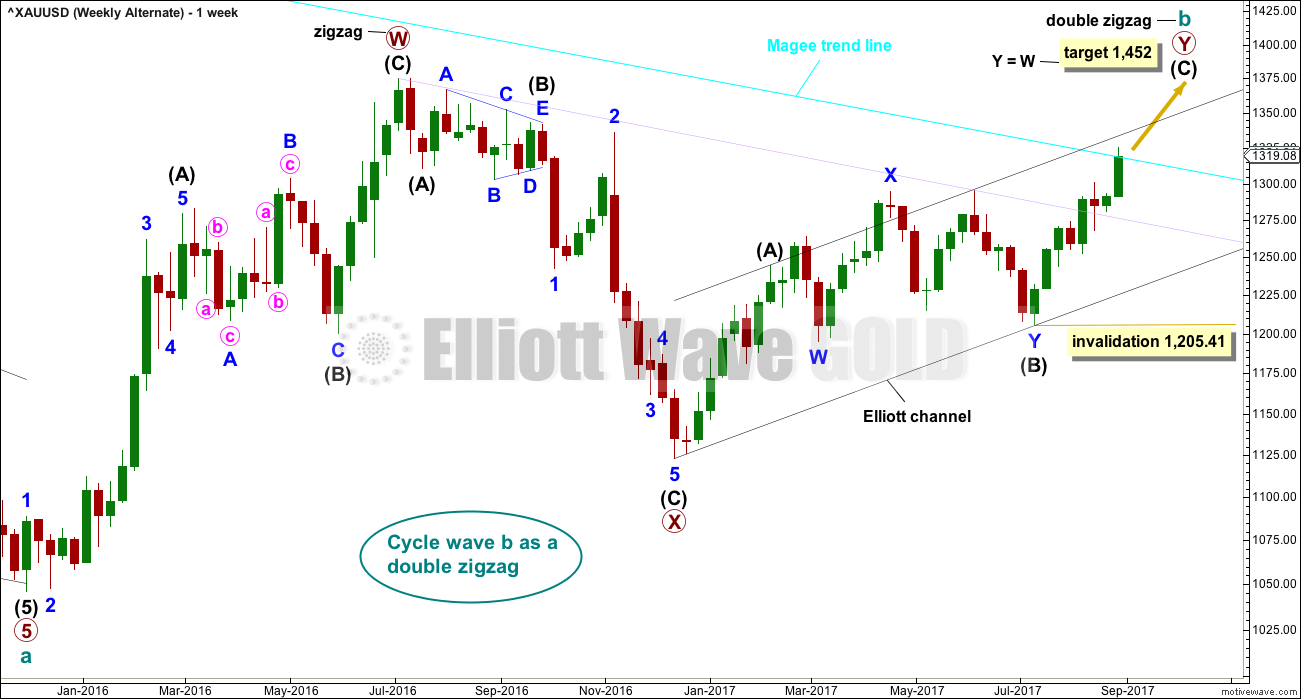
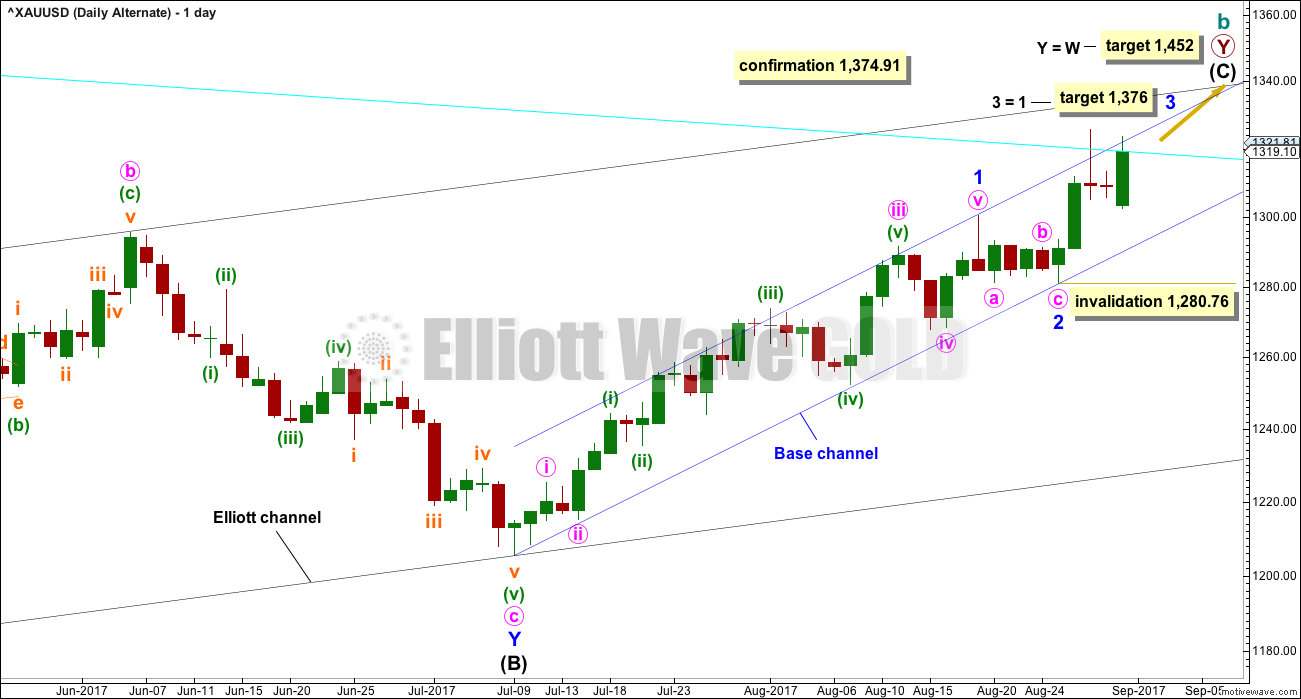
ALTERNATE ELLIOTT WAVE COUNT
WEEKLY CHART
Click chart to enlarge.
There is more support from classic technical analysis today for this alternate wave count. From an Elliott wave perspective though it still has problems, so I would not want to swap the main and alternate wave counts over until a breach of the Magee trend line indicates a new bull trend.
There are more than 23 possible corrective structures that B waves may take, and although cycle wave b fits best at this stage as a triangle (main wave count), it may still be another structure. This wave count looks at the possibility that it may be a double zigzag.
If cycle wave b is a double zigzag, then current upwards movement may be part of the second zigzag in the double, labelled primary wave Y.
The target remains the same.
Along the way up, some resistance should be expected at the cyan Magee trend line. Because this wave count requires price to break above the Magee trend line, it must be judged to have a lower probability for this reason. This trend line is tested multiple times and goes back to 2011. It is reasonable to expect price to find resistance there, until proven otherwise.
Within intermediate wave (C), no second wave correction may move beyond the start of its first wave below 1,205.41.
There are two problems with this wave count which reduce its probability in terms of Elliott wave:
1. Cycle wave b is a double zigzag, but primary wave X within the double is deep and time consuming. While this is possible, it is much more common for X waves within double zigzags to be brief and shallow.
2. Intermediate wave (B) within the zigzag of primary wave Y is a double flat correction. These are extremely rare, even rarer than running flats. The rarity of this structure must further reduce the probability of this wave count.
Low probability does not mean no probability, and when low probability outcomes occur they are never what was expected as most likely.
DAILY CHART
Click chart to enlarge.
Intermediate wave (C) may be unfolding as an impulse.
Within the impulse, minor waves 1 and 2 would now be complete.
Minor wave 2 may have ended as a relatively brief shallow second wave. It is unusual for second wave corrections to be this shallow.
With minor wave 1 a very long extension, the Fibonacci ratio of equality is used for a target for minor wave 3 now.
Within minor wave 3, no second wave correction may move beyond its start below 1,280.76.
HOURLY CHART
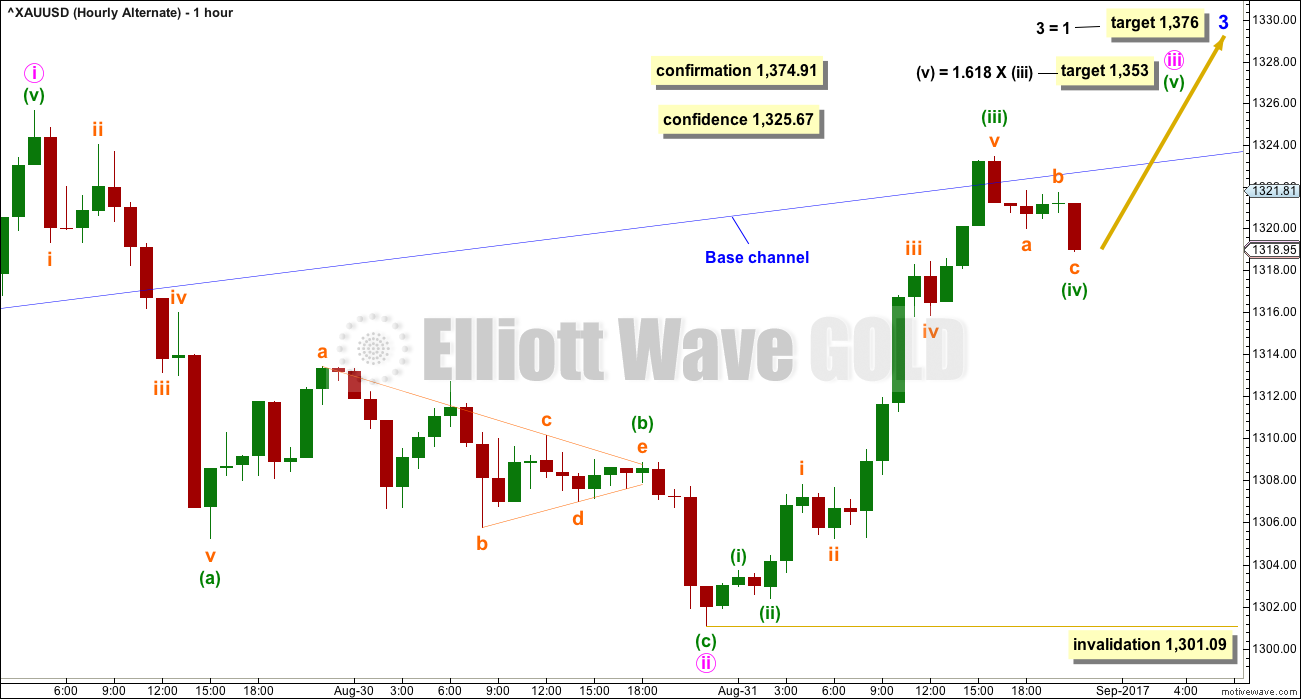
Click chart to enlarge.
Minor wave 3 has now moved above the end of minor wave 1, but not yet far enough above it to allow room for minor wave 4 to unfold and remain above minor wave 1 price territory.
Minor wave 3 may only subdivide as an impulse.
Minute wave ii may be a complete zigzag, falling a little short of the 0.618 Fibonacci ratio at only 0.55 depth. Within minute wave ii, minuette wave (b) is just 0.05 short of 0.382 the length of minuette wave (a).
I have now labelled the middle of the third wave within minute wave iii complete. This has support today from volume. It is very common for Gold to exhibit swift strong and extended fifth waves, particularly its fifth waves which end its third wave impulses. The expectation here will be for minuette wave (v) to be very strong and longer than minuette wave (iii).
This wave count expects to see a further increase in upwards momentum, and upwards movement for a third wave should have support from increasing volume.
TECHNICAL ANALYSIS
WEEKLY CHART
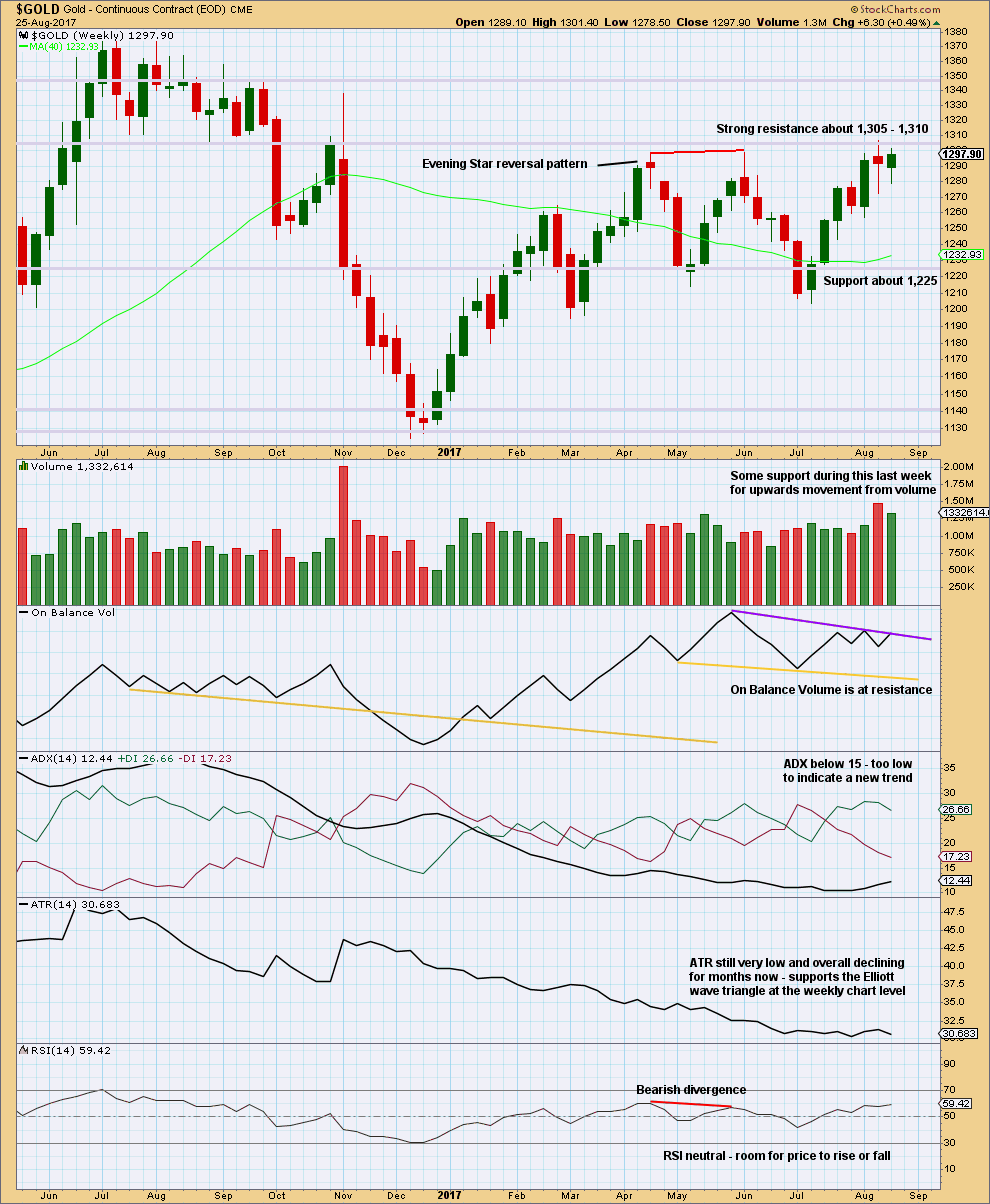
Click chart to enlarge. Chart courtesy of StockCharts.com.
Resistance about 1,305 – 1,310 continues to hold. Each time resistance is tested, and holds, it is strengthened.
Volume is slightly bullish. The long lower wicks on the last two weekly candlesticks is bullish.
The resistance line for On Balance Volume has only been tested twice and is not long held, so it does not offer good technical significance. It offers some weak resistance. If it is breached, that would be a weak bullish signal.
DAILY CHART
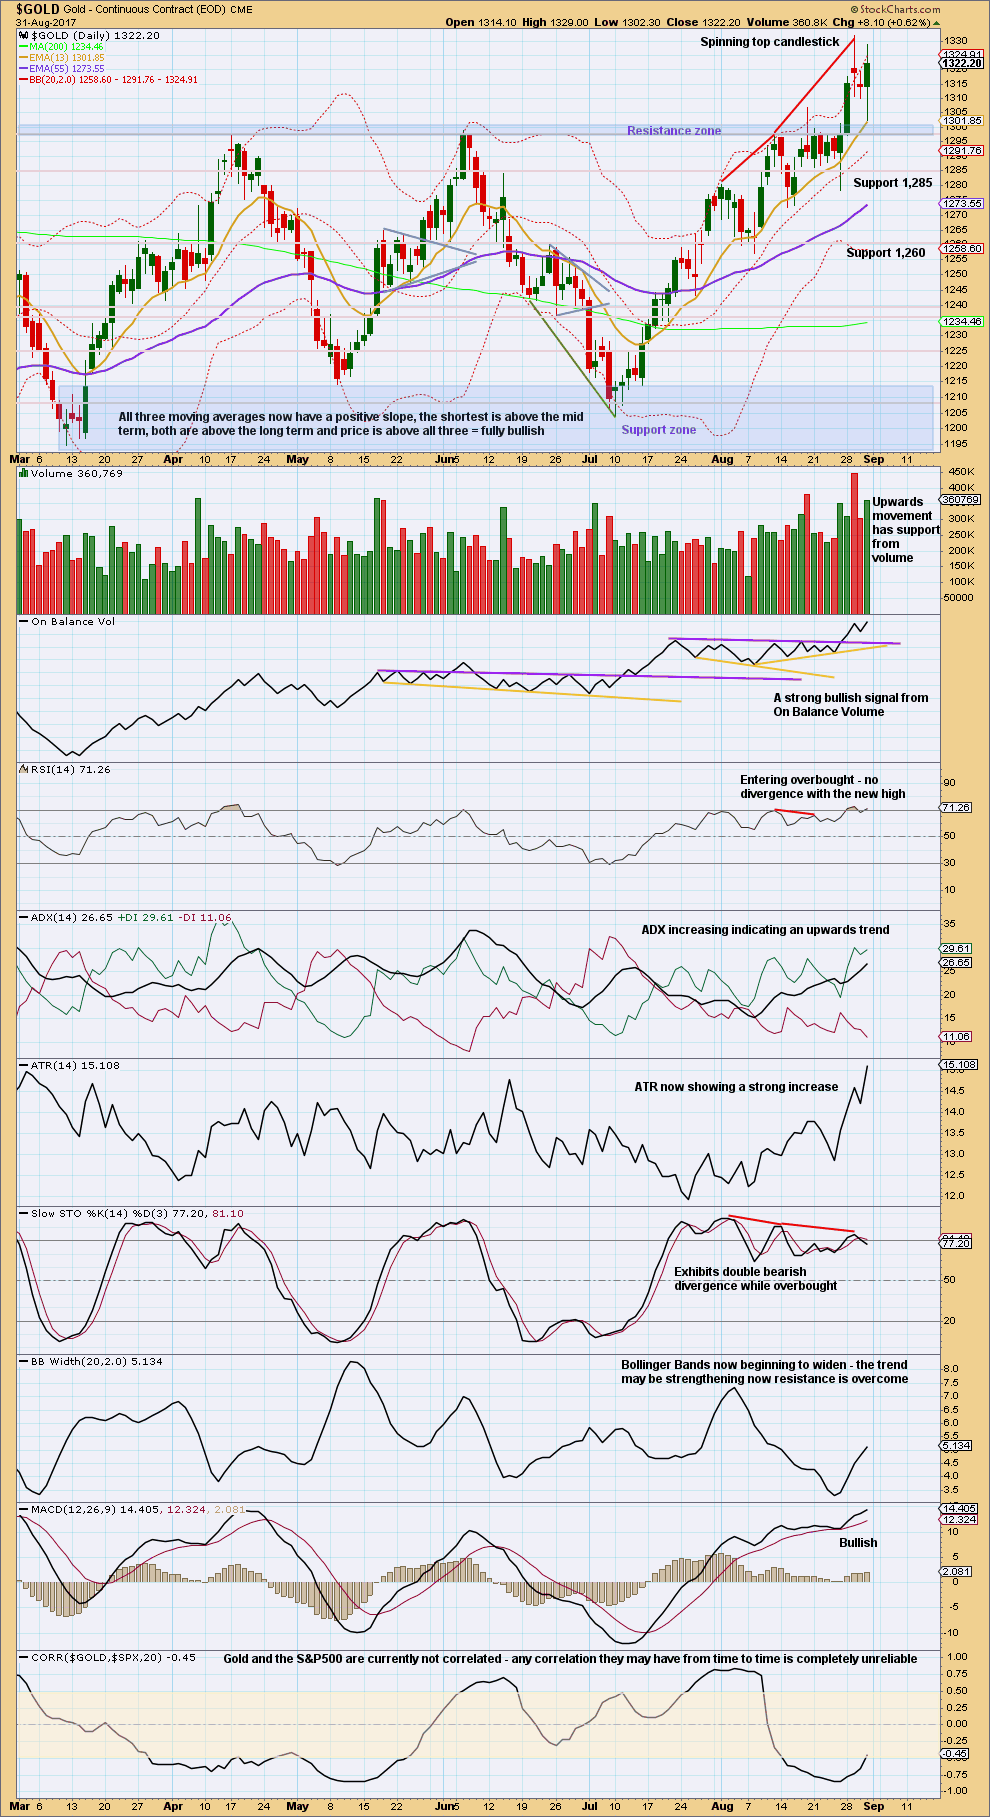
Click chart to enlarge. Chart courtesy of StockCharts.com.
A strong upwards day with a long lower candlestick wick has support today from volume. On Balance Volume remains very bullish. This offers strong support to the alternate Elliott wave count.
Price has found support today at prior resistance and bounced strongly up from there.
RSI and Stochastics may remain extreme for some time when Gold has a strong bullish trend. However, Stochastics does exhibit some weakness within upwards movement.
ATR and now widening Bollinger Bands also support the alternate Elliott wave count.
There is almost no support here for the main Elliott wave count.
Trading Advice:
Members are advised to use their own judgement and their own preferred analysis techniques. If you favour one count over the other, then that is the one you should trade. It would be my judgement that uncertain members may prefer to step aside and wait for price to break out of the zone from 1,301.09 to 1,325.67, when this analysis will be more confident of the next movement.
If preferring to pick one count over the other, I would favour the alternate count today, mostly because of very bullish On Balance Volume.
Another approach may be to open a hedge. The short side should have a stop just above 1,325.67. The long side a stop just below 1,301.09. Invest only a total of up to 5% on the hedge.
GDX
DAILY CHART
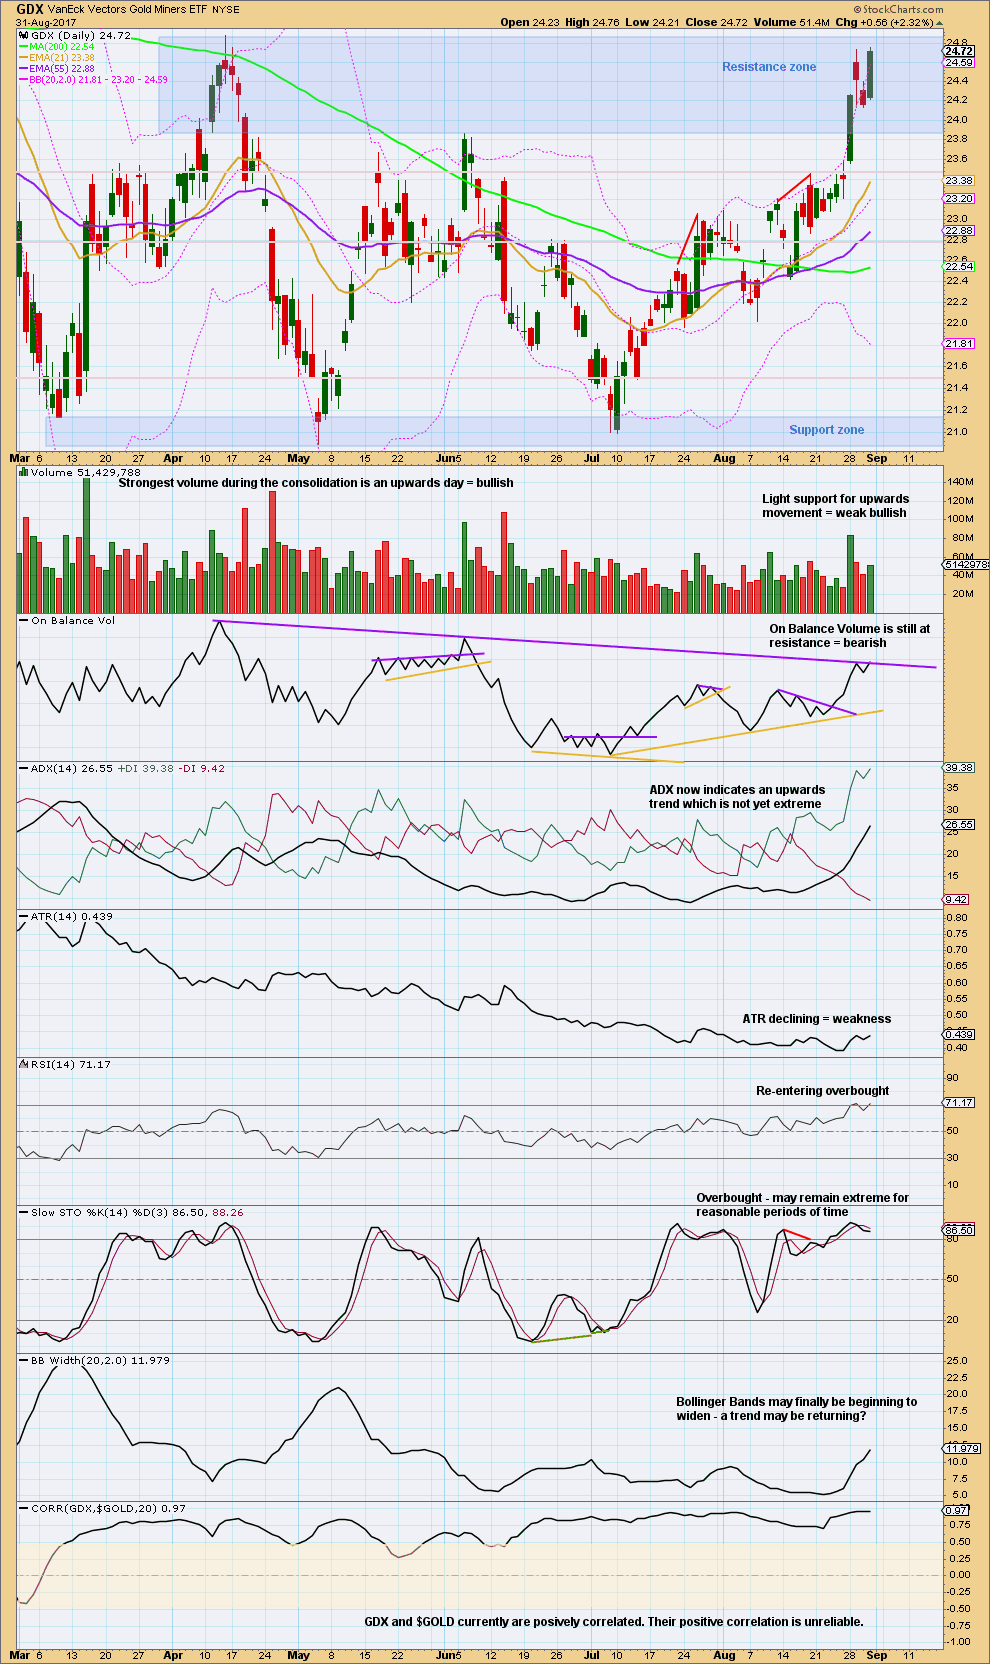
Click chart to enlarge. Chart courtesy of StockCharts.com.
There is an upwards trend and still room for it to continue. The trend lacks support from any increase in ATR, so the trend looks weak.
Price remains within the resistance zone. On Balance Volume is right at resistance. RSI and Stochastics are both extreme. GDX looks less clearly bullish than Gold today.
However, Stochastics and RSI may remain extreme for a reasonable time during a bull trend.
Published @ 10:58 p.m. EST.
What’s interesting to me is that the Yen has turned back down from resistance. And has given a macd sell signal on the daily.
Since gold and the yen are positively correlated, and gold has broken out while the Yen has turned back down, something’s going to have to give here.
Gold and USDJPY are not currently correlated.
Their correlation co-efficient is ATM -0.24.
More recently they had a negative correlation, not positive, since April.
if the alternate is correct then there’s a really strong move up ahead, a third wave now at three degrees
stops can be just below the invalidation point 1,317.14
target either 1,353 or 1,376 or even 1,452 depending on your preferred time horizon
if this wave count is correct then price could move up vertically with almost no pullbacks
when it behaves like that don’t wait, jump in and hold on. if you’re prepared to hold an underwater position for 2-3 days and you manage risk, then you can get the profits of a big move like that
but if the wave count is right then jumping in should see positions profitable quickly
the wave counts will be swapped over today, price is now closing above the Magee bear market trend line
this will be the new hourly chart
The Australian gold miners index looks to be breaking out as well. When gold silver and the miners act in unison I expect that this is the start of an impulsive move for all
Silver seems to be breaking out as well
I posted this a while back and it still looks like a fair indication. of what’s going on.
Gold and silver going higher and are in up trend now.
The significant and reliable trend indicator for PM sector is Gold to silver ratio (GSR).
I have been watching this hourly chart for clue since June.
AND finally it has breakdown from top HnS.
It may target the apex of the triangle it brokeout in May when Lara’s EW count turn bearish.
Hope this trend is real and not a FBO for longs.
Imo doesn’t good for the shorts unless a sustained break below 1314 occurs. Gold price appears to be coasting in an up channel having taken out and traded through the previous 1325 high making higher lows in the process. Sideways consolidation with next likely target 1331-1340 range? Who is to say what happens next and is it goodbye 1300? lol…. Have a great weekend all.
Agreed Syed
Although I;’m not sure how to count todays early action ~9:30 am
Looks to me like we are about to launch in a 3rd up
Very much like the ALT
Here’s a daily look at my bull count for GDX.
With an upwards breakout of the falling wedge, a golden cross of the 50MA/200MA two days ago, and an “around the APEX” move apparently in play, I like the odds for the bull move to continue.
That said, if you have not already been long GDX, it’s hard to find a good entry point as we may be in a strong 3rd wave up. Strong bull moves don’t often give good entry points. Oversold conditions can continue, but for the 3rd time this week, price has closed above the Bollinger band suggesting caution to longs.
My EW count suggests that a pullback could occur at this time and it could be somewhat deep as the short term invalidation point is at 23.20.
Hopefully we’ll get some clarification from Gold soon that may help guide us. Good luck.
https://www.tradingview.com/x/jXVFMzAS/
Dreamer can i get your contact in tradeview i would like to follow you
Amjad,
I don’t actually post any work on Tradingview. I use the site for my own charting and post charts here that I think members may be interested in. Mostly GDX with a little Gold, oil and misc mixed in.
Thanks for asking.
Thank you very much Dreamer for sharing your work 🙂
That looks like a solid EW count to me
Great! Was hoping you would approve. Now we just need a gold breakout to really give us all more confidence in a continued move up 😀
I like your Job and thanks for your replay 😊