An upwards day was again expected as most likely, but this is not what happened. Price remains above the invalidation point on the main hourly chart, and has quickly returned to within the blue channel.
Summary: While price remains above 1,260.03 and within the adjusted blue channel, it is entirely possible that a high is not yet in place.
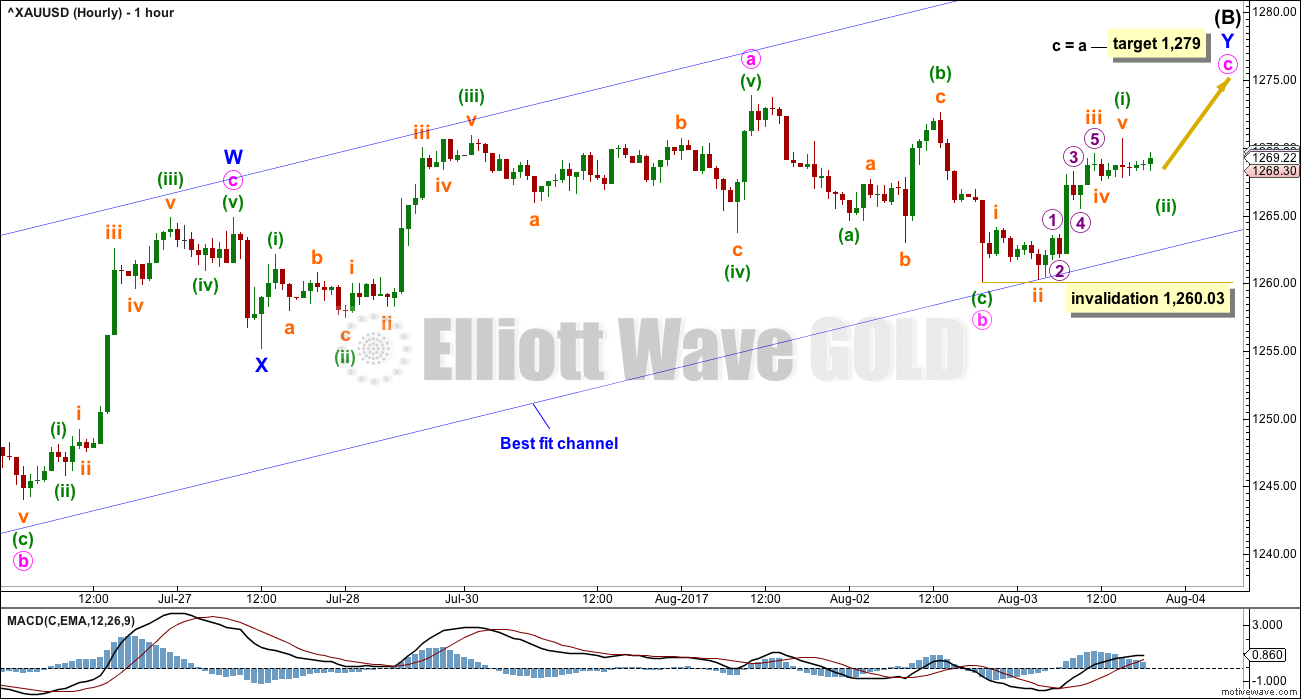
In the short term, the classic technical analysis is bullish and supports a green daily candlestick for tomorrow. The target is now 1,279.
If price breaks fully below the channel (not just an overshoot) and then below 1,260.03, expect that Gold has likely had a trend change.
Always use a stop. Invest only 1-5% of equity on any one trade.
New updates to this analysis are in bold.
Last monthly charts and alternate weekly charts are here, video is here.
Grand SuperCycle analysis is here.
MAIN ELLIOTT WAVE COUNT
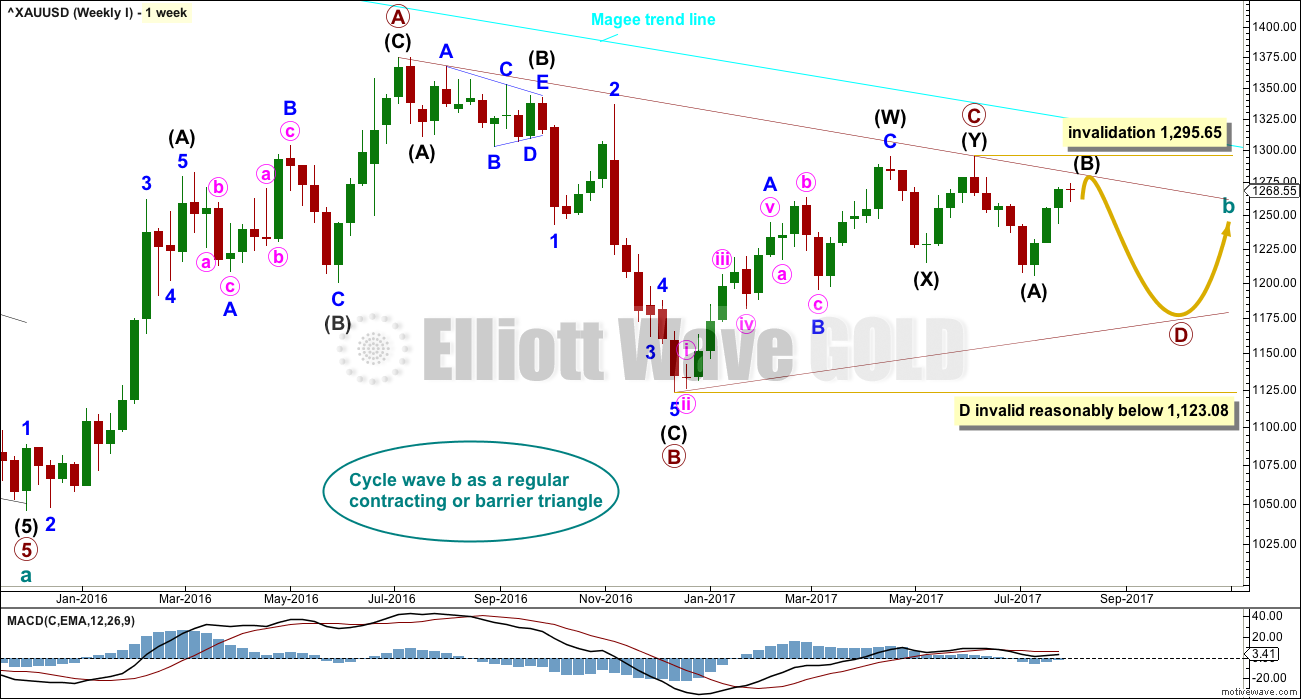
WEEKLY CHART
The Magee bear market trend line is added to the weekly charts. This cyan line is drawn from the all time high for Gold on the 6th of September, 2011, to the first major swing high within the following bear market on the 5th of October, 2012. This line should provide strong resistance.
At this stage, a triangle still looks possible and has the best fit for cycle wave b. It has some support from declining ATR and MACD now beginning to hover about zero.
Within a triangle, one sub-wave should be a more complicated multiple, which may be primary wave C. This is the most common sub-wave of the triangle to subdivide into a multiple.
Primary wave D of a contracting triangle may not move beyond the end of primary wave B below 1,123.08. Contracting triangles are the most common variety.
Primary wave D of a barrier triangle should end about the same level as primary wave B at 1,123.08, so that the B-D trend line remains essentially flat. This involves some subjectivity; price may move slightly below 1,123.08 and the triangle wave count may remain valid. This is the only Elliott wave rule which is not black and white.
Triangles normally adhere very well to their trend lines. So far the A-C trend line has been tested 11 times; this line has very strong technical significance. If this wave count is correct, then intermediate wave (B) should find very strong resistance if it gets up to the A-C trend line. A small overshoot is acceptable. A breach is not. If price reaches up to that trend line in the next one to few days, it would offer a good entry point for a short position. Stops then may be set a little above the line, or just above the invalidation point.
Finally, primary wave E of a contracting or barrier triangle may not move beyond the end of primary wave C above 1,295.65. Primary wave E would most likely fall short of the A-C trend line. But if it does not end there, then it can slightly overshoot that trend line.
Primary wave A lasted 31 weeks, primary wave B lasted 23 weeks, and primary wave C may have been complete in 25 weeks.
Primary wave D should now be expected to last a Fibonacci 13 or 21 weeks in total.
DAILY CHART
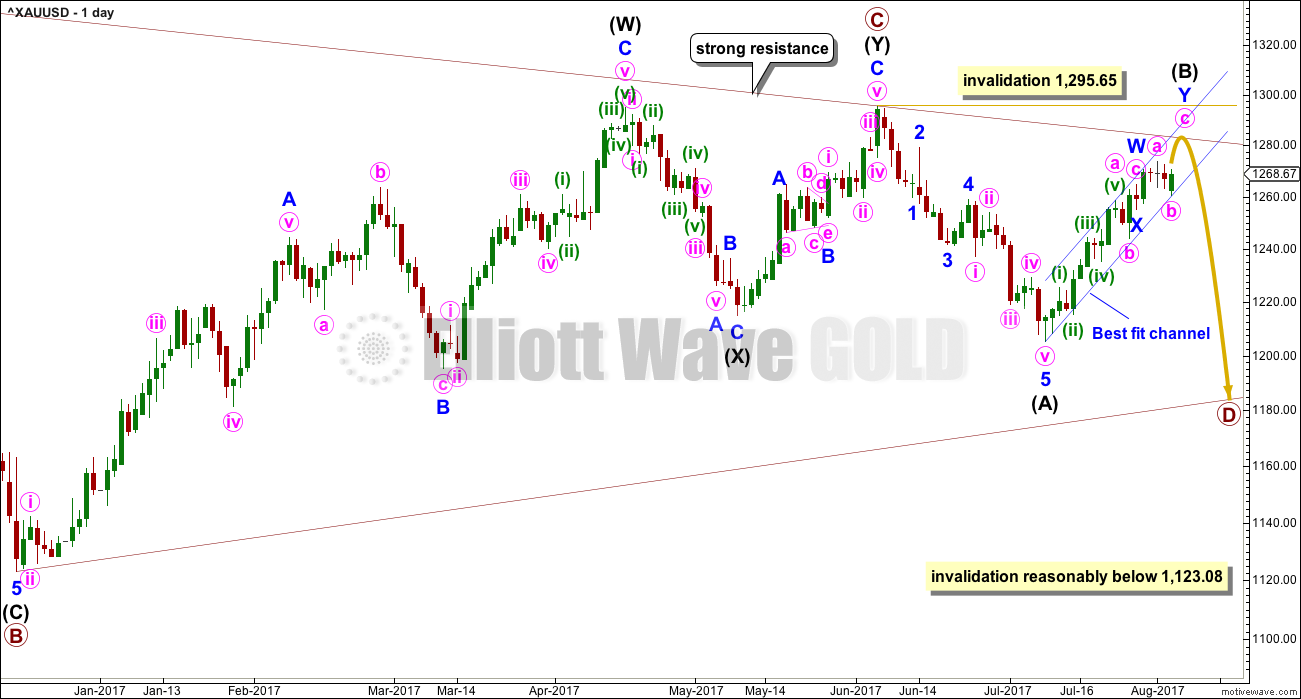
The daily chart today is zoomed out to show all movement from the December 2016 low, so that this main wave count may be easily compared to the changes in the alternate. This main wave count has a perfect fit and most common structures.
A common range for triangle sub-waves is from about 0.8 to 0.85 the prior sub-wave, this gives a range for primary wave D from 1,158 to 1,149.
At this stage, to try and see the whole of primary wave D complete at the last low does not look right. The B-D trend line would be too steep for a normal looking contracting Elliott wave triangle, and primary wave D would have been far too brief at only 5 weeks duration. For the wave count to have the right look and good proportions (as Gold almost always does), primary wave D should not be labelled over yet.
If primary wave C is correctly labelled as a double zigzag, then primary wave D must be a simple A-B-C structure and would most likely be a zigzag.
With intermediate wave (A) complete and now intermediate wave (B) a large and deep correction, primary wave D is beginning to look very typically like a large exaggerated zigzag.
The structure of intermediate wave (B) is reanalysed today. It has a better fit as a double zigzag if it is still continuing. It is still possible today that it could be over at the last high; the second hourly wave count below looks at that. Both hourly wave counts see the subdivisions within intermediate wave (B) in exactly the same way up to minute waves a and b. Thereafter they differ.
So far intermediate wave (B) has lasted 18 days. If it now continues for another three sessions, it may total a Fibonacci 21 days.
Within the zigzag of primary wave D, intermediate wave (B) may not move beyond the start of intermediate wave (A) above 1,295.65.
HOURLY CHART
There was a mistake in the last published wave count of a possible ending expanding diagonal for minor wave C. Within that count, minute wave iii was slightly shorter than minute wave i violating the rule regarding wave lengths for an expanding diagonal. The idea is discarded for this reason and I apologise to members for publishing it.
This new wave count meets all Elliott wave rules, and has no divergence in expected direction or the invalidation point.
Double zigzags are common structures. Within them their X waves joining the two zigzags are normally brief and shallow as this one is. The second zigzag in the double exists to deepen the correction, and this one is doing that. They normally fit reasonably well within parallel channels. This channel is slightly adjusted to enclose all upwards movement.
The most common Fibonacci ratio for C waves is equality in length with their corresponding A waves. The target should have a reasonable probability.
After a new high, it would be possible that intermediate wave (B) could be over. A subsequent breach of the redrawn blue channel would indicate a trend change.
SECOND HOURLY CHART
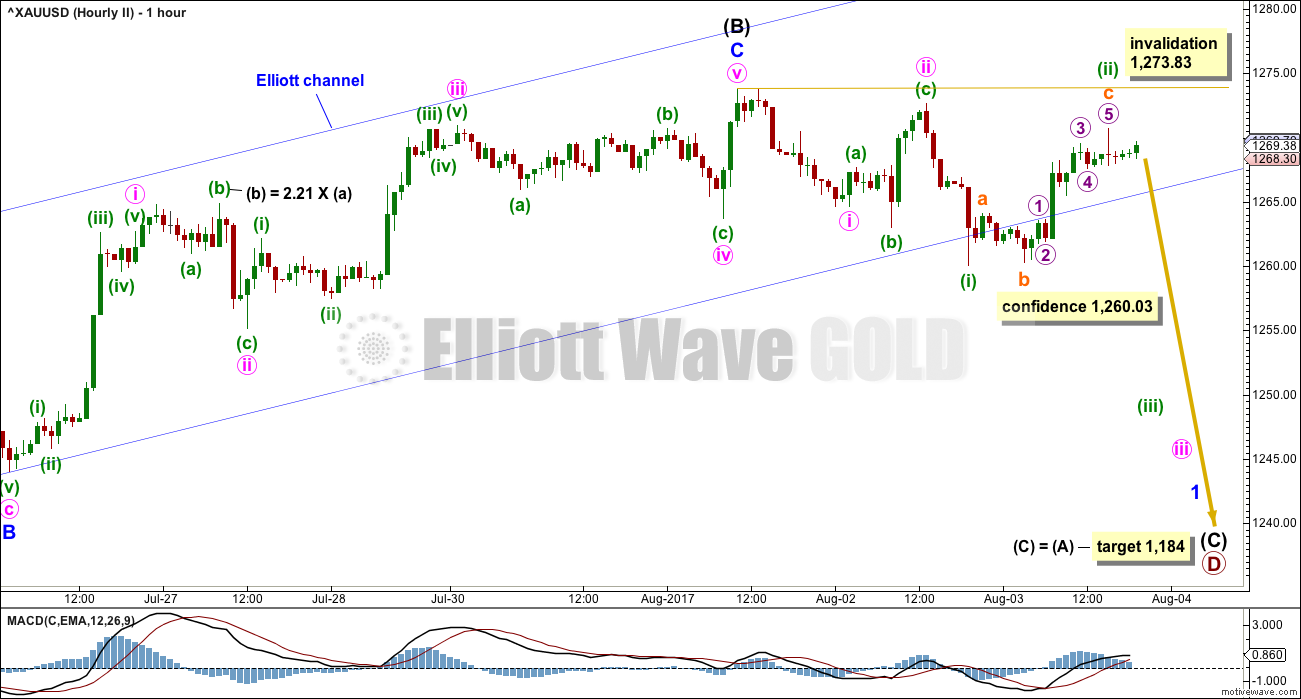
It is still possible that intermediate wave (B) could be a complete zigzag.
This wave count still suffers from a serious problem. The correction of minute wave ii within minor wave C is an expanded flat. But minuette wave (b) is slightly longer than the maximum conventional allowance of 2 times the length of minuette wave (a). While this is possible and does not violate any Elliott wave rules, the probability of it is very low.
The break below the channel within the last 24 hours may be a warning that this wave count could be right.
Some confidence may now be had in it if price makes a new low below 1,260.03 by any amount at any time frame.
ALTERNATE ELLIOTT WAVE COUNT
WEEKLY CHART
This wave count has been published only in historical analysis. At this stage, it will be published on a daily basis.
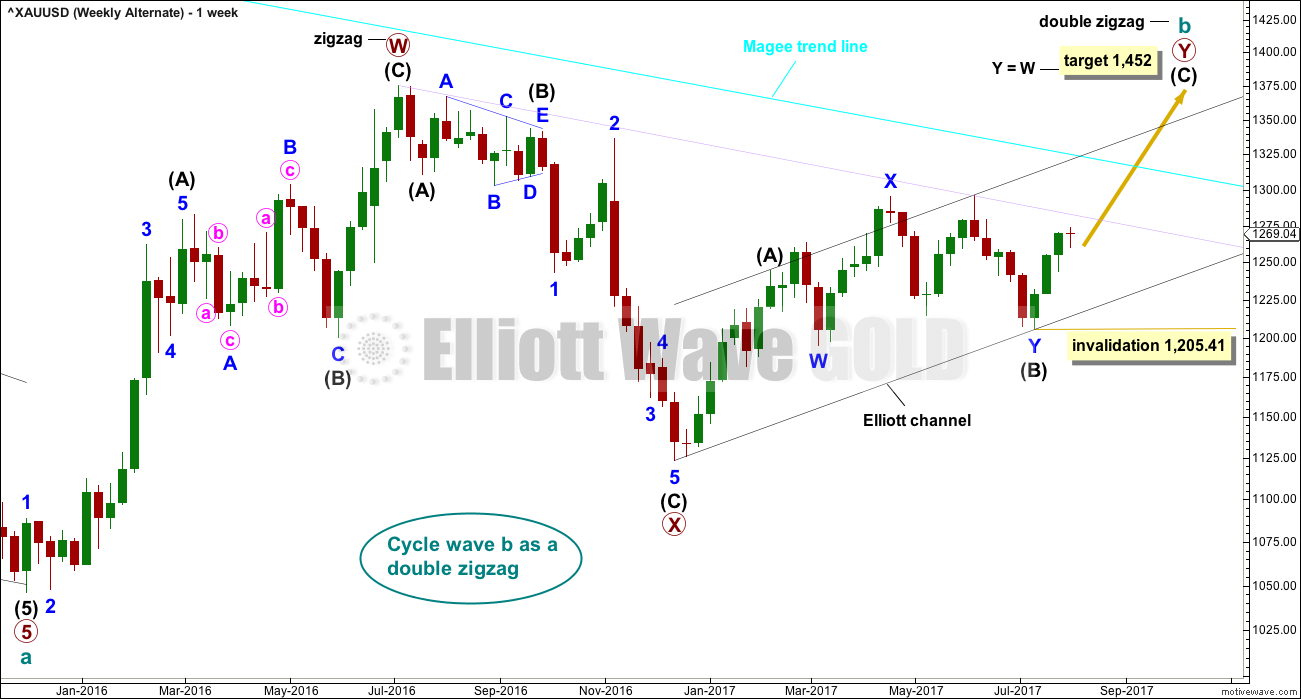
There are more than 23 possible corrective structures that B waves may take, and although cycle wave b fits best at this stage as a triangle (main wave count), it may still be another structure. This wave count looks at the possibility that it may be a double zigzag.
If cycle wave b is a double zigzag, then current upwards movement may be part of the second zigzag in the double, labelled primary wave Y.
The problem noted up to yesterday of intermediate wave (A) looking like a three but needing to be seen as a five is today resolved. This is discussed under the daily chart which shows the detail of how this movement may subdivide.
The target remains the same as previously published for this wave count.
Along the way up, some resistance should be expected at the cyan Magee trend line.
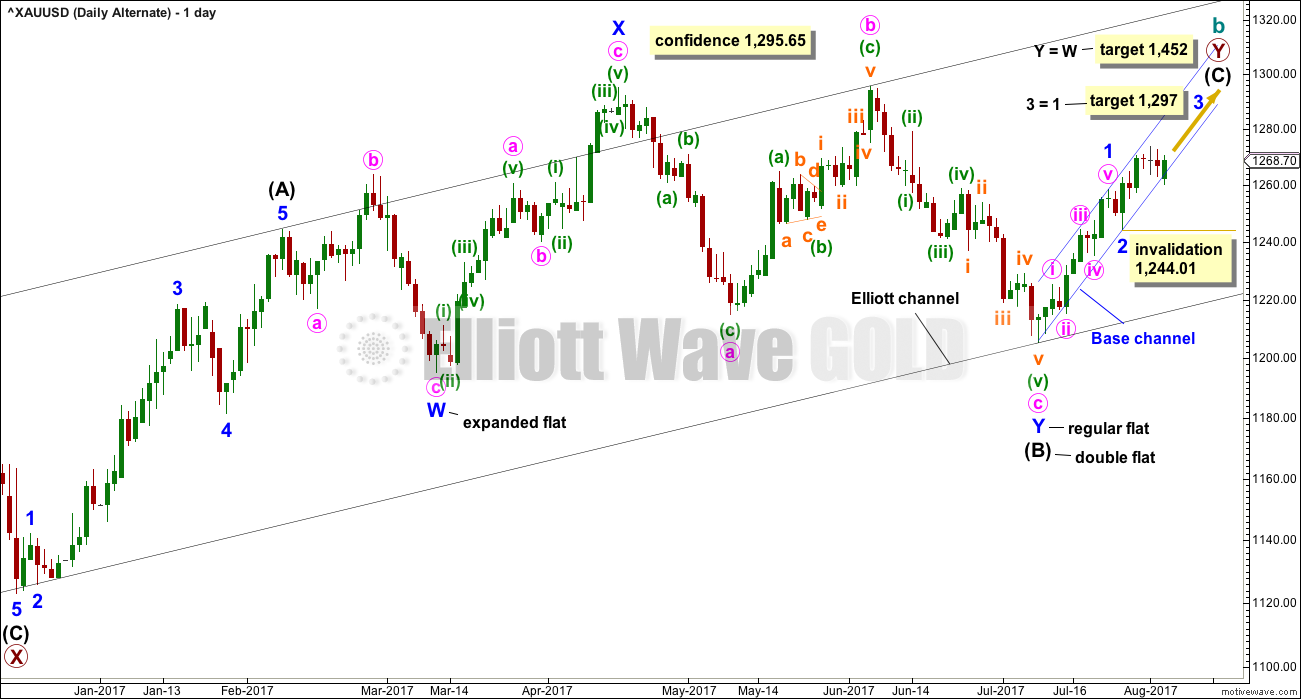
Within intermediate wave (C), no second wave correction may move beyond the start of its first wave below 1,205.41.
DAILY CHART
Intermediate waves (A) and (B) are today reanalysed. Intermediate wave (A) will fit perfectly as a five wave impulse if seen over earlier, and it now looks like a five at all time frames. Intermediate wave (B) now begins earlier.
Intermediate wave (B) then subdivides as a double flat correction: expanded flat – X – regular flat. While all the subdivisions have a neat fit, double flats are very rare structures. In my now 9 years of daily Elliott wave analysis I can say with certainty that I have only ever seen one before. For this reason, this wave count must be judged to have a low probability.
It will remain as labeled though because this labelling has a good fit, and threes and fives look as they are supposed to.
Intermediate wave (C) may be unfolding as an impulse.
Minor wave 2 may be over as a very quick and shallow zigzag.
Because minor wave 1 was a long extension, the target for minor wave 3 is for equality with minor wave 1.
Within minor wave 3, no second wave correction may move beyond the start of its first wave below 1,244.01.
HOURLY CHART
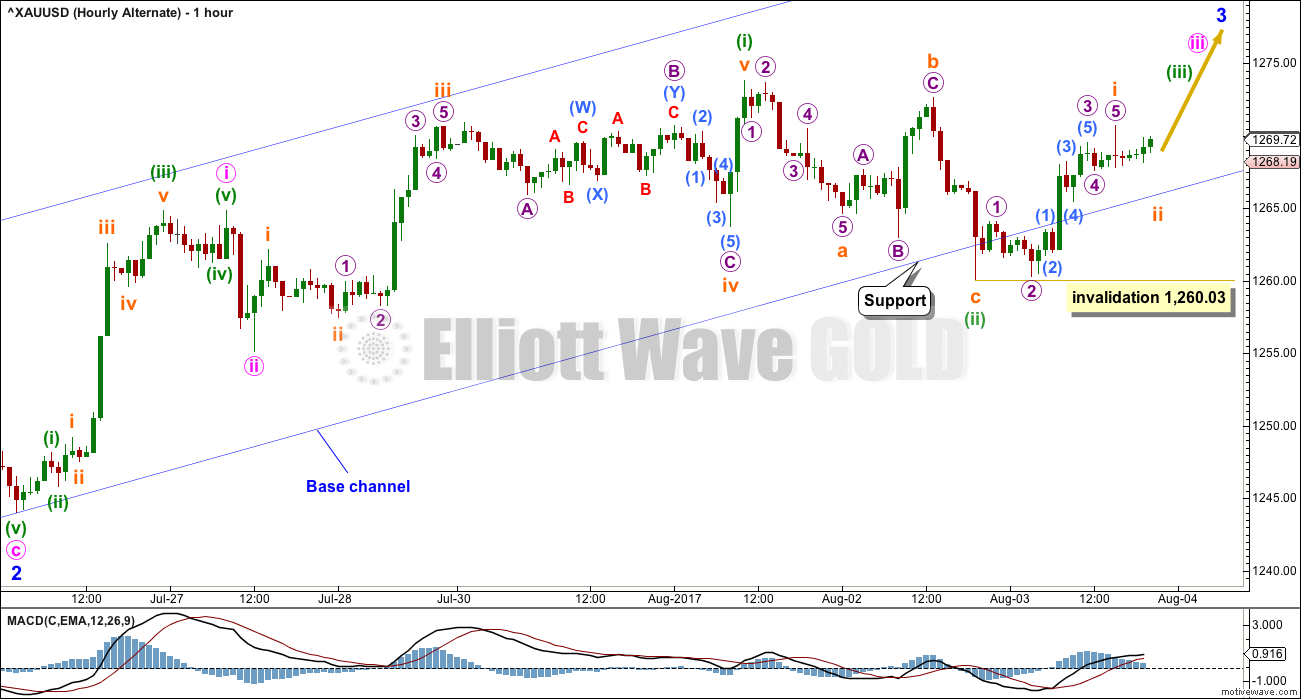
If minor wave 3 for this alternate is to be an extension reaching equality with minor wave 1, then its subdivisions may show up on the daily chart like those for minor wave 1 do.
This wave count would now expect a strong increase in upwards momentum as the middle of a third wave passes. It is now quite concerning that momentum has not increased and is showing a strong decline. This does not support this wave count today. It is also concerning that the last week overall shows a decline in volume. A third wave should be strong, unmistakable, and have support from volume. However, this wave count remains viable; sometimes a third wave can start out a little slow.
Subminuette wave ii may not move beyond the start of subminuette wave i below 1,260.03.
TECHNICAL ANALYSIS
WEEKLY CHART
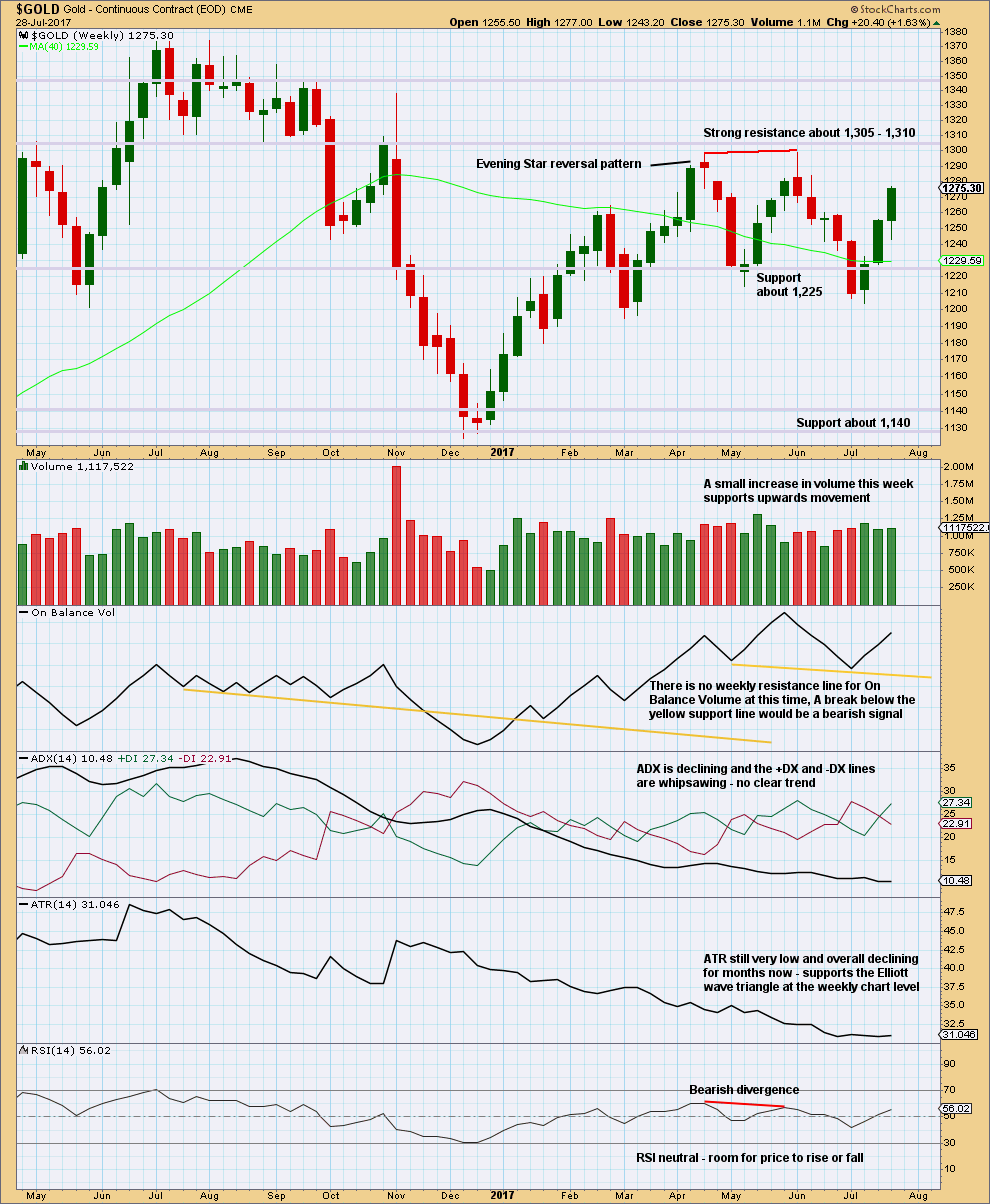
Click chart to enlarge. Chart courtesy of StockCharts.com.
A long lower wick and some support from volume suggest more upwards movement this week.
Price is range bound with resistance about 1,305 to 1,310 and support about 1,225 to 1,205. During this range bound period, it is an upwards week that has strongest volume suggesting an upwards breakout may be more likely than downwards. This is contrary to the main Elliott wave count.
ATR continues to decline, which does support the main Elliott wave count.
DAILY CHART
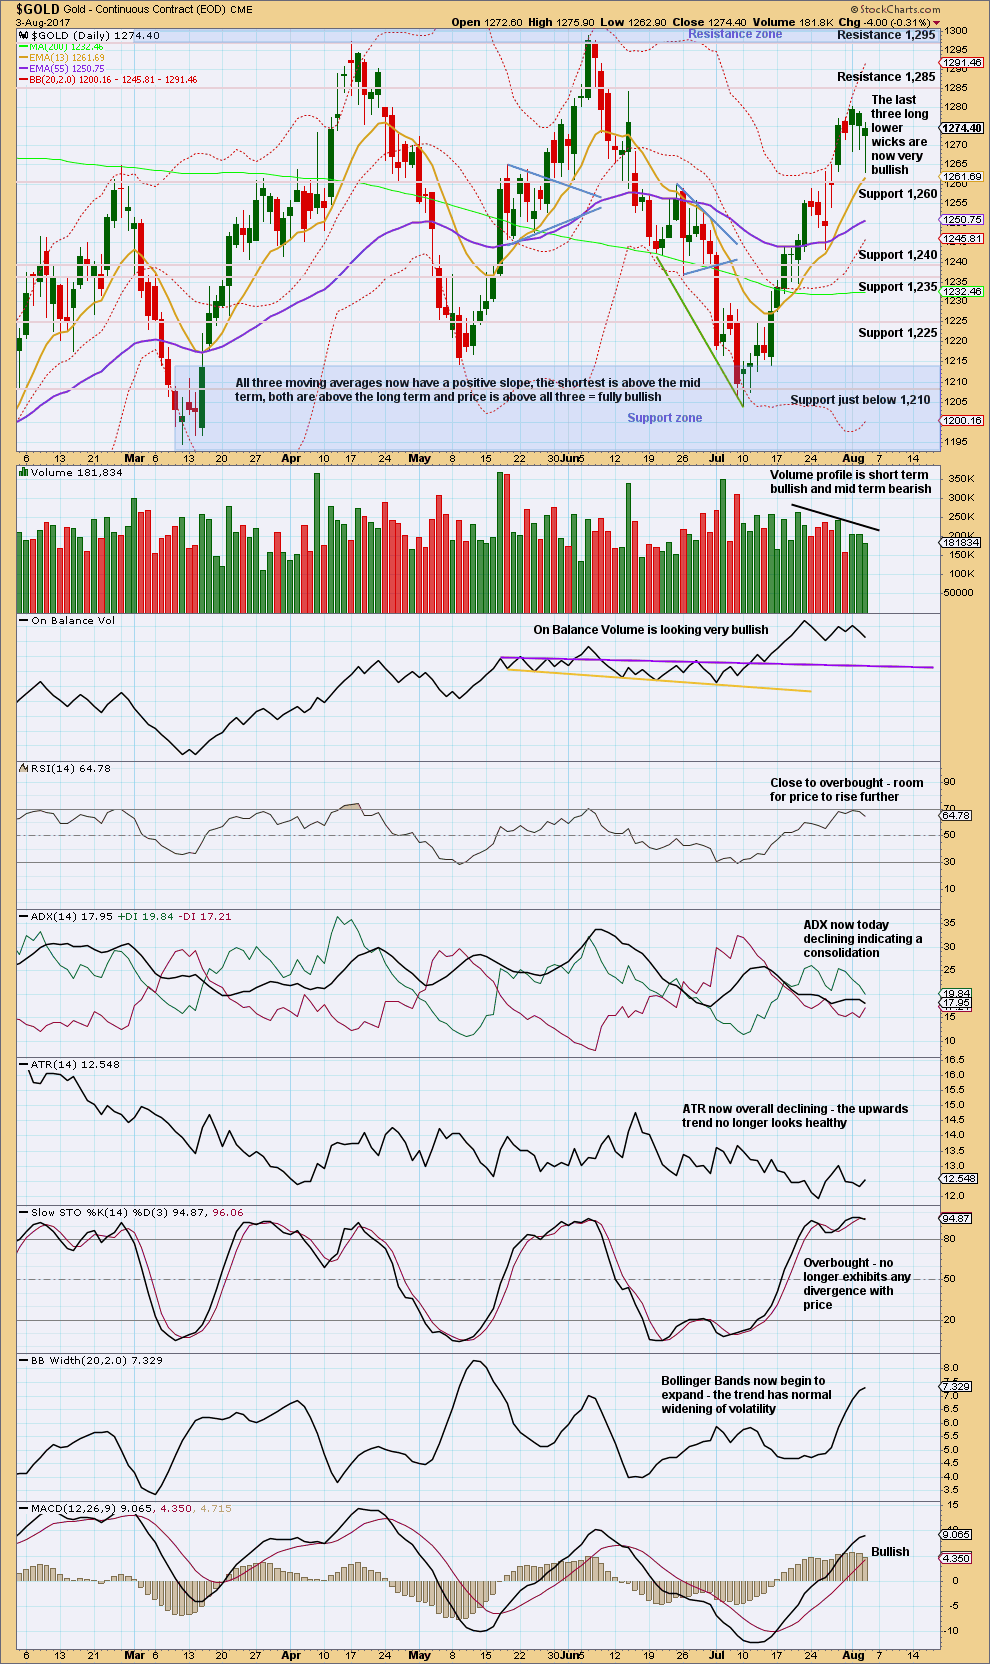
Click chart to enlarge. Chart courtesy of StockCharts.com.
Stepping back and looking at the larger consolidation, Gold moved into a range back in February this year, delineated by support and resistance zones. During this consolidation, it is two upwards days of 7th of April and the 17th of May that have strongest volume. This suggests an upwards breakout is more likely than downwards, and it supports the alternate Elliott wave count and not the main Elliott wave count.
However, this signal is not a strong one. The third strongest day of the 18th of May is a downwards day, and it is very close in volume to the two upwards days.
Further commentary is today all on the chart.
Give weight to the long lower candlestick wicks; expect an upwards day tomorrow as very likely.
GDX
DAILY CHART
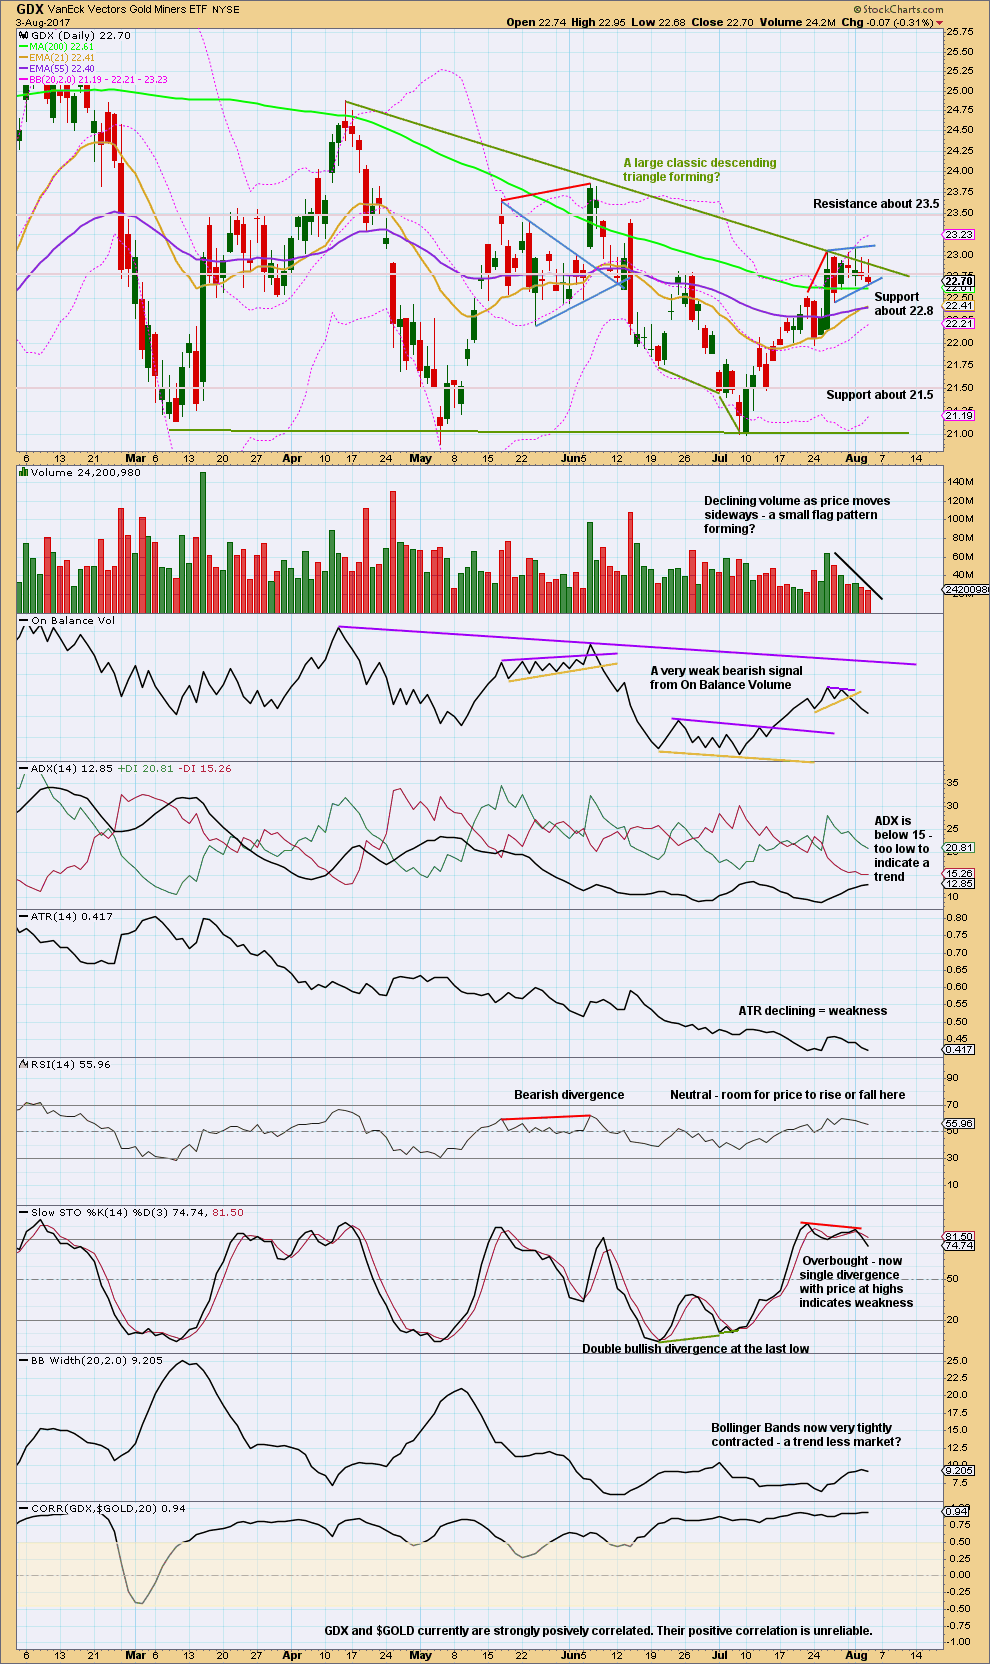
Click chart to enlarge. Chart courtesy of StockCharts.com.
Stepping back for GDX too, to look at the past six months, a large descending triangle looks like it has formed and may be close to a breakout. Breakouts from descending triangles are usually downwards.
During this structure though it is an upwards day for the 15th of March that has strongest volume suggesting an upwards breakout may be more likely than downwards.
There is overall some decline in volume lately. This supports the view that a triangle is nearing completion. ATR also supports this view.
Trend lines are added to the small consolidation. This looks like it may be a small flag pattern, but it has a slight upwards slope. Flags are more reliable when they slope against the trend, not with it. This one may not be so reliable.
Today, the last three candlesticks have long upper wicks. This looks bearish for the short term for GDX. Price is finding resistance almost at the upper green triangle trend line.
Published @ 08:22 p.m. EST.

The second hourly chart was the one. Looks like we’ve had a trend change, on the next wave down now to 1,184.
Look out for a bounce to backtest the channel, if that happens go short there with stops just above the invalidation point.
This next wave down may last weeks.
Thanks Lara
This ‘bounce’ that might backtest the channel, you are referring to blue 2?
could be…. I’d expect minor (blue) 2 to be 0.618 X minor 1, or deeper
Thanks Lara. Should bounce back up to at least the 61.8% fib level, at roughly 1264 for a good chance to short I believe.
Hi Lara, would you consider doing wave counts for the EUR/USD and GBP/USD now the dollar might be reversing?
Many thanks.
I’ll consider updating my counts and publishing for you.
As mentioned in my Daily post, if the NFP figures came out stronger than expected, gold prices would pullback. My first choice of target was the top cloud boundary around 1251. Let’s see if it holds.
July jobs: 209,000 jobs created.
Stronger USD. Goodbye, gold!
Yup. Looks bleak for the bulls
I agree. With the gap down out of the channel, it looks like the high was in for GDX at 23.09. GDX should be headed toward 20.50
and bitcoin near its all time high. Almost makes you feel like gold is just done. Cannot break through any meaningful resistance, that goes for the gold stocks and the metal. Very gloomy right now
down she goes following NFP
Gold Ichimoku Daily Analysis
Data as at market close, August 3
===========================
Gold prices successfully backtested the kumo yesterday. This indicates prices should move higher in the short term. The tenkan-sen lies above the kijun-sen, and the gap is widening. Gold prices are contained in an upward sloping channel, and therefore making higher highs and higher lows. So, unless the NFP figures comes in stronger than expected, gold prices would continue marching higher. That is to say, another test of the cloud is not out of the question. I reckon a correction to the 1251 level, the top cloud boundary, is justified and today’s NFP might be the reason behind this pullback. The safety play is, of course, to wait for the NFP report to be released before making a decision.
2011 down trend line have deflected multiple gold advances. I believe gold needs to retest 1180 before it can breach 2011 trend support