
Upwards movement was unexpected and has invalidated the Elliott wave count at the hourly chart level.
Summary: The target is at 1,279, but it may be a little too low. If price moves above the target, look for resistance at the maroon trend line on the main daily chart. If that line is touched again, it may be offering another entry opportunity to join the next swing down.
Stops for any short positions should be set a reasonable amount above the maroon trend line (allow for overshoots), and just above 1,295.65 at maximum.
Members unsure of this analysis after today’s invalidation may like to open a long hedge to any short positions, with stops just below 1,252.39 at maximum.
Always use a stop. Invest only 1-5% of equity on any one trade.
New updates to this analysis are in bold.
Last monthly charts and alternate weekly charts are here, video is here.
Grand SuperCycle analysis is here.
MAIN ELLIOTT WAVE COUNT
WEEKLY CHART
Click chart to enlarge.
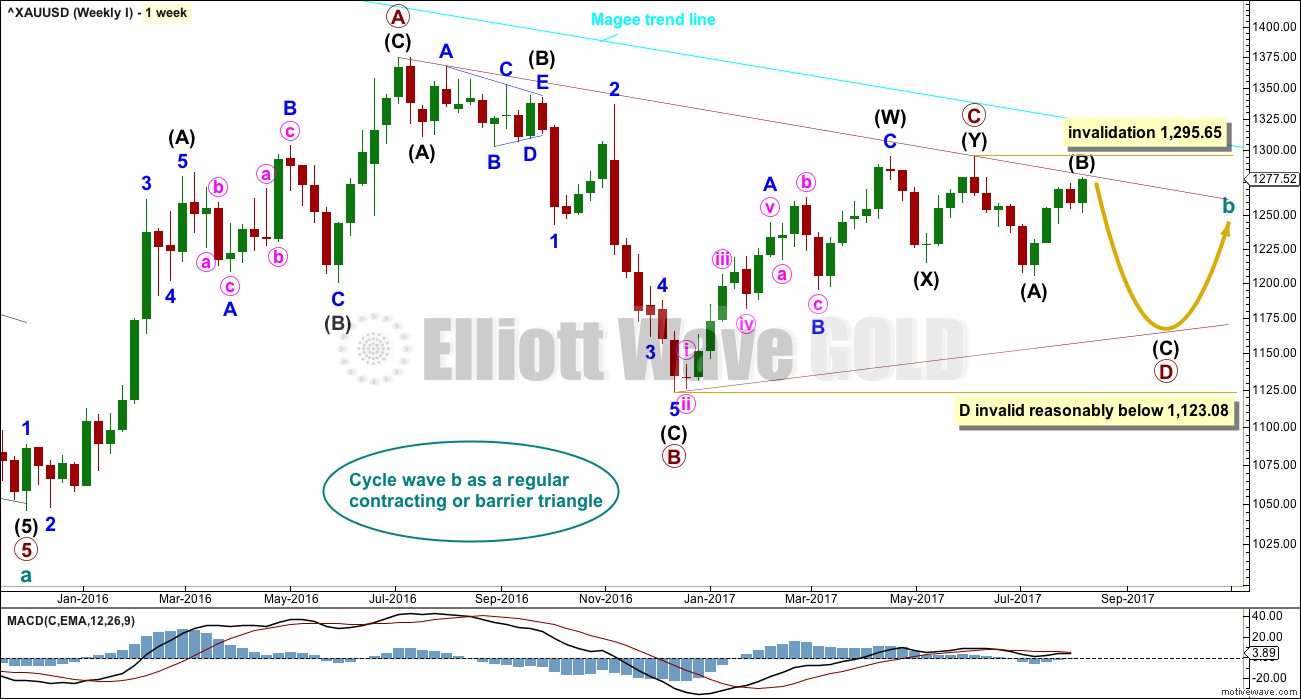
The Magee bear market trend line is added to the weekly charts. This cyan line is drawn from the all time high for Gold on the 6th of September, 2011, to the first major swing high within the following bear market on the 5th of October, 2012. This line should provide strong resistance.
At this stage, a triangle still looks possible and has the best fit for cycle wave b. It has some support from declining ATR and MACD now beginning to hover about zero.
Within a triangle, one sub-wave should be a more complicated multiple, which may be primary wave C. This is the most common sub-wave of the triangle to subdivide into a multiple.
Primary wave D of a contracting triangle may not move beyond the end of primary wave B below 1,123.08. Contracting triangles are the most common variety.
Primary wave D of a barrier triangle should end about the same level as primary wave B at 1,123.08, so that the B-D trend line remains essentially flat. This involves some subjectivity; price may move slightly below 1,123.08 and the triangle wave count may remain valid. This is the only Elliott wave rule which is not black and white.
Triangles normally adhere very well to their trend lines. So far the A-C trend line has been tested 11 times; this line has very strong technical significance. If this wave count is correct, then intermediate wave (B) may have ended just short of this trend line, finding strong resistance just below it.
Finally, primary wave E of a contracting or barrier triangle may not move beyond the end of primary wave C above 1,295.65. Primary wave E would most likely fall short of the A-C trend line. But if it does not end there, then it can slightly overshoot that trend line.
Primary wave A lasted 31 weeks, primary wave B lasted 23 weeks, and primary wave C may have been complete in 25 weeks.
Primary wave D should now be expected to last a Fibonacci 13 or 21 weeks in total. It has now lasted 8 weeks, so a further 5 weeks minimum would now be expected.
DAILY CHART
Click chart to enlarge.
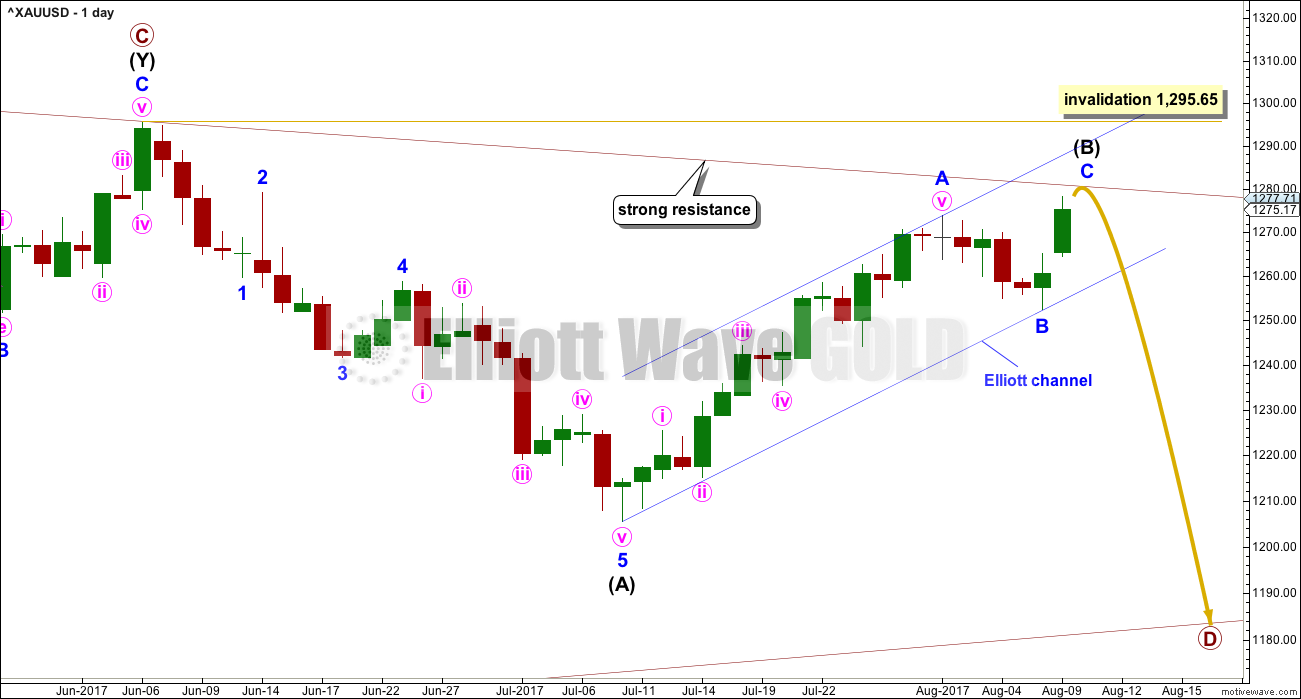
Intermediate wave (B) may be continuing higher to find resistance at the maroon A-C trend line. Triangles normally adhere very well to their trend lines; it is common for triangle sub-waves to test the triangle trend lines. There is a little room for further upwards movement before price touches the trend line.
If this wave count is correct, then intermediate wave (B) should be over within the next 24 hours.
Redraw the trend channel about the continuing zigzag of intermediate wave (B). When price breaks below the lower edge, that may be taken as an indication that intermediate wave (B) may be over and intermediate wave (C) may be underway.
HOURLY CHART
Click chart to enlarge.
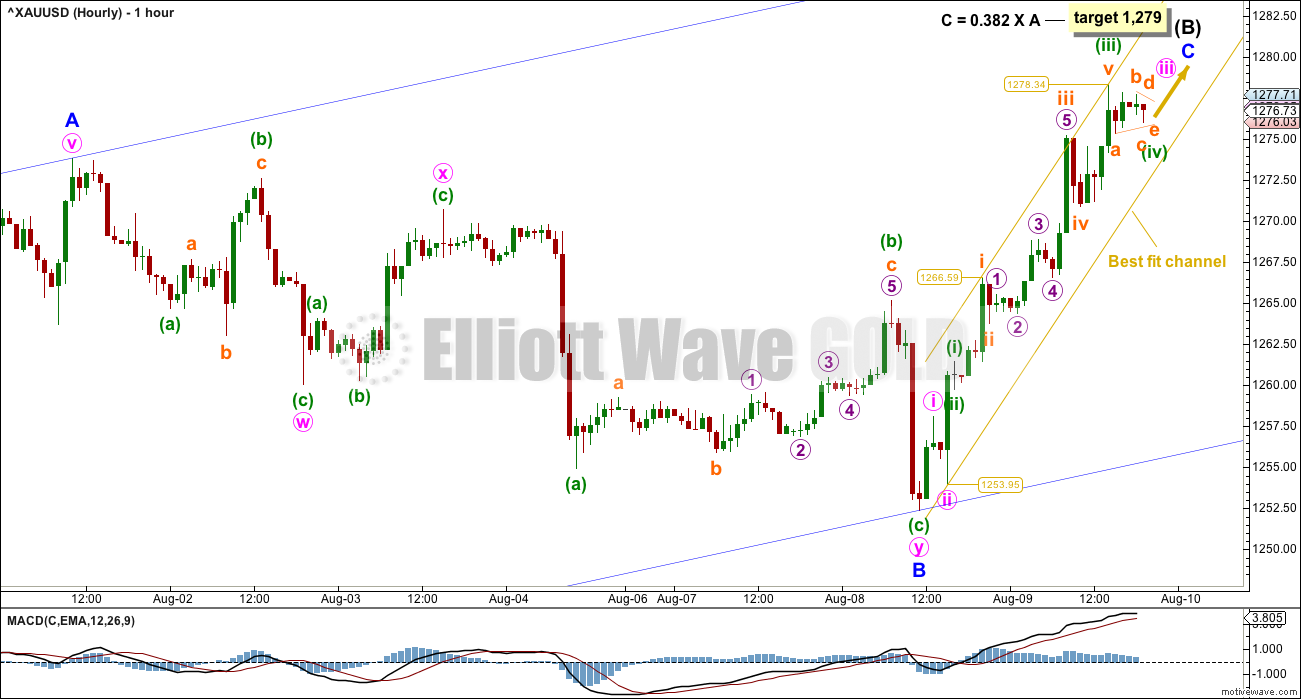
Upwards movement could only be a continuation of intermediate wave (B) if the larger premise for this wave count, a large triangle, is correct.
The target assumes a Fibonacci ratio between minor waves A and C. If the target is wrong, it may be a little too low. Minor wave C may move higher to find resistance at the maroon trend line on the daily chart. There may not be a Fibonacci ratio exhibited between minor waves A and C.
A best fit channel is drawn about minor wave C and anchor points are given for the channel. If downwards movement clearly breaches this channel, it may be taken as the earliest indication that intermediate wave (B) may again be over.
A breach of the wider blue channel by downwards movement would be a stronger indication that intermediate wave (B) may be over.
After trying various different ways of labelling minor wave C, my conclusion at this time is minute waves iii and iv are most likely incomplete. This labelling meets all Elliott wave rules and fits with momentum.
ALTERNATE ELLIOTT WAVE COUNT
WEEKLY CHART
Click chart to enlarge.
This wave count has been published only in historical analysis. At this stage, it will be published on a daily basis.
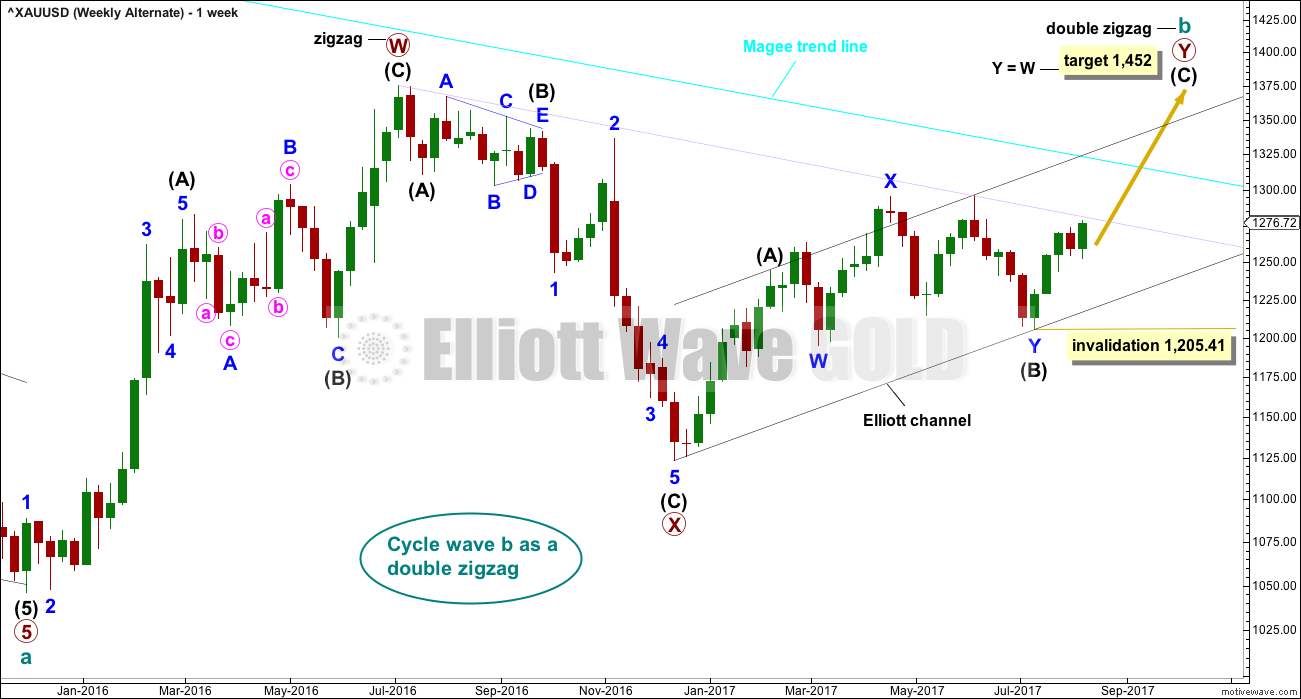
There are more than 23 possible corrective structures that B waves may take, and although cycle wave b fits best at this stage as a triangle (main wave count), it may still be another structure. This wave count looks at the possibility that it may be a double zigzag.
If cycle wave b is a double zigzag, then current upwards movement may be part of the second zigzag in the double, labelled primary wave Y.
The target remains the same as previously published for this wave count.
Along the way up, some resistance should be expected at the cyan Magee trend line.
Within intermediate wave (C), no second wave correction may move beyond the start of its first wave below 1,205.41.
DAILY CHART
Click chart to enlarge.
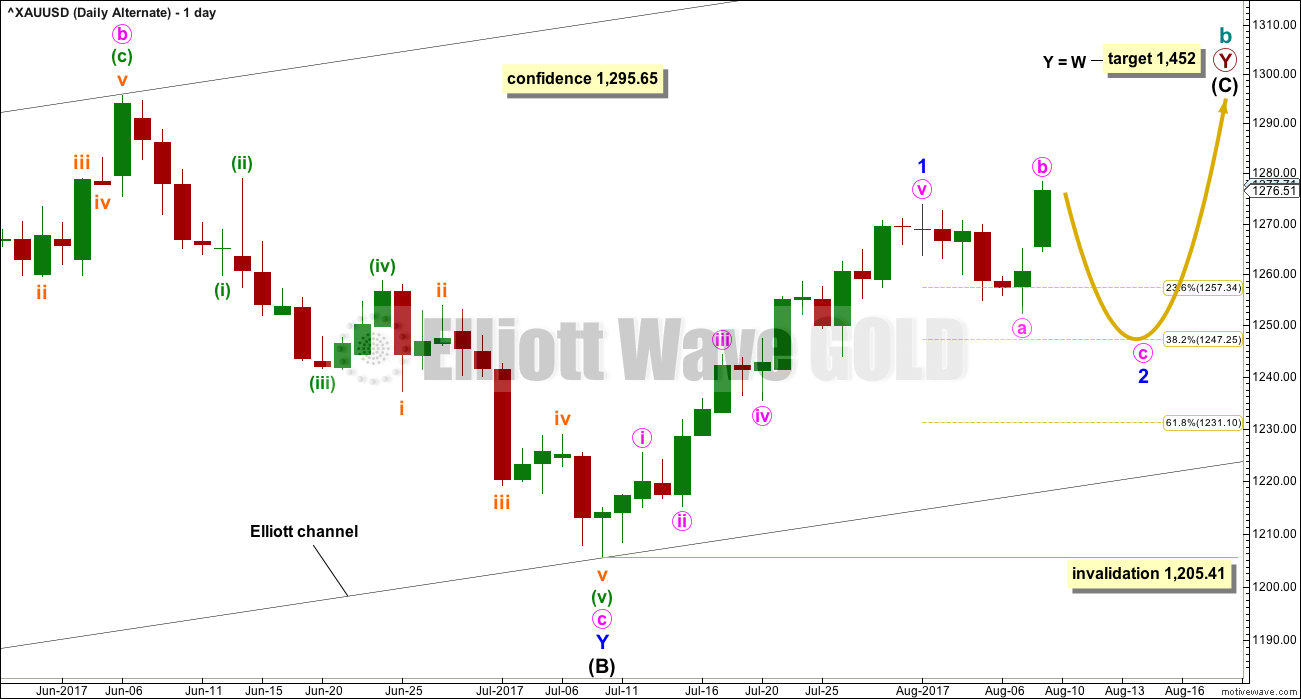
Intermediate wave (C) may be unfolding as an impulse.
Only minor wave 1 may have been over at the last high. Minor wave 2 may have begun. Minor wave 2 today may be continuing further as an expanded flat correction. It would be possible to label it over at the last low, but that would see minor wave 2 remarkably brief and shallow. It would have better proportion and be of more normal depth if it continued as a very common expanded flat.
Minor wave 2 may not move beyond the start of minor wave 1 below 1,205.41.
HOURLY CHART
Click chart to enlarge.
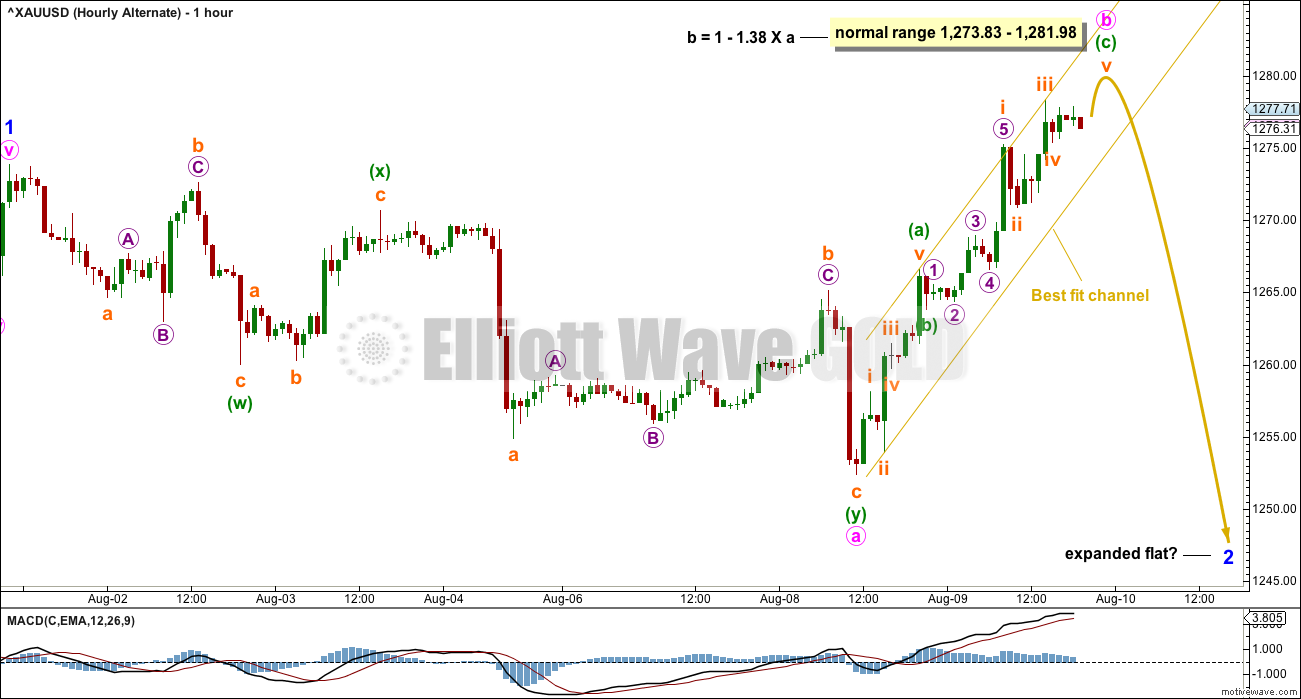
A new high above the end of minor wave 1 at 1,273.83 indicates the last wave down cannot be a five, so it must be a three. It will fit well as a double zigzag, which is classified as a three.
Minor wave 2 may be continuing as an expanded flat subdividing 3-3-5.
Minute wave b may be incomplete and may end within the normal range calculated here for B waves of flat corrections.
When minute wave b is over, then the ratio between minute waves a and c may be used to calculate a target for minor wave 2 to end. If the calculation coincides with one of the Fibonacci ratios of minor wave 1, then it would create a target zone with a good probability.
TECHNICAL ANALYSIS
WEEKLY CHART
Click chart to enlarge. Chart courtesy of StockCharts.com.
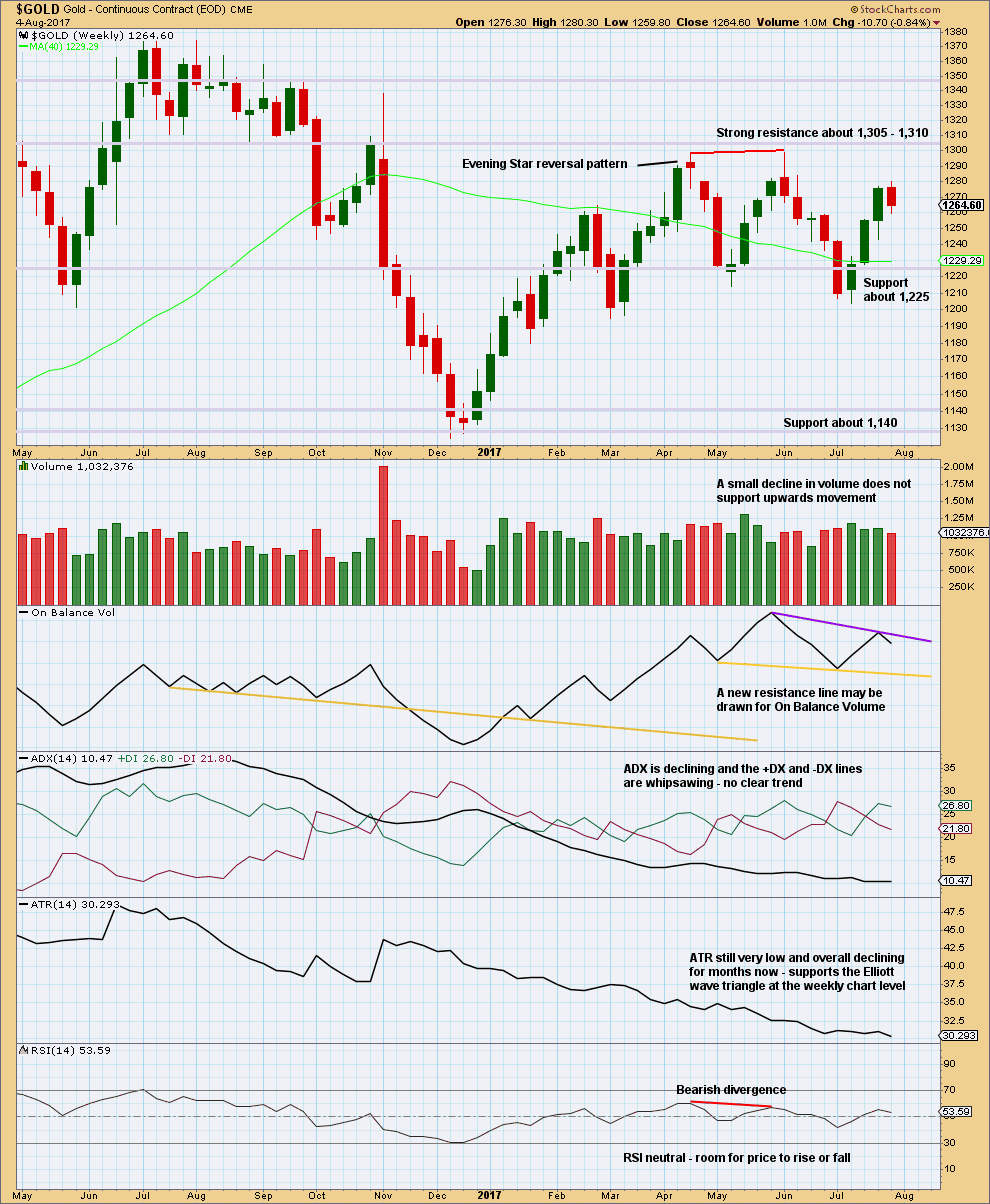
An upwards week closes with a red weekly candlestick.
To correctly analyse volume for this week it should be done at the daily chart level, to look “inside” the week.
On Balance Volume gives no signal. It is constrained.
ADX and ATR both support the main weekly Elliott wave count. This is what a triangle should look like.
DAILY CHART
Click chart to enlarge. Chart courtesy of StockCharts.com.
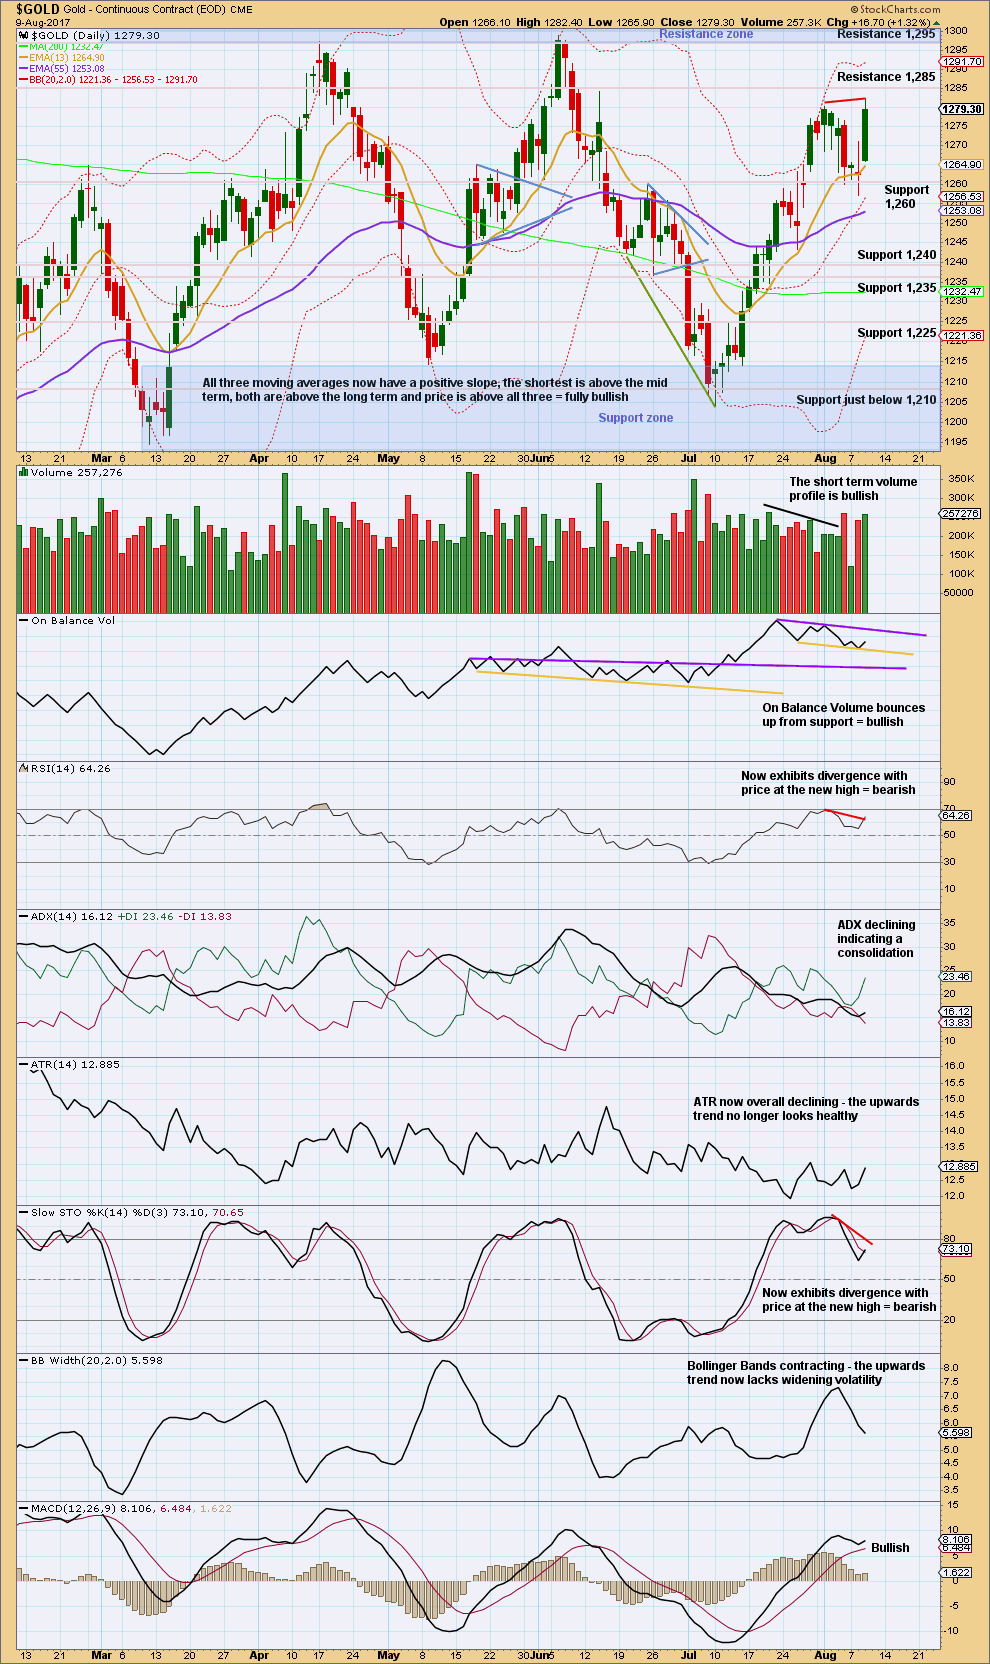
Stepping back and looking at the larger consolidation, Gold moved into a range back in February this year, delineated by support and resistance zones. During this consolidation, it is two upwards days of 7th of April and the 17th of May that have strongest volume. This suggests an upwards breakout is more likely than downwards, and it supports the alternate Elliott wave count and not the main Elliott wave count.
However, this signal is not a strong one. The third strongest day of the 18th of May is a downwards day, and it is very close in volume to the two upwards days.
Bullishness in the long lower candlesticks wicks has now been followed by a strong upwards day, and in hindsight now looks prescient.
The new high today comes with bearish divergence between price and RSI, and Stochastics.
A new resistance line is drawn for On Balance Volume.
Volume today supports upwards movement, but volume remains lighter than the prior downwards day of the 5th of August.
In the short term, this chart has some bullishness. Look for resistance now about 1,285. If divergence between price and RSI and Stochastics persists for another one or two days, then the view short term would change to bearish.
GDX
DAILY CHART
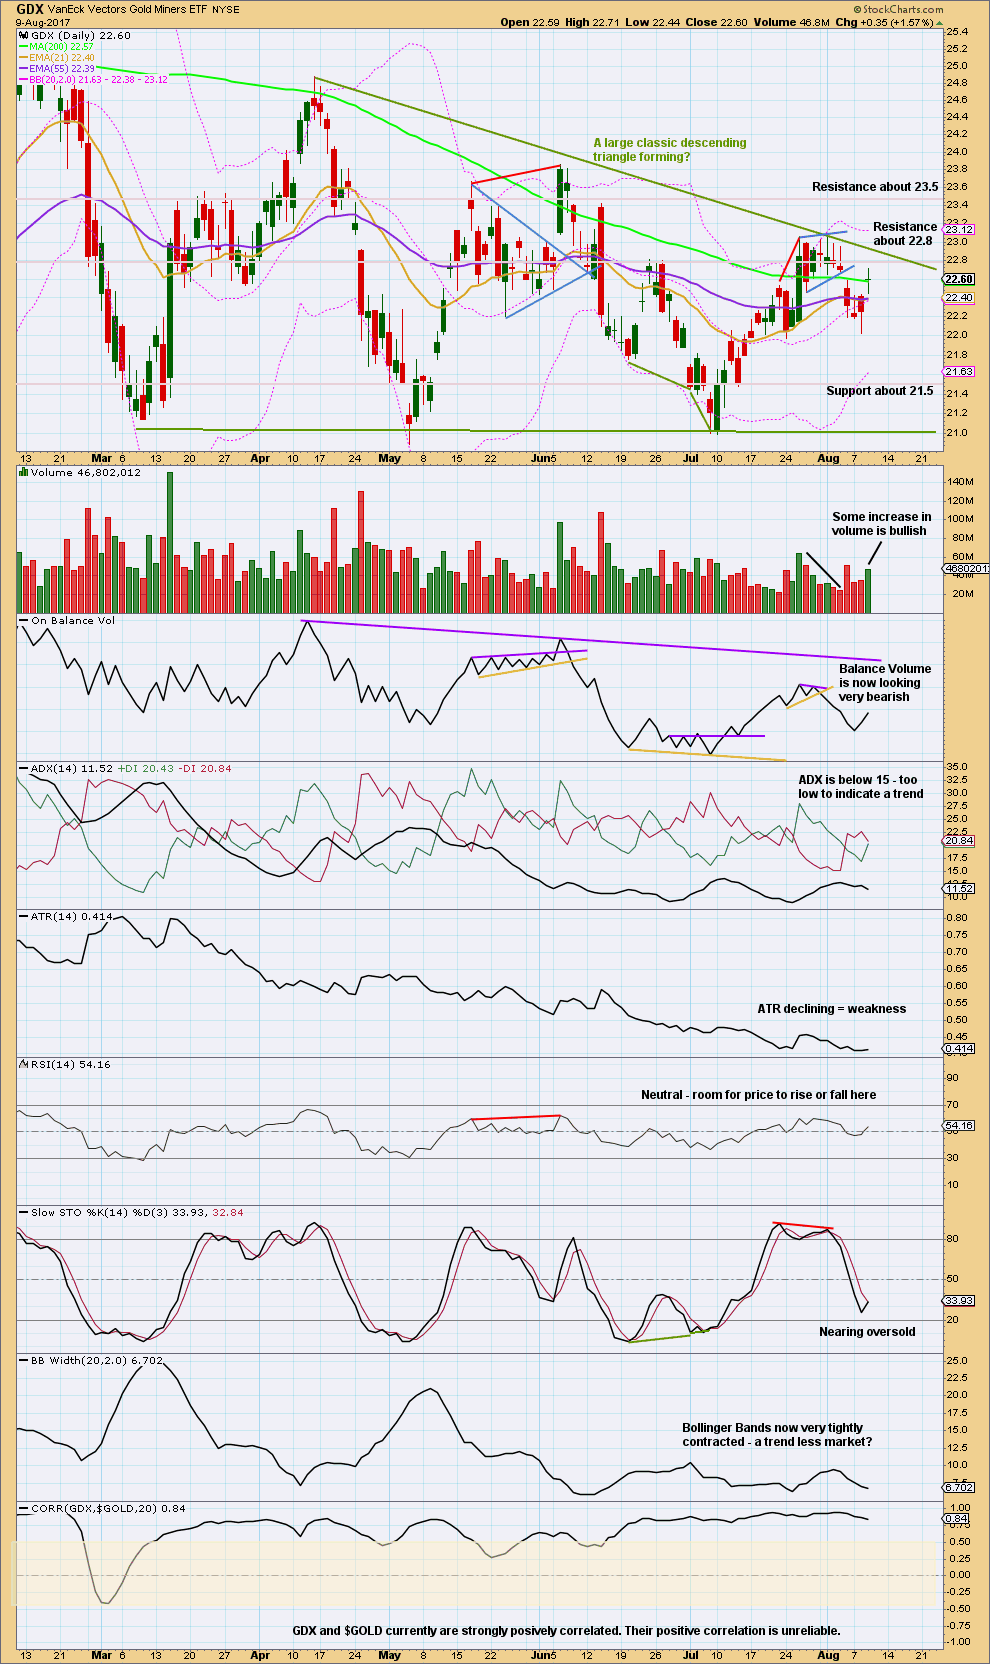
Click chart to enlarge. Chart courtesy of StockCharts.com.
Stepping back for GDX too, to look at the past six months, a large descending triangle looks like it has formed and may be close to a breakout. Breakouts from descending triangles are usually downwards.
During this structure though it is an upwards day for the 15th of March that has strongest volume suggesting an upwards breakout may be more likely than downwards. This signal is also not a strong one for GDX. The next two strongest days are both downwards and both very strong.
The last gap is closed, so it cannot be a breakaway gap. It now looks like a pattern gap.
The bullishness of yesterday’s long lower wick is now followed by an upwards day with support from volume. The doji today puts the trend into neutral for the short term.
Neither Stochastics nor RSI are oversold; there is room for price to fall further.
Published @ 08:40 p.m. EST.
Each 5 minute up candle being sold.
Now a dogi, this is the moment folks.
For the main count Gold has to turn now. It’s overshot the A-C trend line, so now it must turn.
If price keeps going up here the main count could see primary C moving higher as a double zigzag, maybe up to the Magee trend line. Primary wave C would still be a double zigzag, intermediate (X) within it would be a regular flat.
This is the moment of truth for gold.
Will it break through resistance, or finally show everyone that it’s overvalued?
$1,295.65 has held, main still valid.
Very strong resistance overhead.
Be careful Bulls, take some profits.
missed some of my stops by pennies. But it does look it’s bull flagging again, and market weakness may not be done with. It may be a case where you have to sell the breakout if it happens in next day or so. No way to predict what will happen at this juncture. Stops are key
We need follow trump mood
That’s a good one. Thanks for sharing.
Hilarious 🙂
Think we may have topped, yen seems to have bottomed.
N Korea vs US is just a nice excuse (fundamental reason) for jack up gold price. Personally, I think gold is more like an inflation hedge vehicle. My thinking is 99.9% the US won’t start a war against N Korea. Look back to the recent history, US had never started any wars against any countries have nuclear weapons. UN persuaded Syria gave up developing nuclear then… There’s no way N Korea would attack US then could survive from the consequences. Trump wanted to use N Korea news to cover his overwhelmed Russian scandles. I’m not sure N Korea’s hidden agendas…
Absolutely brilliant with a high of 1287+ already… Imo 1278-77 will now likely hold on a throwback (if there is one) for a drive through 1296; Gold price currently appears to be basing off 1284-83 with no signs of let up grrrrr ease up bulls! A fun day really.
indeed! I’m still very concerned about gold stock relative weakness. For the moment i’m going to excuse them and attribute it to market selloff, which they are a part of. But my stops remain aggressive until the gold stocks show some excitement. After all, we are at major major resistance
Hi Eli. Agree with you. Caution is the way forward. As a rogue trader I learnt the hard way, technical jurisprudence dictates it is always wise to begin to take money off the table when price begins to hit the band and/or use tight stops incase price is seen riding the band. The success of such a trade is probably only 3% lol… Anyhow, a rising ADX suggest continuation although high RSI readings on the hourly, 4-hourly and daily are probably warning of a reversal in the making; wouldn’t rule out 1301-02 just yet. Lets see. Have a fine day and a profitable trade! GL everyone… 🙂
i sold 1/6 of my long position earlier as an offering to the profit gods. I hope they are pleased and bless us. lol gl as well
Last week silver hourly inv HnS was anticipated. This pattern has been confirmed today with silver BO above 16.92.
Also a break down of Gold to silver (GSR) ratio below 75 is indicative of gold going higher.
YEN and Swiss Franc are also bullish warning gold is moving higher.
GDX stuck to the plan today, gapping up and then spending the day with mostly sideways movement filling the gap created 3 days ago. This created another big gap. Volume increased slightly, supporting the move up. Overall though, GDX is weaker than gold as gold made a new high and GDX did not.
So with all the frontline news, what’s the plan?
Until price tells me that the EW count needs to change, I’m sticking with my weekly count. Minuette wave 2 up may be complete, but there is room for it to move up higher. 23.09 is the invalidation point. If gold doesn’t finish it’s move up overnight, then GDX may move higher.
Challenging times to trade. Good luck!
https://www.tradingview.com/x/0XLMA6O2/
Just thinking – Gold price has probably made the low for the day basing off 1275-1274 for a thrust through 1278 opens up 1286…. It often does not pay buying in to the upper band but then who is to say! lol GL all 🙂
Gold is looking a lot weaker than yesterday. Either we going to get one final thrust or we just had the high today, I believe.
Gold needs more “fire and fury” type statements from Trump. Otherwise, it’s all down from here.
This was published by the UK Daily Star 10 hours ago. It may not be reliable.
Already, North Korea has replied with a more defiant and provocative stance. Some ten hours ago, it has released a plan outlining a thermonuclear strike against 4 US cities: San Diego, Austin, Washington DC, and the islands of Hawaii. If this is followed up by real action, 1400 or even 1500 gold may become an instant reality.
I doubt if either side will back down at this juncture. If Trump could persuade the US military to mount a more pro-active approach, then things can get moving pretty quickly. My gut feeling is that with his repeated failures to get something through Congress, a North Korea war should find little resistance. Nobody wants to go down in history as being the man who “allowed” a nuclear devastation of America. The simulated plan had estimated a death toll of nearly half a million with a first strike. The reported fire power is twice the tonnage used in Hiroshima.