
More upwards movement was expected for Oil for the week. This is not what happened. A pullback remains just above the invalidation point on the main Elliott wave count.
Summary: While price remains above 46.86, it looks most likely that Oil may continue higher to reach just above 52.00.
In the short term, if price makes a new low below 46.86, then expect a new strong wave down has begun. Target 34.34.
The bigger picture for Oil is still bearish and has support from volume analysis.
New updates to this analysis are in bold.
MONTHLY ELLIOTT WAVE COUNT
Click chart to enlarge.
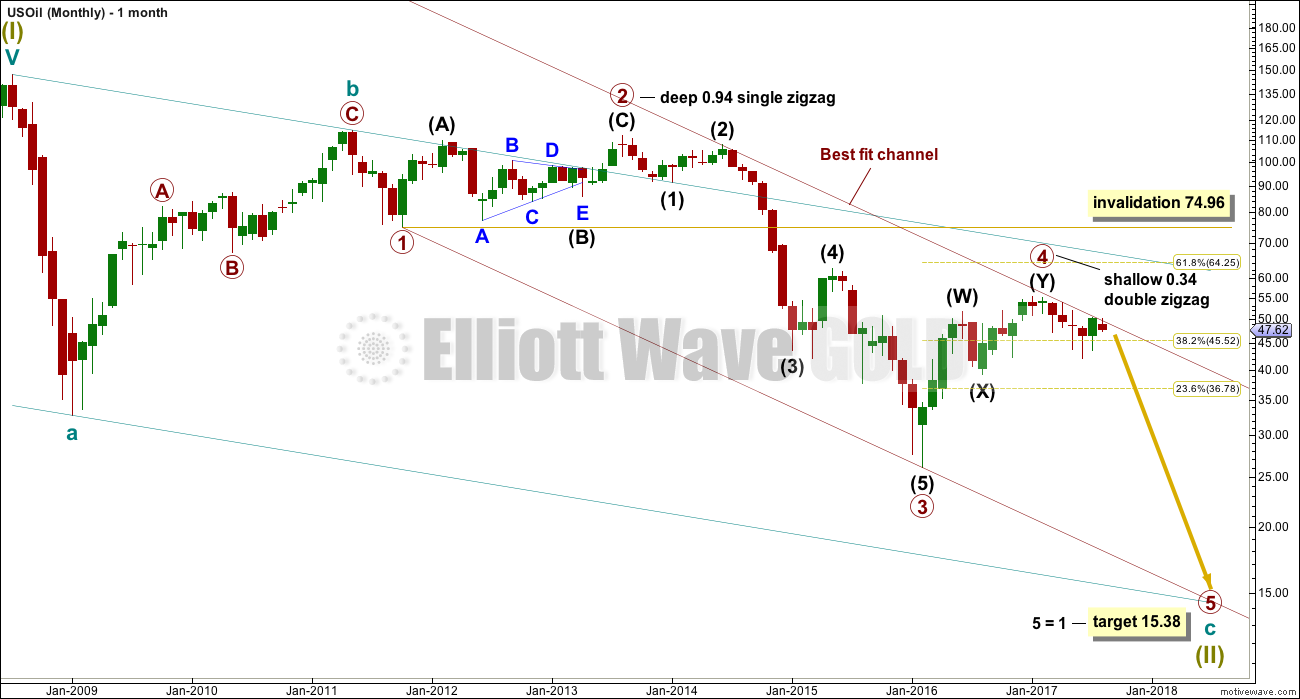
Within the bear market, cycle wave b is seen as ending in May 2011. Thereafter, a five wave structure downwards for cycle wave c begins.
Primary wave 1 is a short impulse lasting five months. Primary wave 2 is a very deep 0.94 zigzag lasting 22 months. Primary wave 3 is a complete impulse with no Fibonacci ratio to primary wave 1. It lasted 30 months.
There is alternation in depth with primary wave 2 very deep and primary wave 4 shallow. There is inadequate alternation in structure, both are of the zigzag family, but there is some alternation within structure. Primary wave 2 is a single zigzag and the triangle for intermediate wave (B) gives it a sideways look. Primary wave 4 is a sharper and quicker double zigzag.
If it continues, then primary wave 4 may not move into primary wave 1 price territory above 74.96.
WEEKLY ELLIOTT WAVE COUNT
Click chart to enlarge.
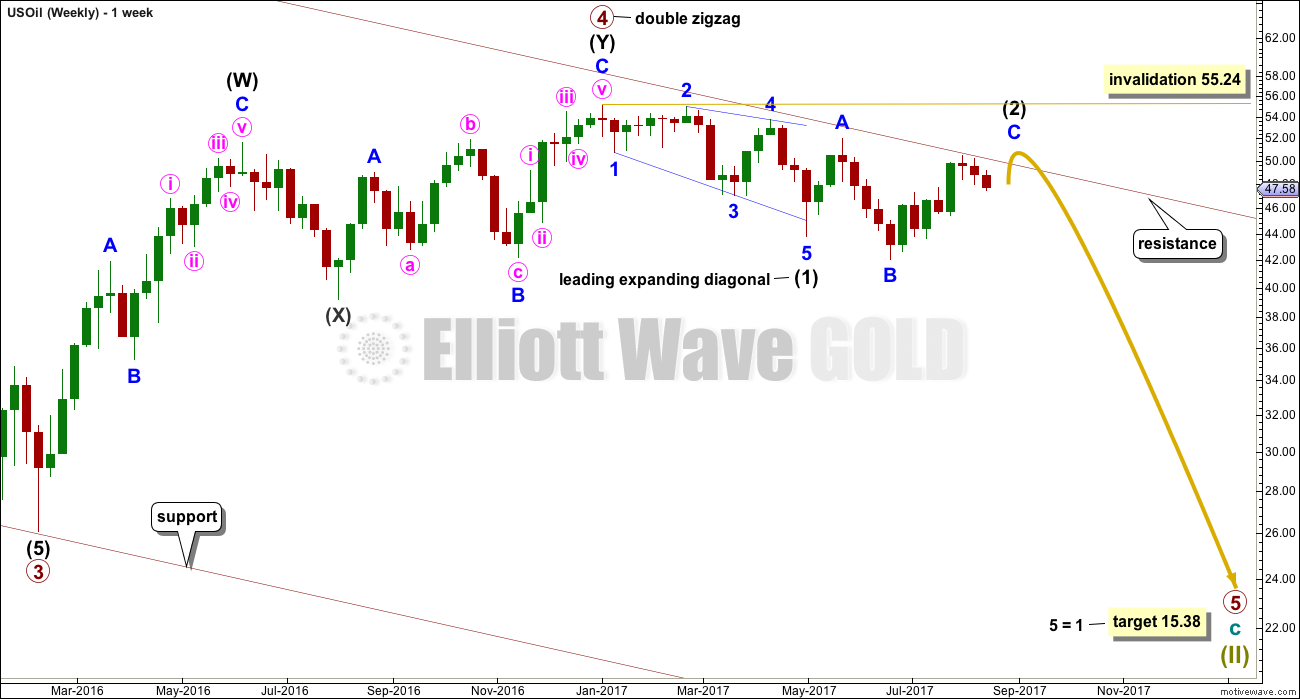
The wave sees primary wave 5 beginning with a leading diagonal for intermediate wave (1), and now a deep expanded flat for intermediate wave (2). This has good proportion, and fits at the daily chart level.
Intermediate wave (2) may not move beyond the start of intermediate wave (1) above 55.24.
This wave count would require an overshoot of the maroon channel for minor wave C of intermediate wave (2) to avoid a truncation. If that trend line provides resistance, then it may force intermediate wave (2) to be a rare running flat.
However, the rarity of running flats means an alternate idea should be considered below.
DAILY ELLIOTT WAVE COUNT
Click chart to enlarge.
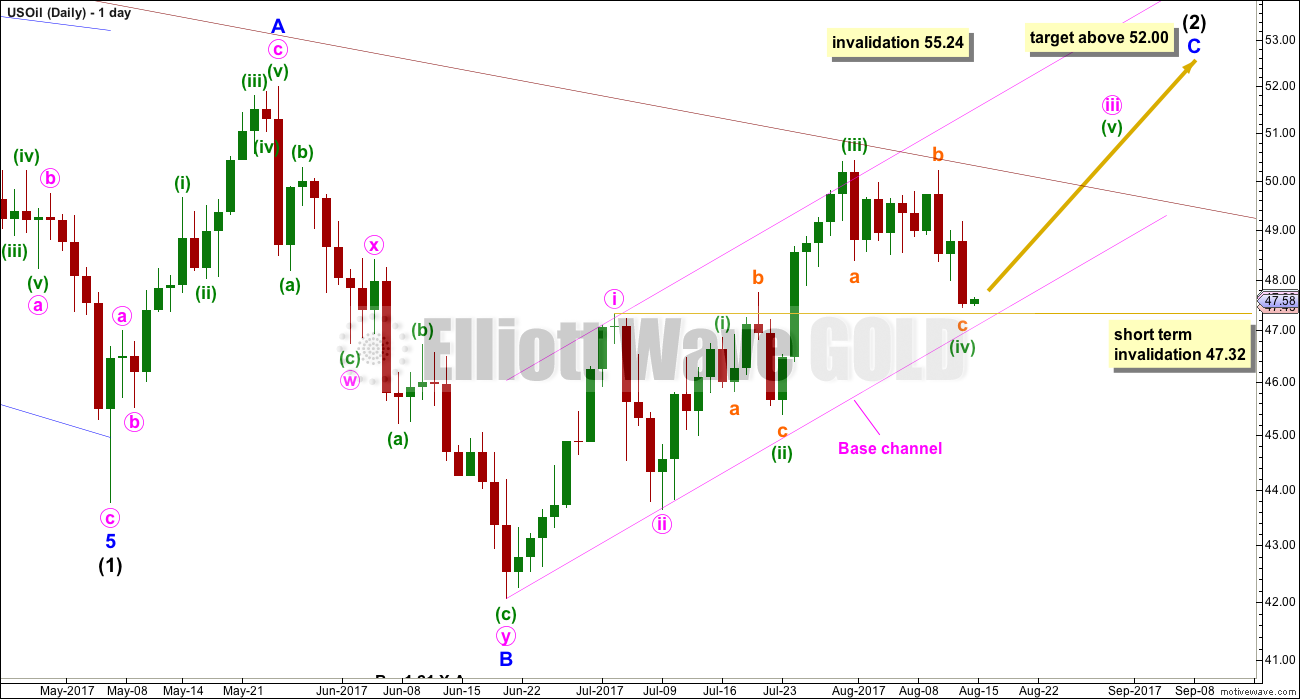
Leading diagonals in first wave positions are often followed by very deep second wave corrections. At its end, if intermediate wave (2) is an expanded flat, it would fit the description of very deep.
Minor wave C must move above the end of minor wave A at 52.00 to avoid a truncation. If it does not manage to do this, then intermediate wave (2) may be a rare running flat. Running flats can occur before very strong movements. If intermediate wave (2) completes as a running flat, then expect intermediate wave (3) to be very strong indeed.
Price is now very close to the upper edge of the maroon best fit channel, copied over from monthly and weekly charts. This trend line is so far providing very strong resistance. Price may not be able to be overcome it, so an alternate below is considered.
Minor wave C must subdivide as a five wave structure. At this stage, it looks like an incomplete impulse. Within minor wave C, minute wave iv may not move into minute wave i price territory below 47.32.
The base channel about minute waves i and ii so far contains all pullbacks. Lower degree second wave corrections should find support or resistance at base channels drawn about first and second waves one or more degrees higher. A third wave should have the power to break through the other side of the base channel. So far minute wave iii has not done that.
Minute wave iii must subdivide as an impulse. Within minute wave iii, there may be some alternation between an expanded flat for minuette wave (ii) and possibly a zigzag for minuette wave (iv). Minuette wave (iv) so far remains just above minuette wave (i) price territory at 46.86.
If price makes a new low below 46.86 in the next few days, use the alternate below.
ALTERNATE DAILY ELLIOTT WAVE COUNT
Click chart to enlarge.
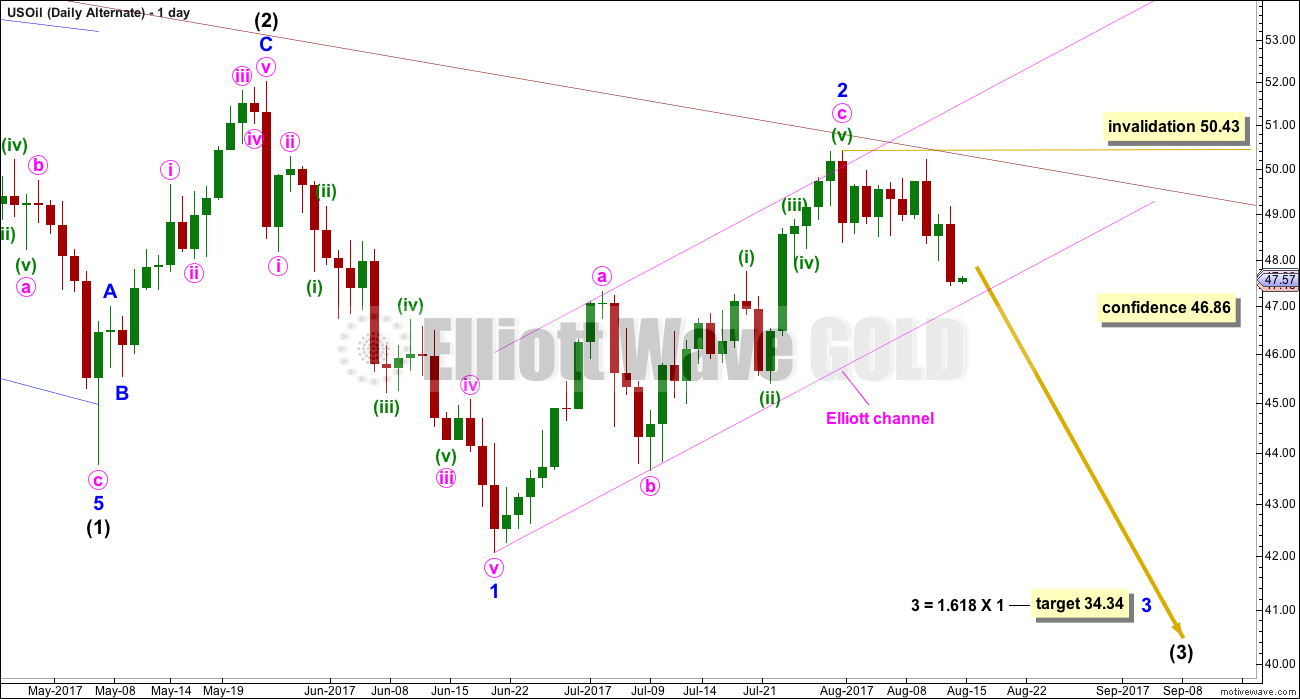
What if intermediate wave (2) was over and current upwards movement is another second wave correction? Would this idea look right?
Intermediate wave (2) would have been a 0.72 depth of intermediate wave (1), fitting the description of very deep and looking normal for a second wave correction following a first wave leading diagonal. Up to this point the wave count looks right.
However, the downwards wave of minor wave 1 does not have a good fit as an impulse. Within it the middle, the third wave, looks like a three.
Minor wave 2 at 29 sessions is just over twice the duration of intermediate wave (2) at 14 sessions. This disproportion does not leave the wave count with the right look.
This alternate is technically possible, but must be judged to have a lower probability than the main wave count.
TECHNICAL ANALYSIS
DAILY CHART
Click chart to enlarge. Chart courtesy of StockCharts.com.
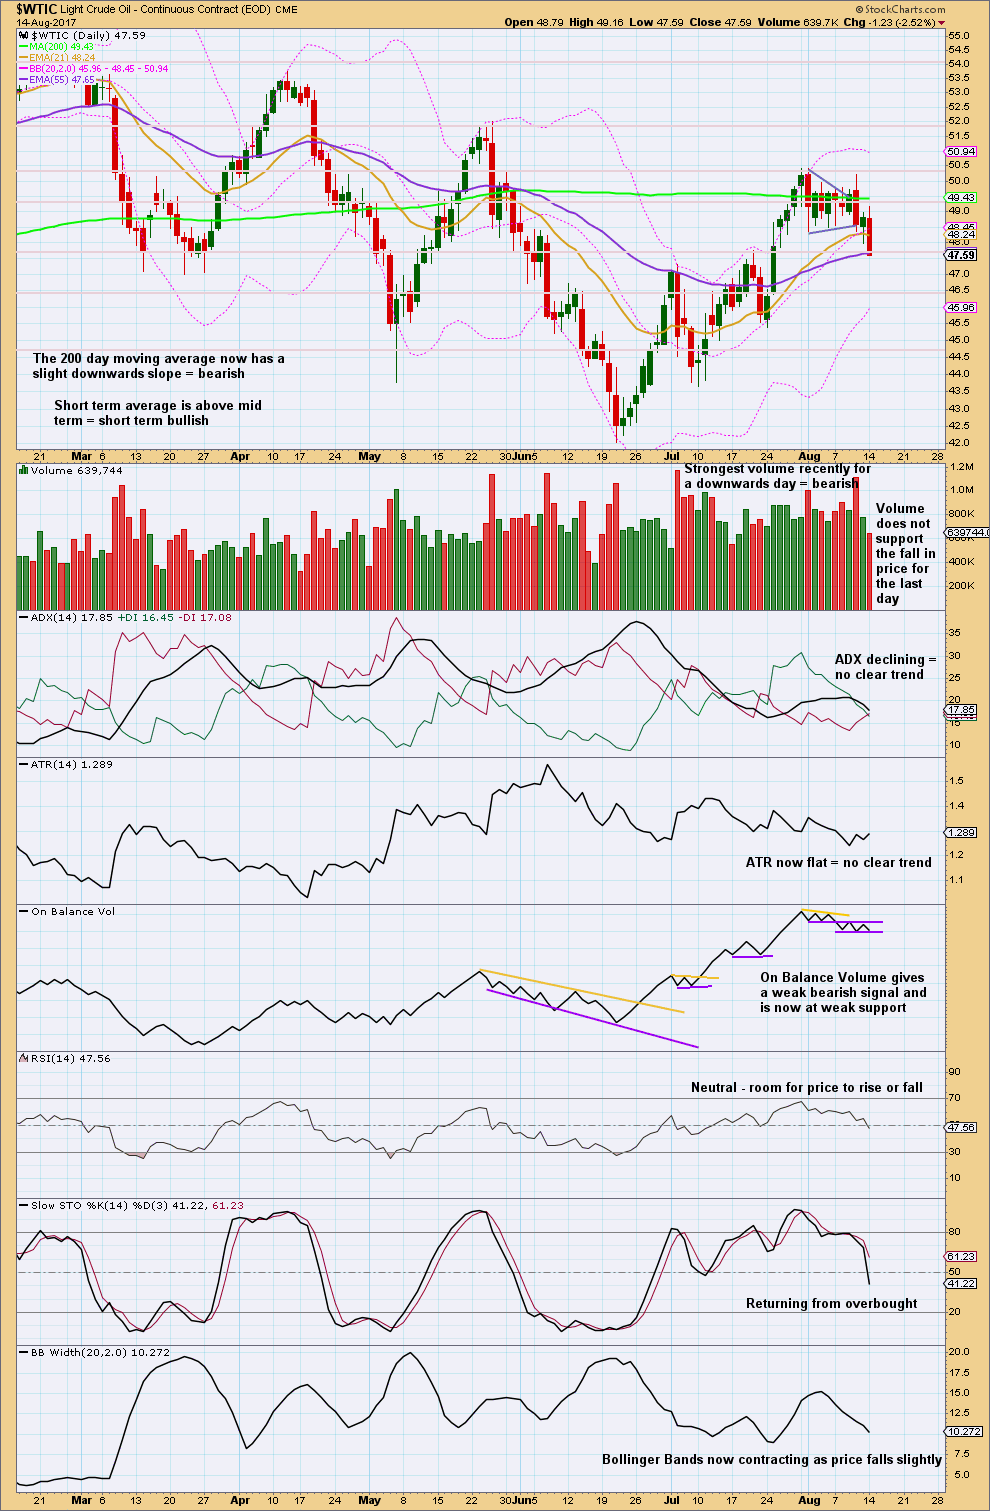
What looked like a small pennant pattern last week has failed. While these are one of the most reliable continuation patterns, they do not always work.
Recent days’ strongest volume is for downwards movement through the months of May to August. This strongly suggests that the larger trend is still down and upwards movement is still a counter trend movement. So far this year Oil has made a series of lower lows and lower highs, the definition of a downwards trend, although the bounces have been deep and time consuming.
For the very short term, it looks like price may be at support. The lack of support from volume for the last downwards day suggests new highs for the short term.
VOLATILITY INDEX
Click chart to enlarge. Chart courtesy of StockCharts.com.
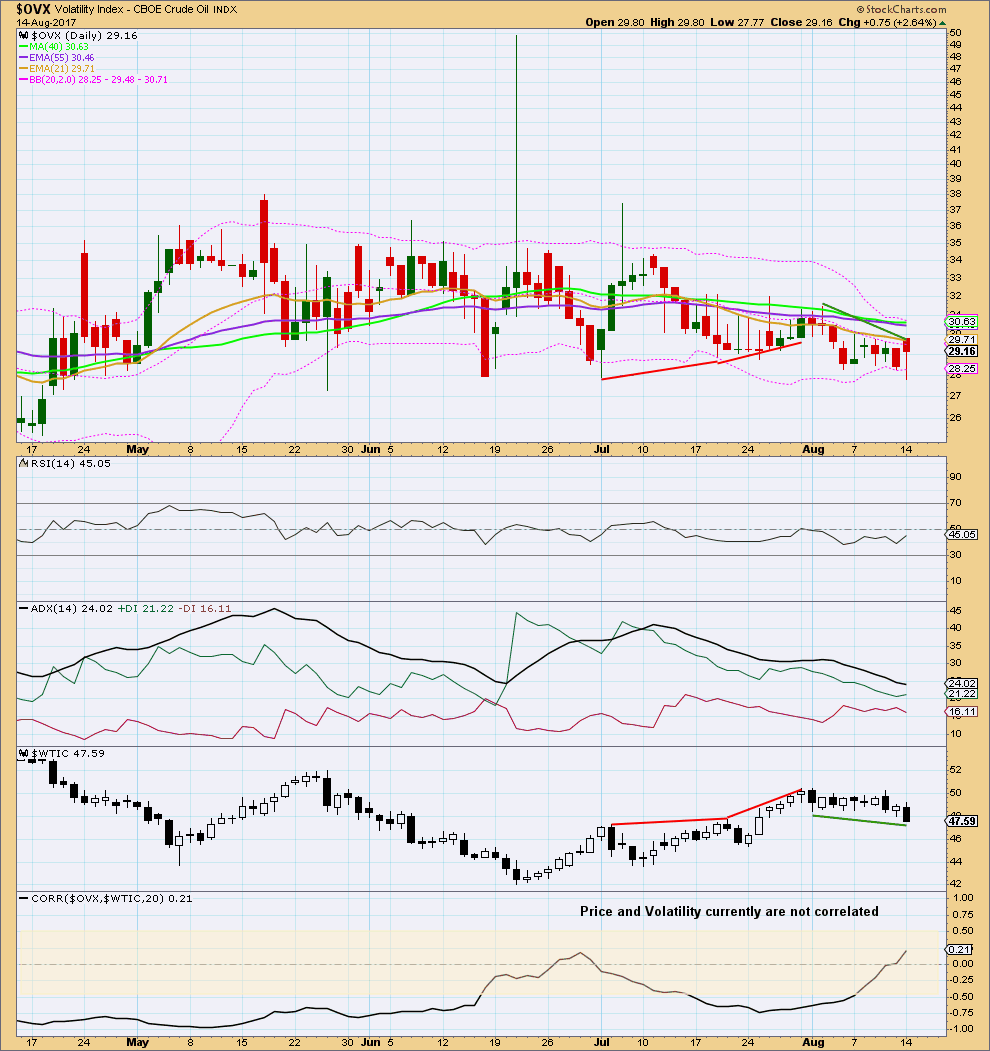
Normally, volatility should decline as price rises and volatility should increase as price falls. Divergence from this normal can provide a bullish or bearish signal for Oil. However, it is noted that this signal occurs both in minor and major lows and it cannot be used to distinguish between them.
Price is moving lower, but volatility is not showing an increase and instead is decreasing. This indicates some weakness within price, and is interpreted as bullish.
Published @ 08:56 p.m. EST.
Updated daily alternate chart:
The main count is invalid. This is the only count left. The channel about minor 2 is breached, todays green candlestick looks like a quick back test of that channel, finding resistance now.
If this count is right this is a perfect entry opportunity to ride the next wave down to the target.
Always always use a stop please. Technically here it needs to be just above the invalidation point, so a reasonable risk. Or put it just above the maroon trend line, slightly lower, today that would be about 50.00.
Invest only 1-5% of equity on any one trade. Manage risk, the most important aspect of trading.
We have breached Lara’s confidence point for a bear move.
Really? The alternate wave count seams to work, or what do you think?
I think the alternate is now the only one that makes sense.
I think that maroon trend line has again provided strong resistance.