
Last week’s analysis expected more downwards movement.
Summary: Expect a new strong wave down has begun. Target 34.34. Stops may be set just above the invalidation point at 50.22. Invest only 1-5% of equity on any one trade.
Look out for Oil to start falling strongly any day now.
The bigger picture for Oil is still bearish and has support from volume analysis.
New updates to this analysis are in bold.
MONTHLY ELLIOTT WAVE COUNT
Click chart to enlarge.
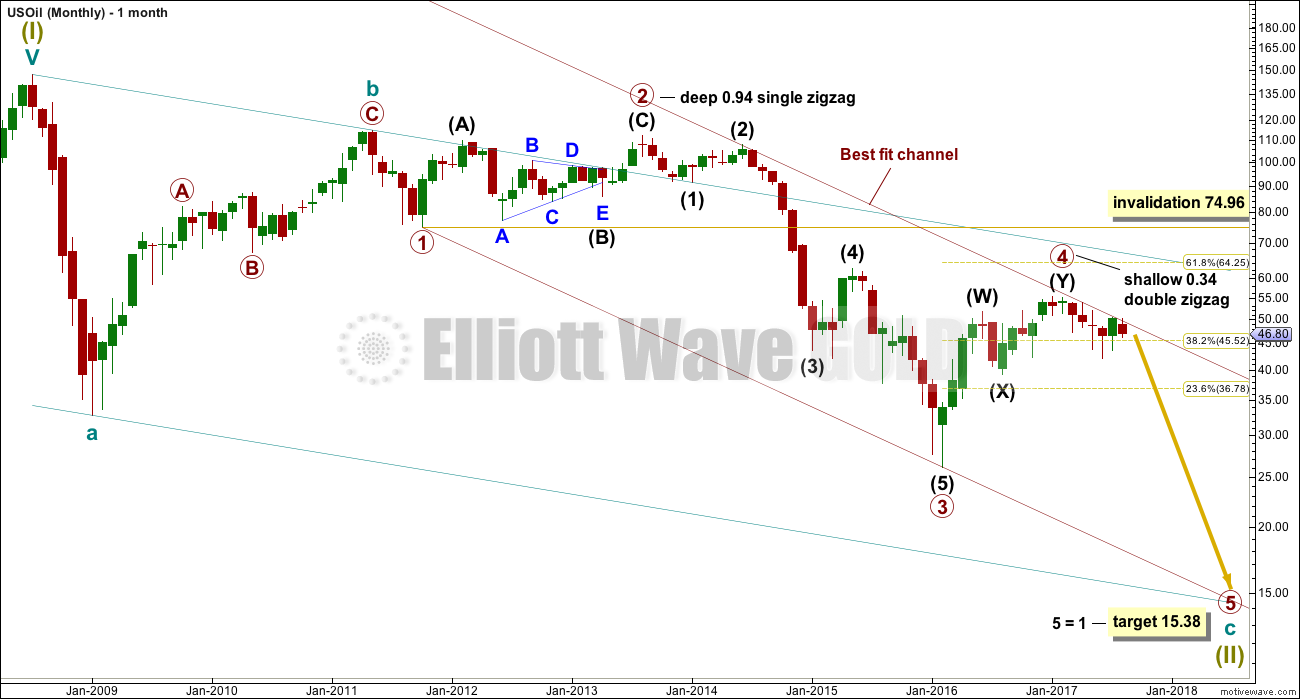
Within the bear market, cycle wave b is seen as ending in May 2011. Thereafter, a five wave structure downwards for cycle wave c begins.
Primary wave 1 is a short impulse lasting five months. Primary wave 2 is a very deep 0.94 zigzag lasting 22 months. Primary wave 3 is a complete impulse with no Fibonacci ratio to primary wave 1. It lasted 30 months.
There is alternation in depth with primary wave 2 very deep and primary wave 4 shallow. There is inadequate alternation in structure, both are of the zigzag family, but there is some alternation within structure. Primary wave 2 is a single zigzag and the triangle for intermediate wave (B) gives it a sideways look. Primary wave 4 is a sharper and quicker double zigzag.
If it continues, then primary wave 4 may not move into primary wave 1 price territory above 74.96.
WEEKLY ELLIOTT WAVE COUNT
Click chart to enlarge.
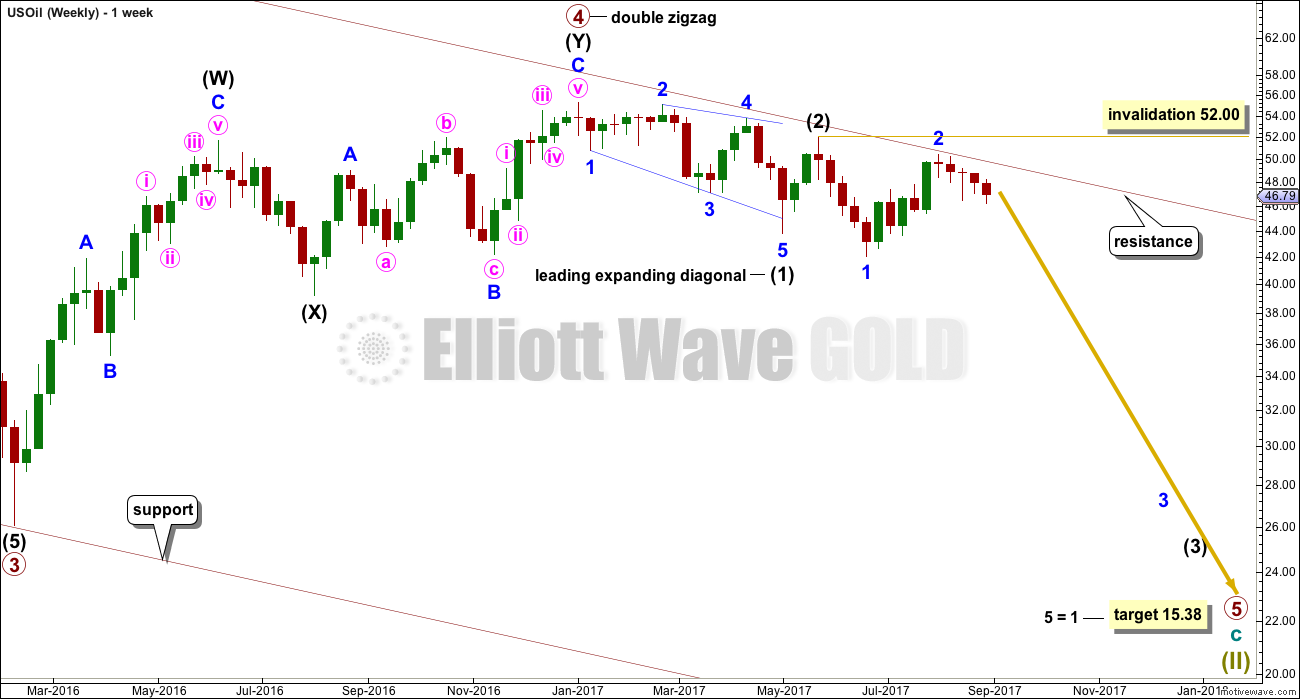
The wave count sees primary wave 5 beginning with a leading diagonal for intermediate wave (1), and now a deep expanded flat for intermediate wave (2). This has good proportion, and fits at the daily chart level.
Intermediate wave (2) may not move beyond the start of intermediate wave (1) above 55.24.
This wave count would require an overshoot of the maroon channel for minor wave C of intermediate wave (2) to avoid a truncation. If that trend line provides resistance, then it may force intermediate wave (2) to be a rare running flat.
However, the rarity of running flats means an alternate idea should be considered below.
DAILY ELLIOTT WAVE COUNT
Click chart to enlarge.
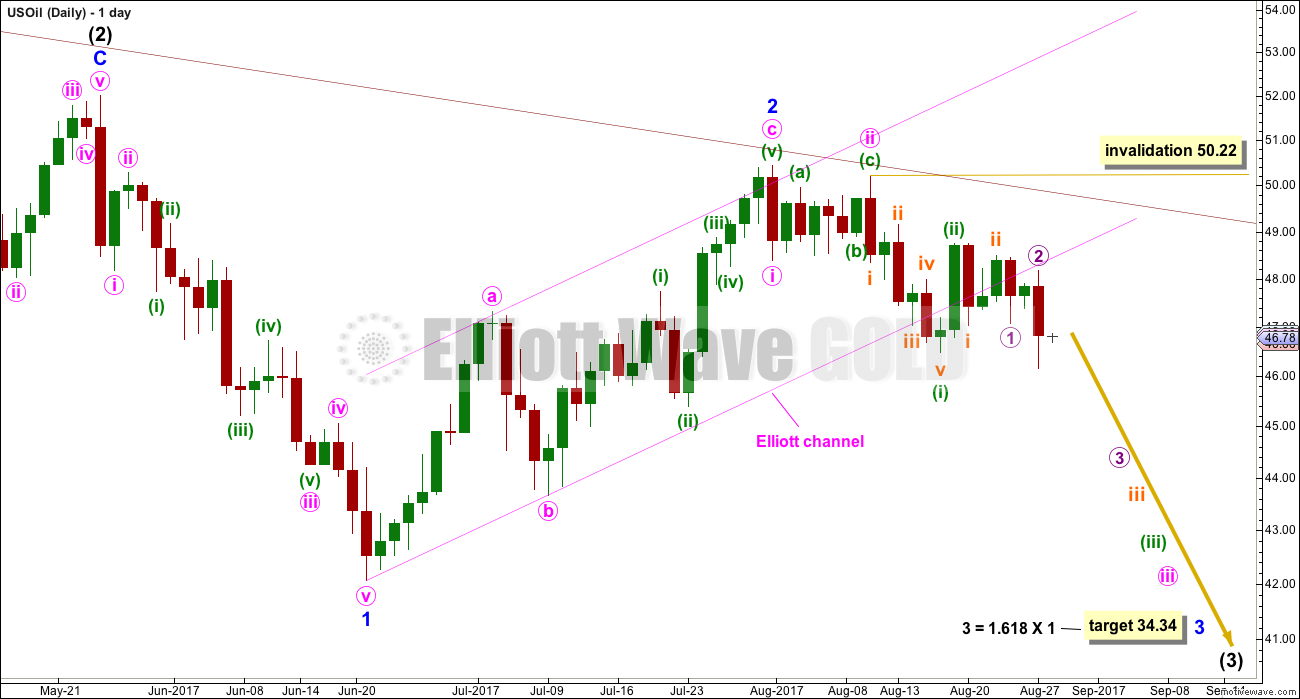
It looks like price is continuing to find very strong resistance at the upper maroon trend line, which is copied over from monthly and weekly charts.
Despite the disproportion between intermediate wave (2) and minor wave 2, this wave count does fit in terms of subdivisions.
Minuette wave (ii) may move higher for the short term, so that it looks like an obvious three wave structure when it is complete. Minuette wave (ii) may not move beyond the start of minuette wave (i) above 50.22.
It is also possible that minuette wave (ii) may be over. If so, downwards movement over the last week would be two more first and second waves complete.
This wave count expects to see a strong increase in downwards momentum in coming weeks.
TECHNICAL ANALYSIS
DAILY CHART
Click chart to enlarge. Chart courtesy of StockCharts.com.
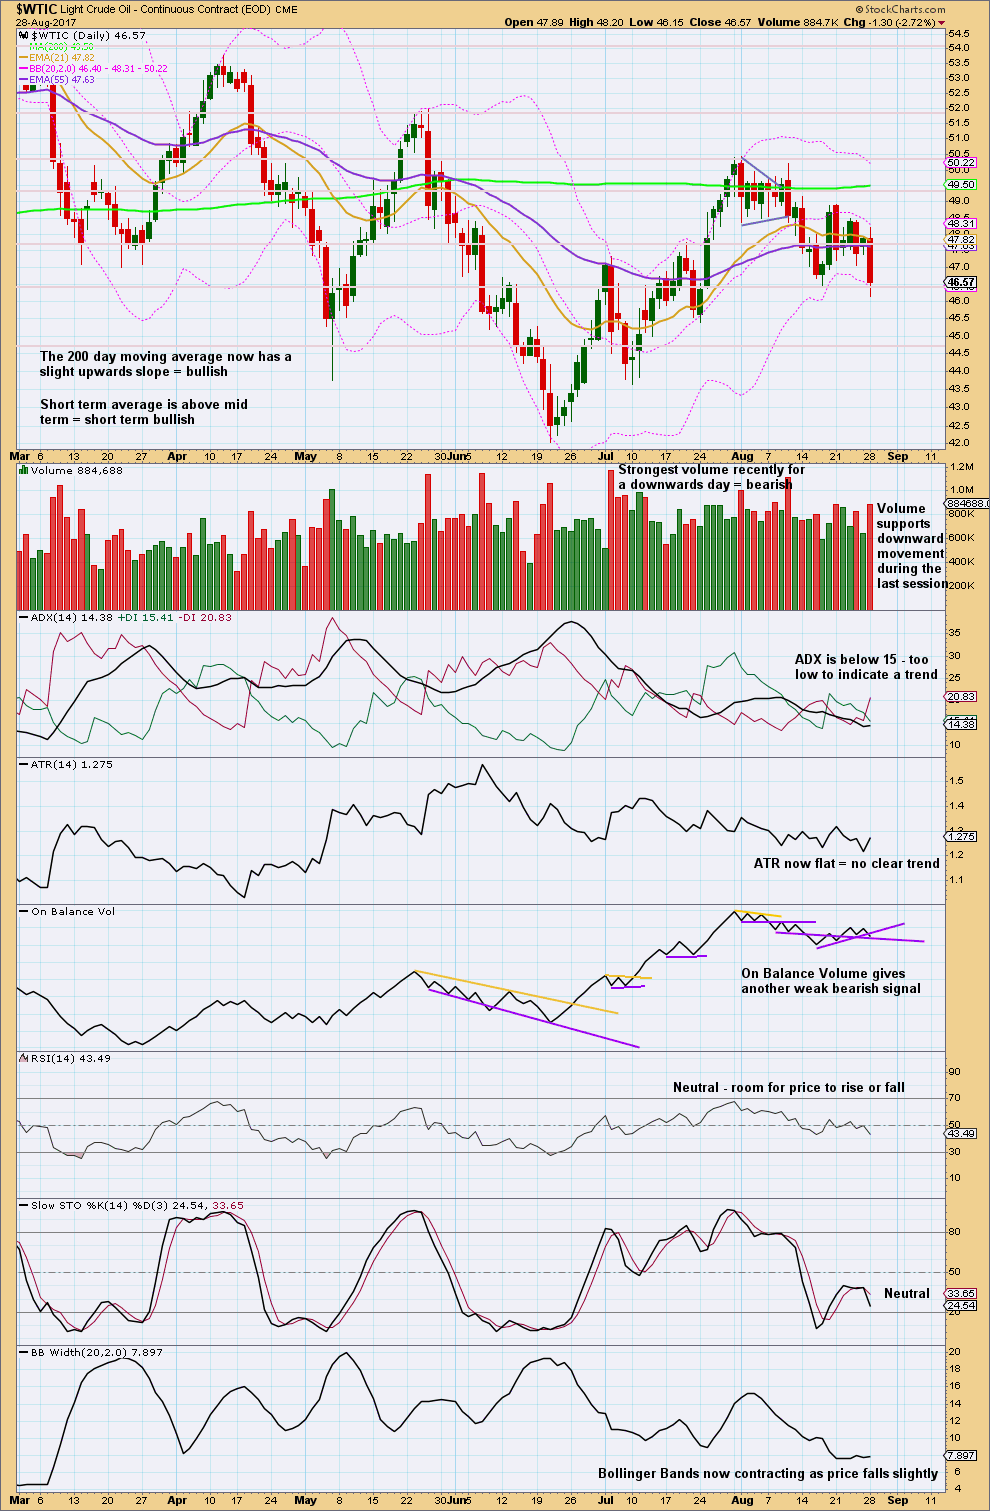
Recent days’ strongest volume is for downwards movement through the months of May to August. This strongly suggests that the larger trend is still down and upwards movement is still a counter trend movement. So far this year Oil has made a series of lower lows and lower highs, the definition of a downwards trend, although the bounces have been deep and time consuming.
The picture is still bearish for the short term. On Balance Volume continues to give bearish signals and volume continues to support downwards movement.
This analysis offers reasonable support for the Elliott wave count.
VOLATILITY INDEX
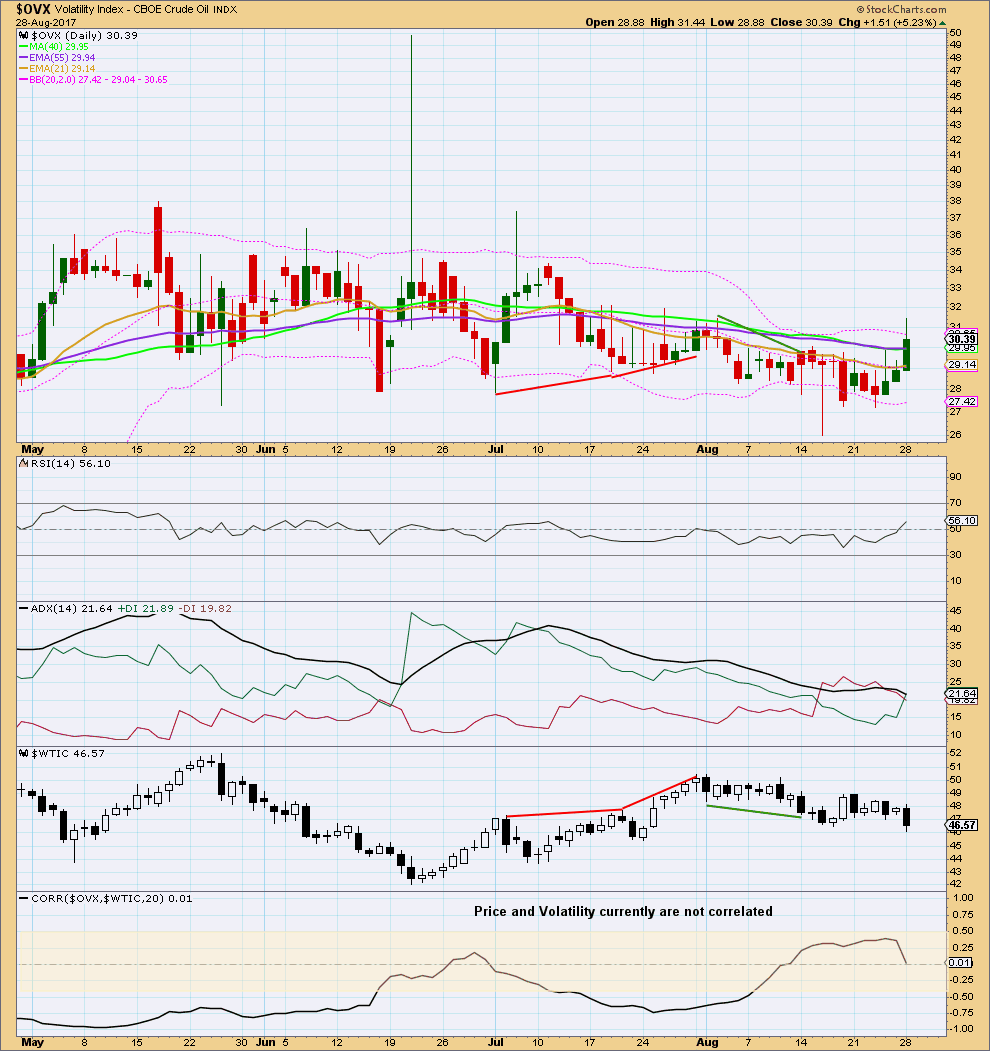
Click chart to enlarge. Chart courtesy of StockCharts.com.
Normally, volatility should decline as price rises and volatility should increase as price falls. Divergence from this normal can provide a bullish or bearish signal for Oil. However, it is noted that this signal occurs both in minor and major lows and it cannot be used to distinguish between them.
The new low in price for the 28th of August comes with a normal increase in volatility above the last swing high.
Published @ 12:20 a.m. EST.
Is WTI now going short again?
https://www.tradingview.com/chart/USOIL/QsJLqMyo-5-Reasons-to-Short-Crude/