
A consolidation was expected to pull price down to about 1,335. Downwards movement has unfolded mostly as expected, although price is moving in more of a straight line than was expected and has reached 10.30 below the target so far.
Summary: Expect overall sideways movement this week. In the short term, look out for a deep bounce for wave B within this correction; it may make a new high above 1,357.09. Use the small green Elliott channel on the hourly chart to indicate when the current wave down is over and the bounce has begun.
With the next bounce expected to be a B wave, it may not offer a good trading opportunity. B waves exhibit the greatest variety in structure and price behaviour; it may be a swift sharp bounce or a time consuming sideways chop. It is impossible to tell which it may be. Members are strongly advised to manage risk diligently if trying to trade this correction, or to step aside and exert patience at this time.
Always use a stop. Invest only 1-5% of equity on any one trade.
New updates to this analysis are in bold.
Last monthly charts for the main wave count are here, another monthly alternate is here, and video is here.
Grand SuperCycle analysis is here.
MAIN ELLIOTT WAVE COUNT
WEEKLY CHART
Click chart to enlarge.
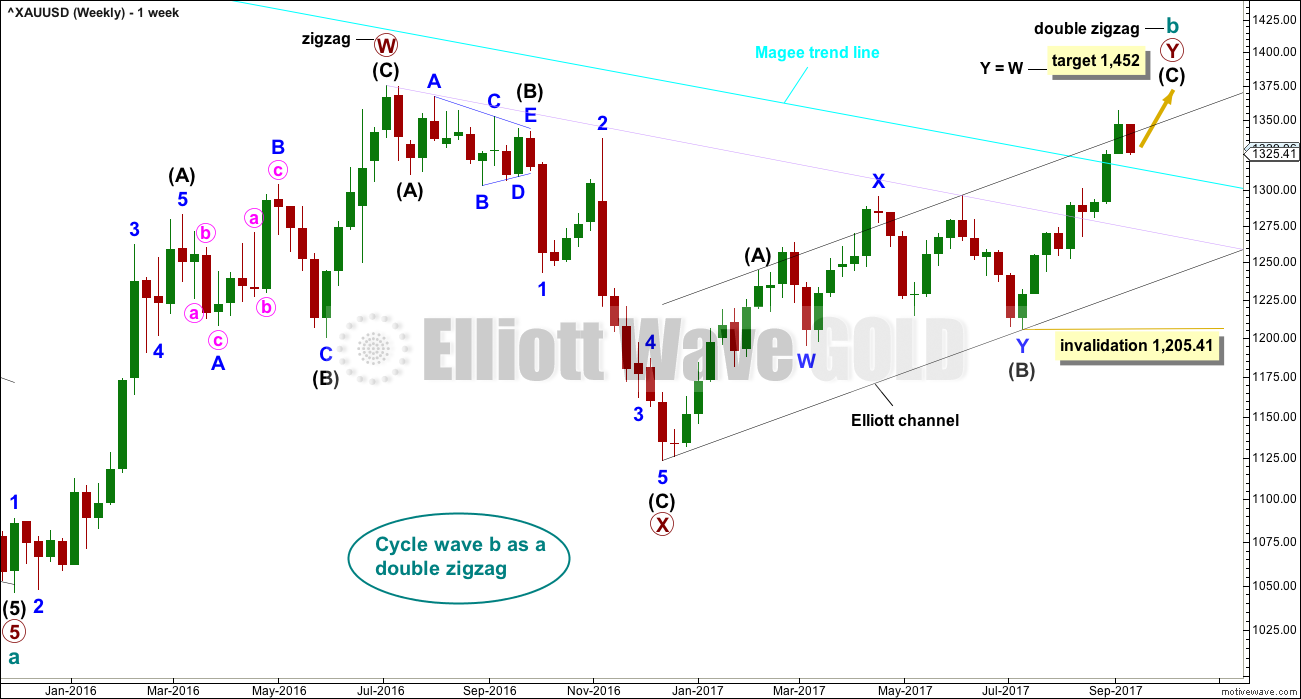
There is strong support from classic technical analysis for this wave count. Now that price has fully broken above the Magee trend line and has broken out above a consolidation zone, with support from volume, this wave count will now be the main wave count.
There are more than 23 possible corrective structures that B waves may take, and although cycle wave b still fits well at this stage as a triangle, it may still be another structure. This wave count looks at the possibility that it may be a double zigzag.
If cycle wave b is a double zigzag, then current upwards movement may be part of the second zigzag in the double, labelled primary wave Y.
The target remains the same.
Within intermediate wave (C), no second wave correction may move beyond the start of its first wave below 1,205.41.
There are two problems with this wave count which reduce its probability in terms of Elliott wave:
1. Cycle wave b is a double zigzag, but primary wave X within the double is deep and time consuming. While this is possible, it is much more common for X waves within double zigzags to be brief and shallow.
2. Intermediate wave (B) within the zigzag of primary wave Y is a double flat correction. These are extremely rare, even rarer than running flats. The rarity of this structure must further reduce the probability of this wave count.
Although this wave count still has these problems, technical analysis now points to it being more likely. The alternate will continue to be considered until price invalidates it.
DAILY CHART
Click chart to enlarge.
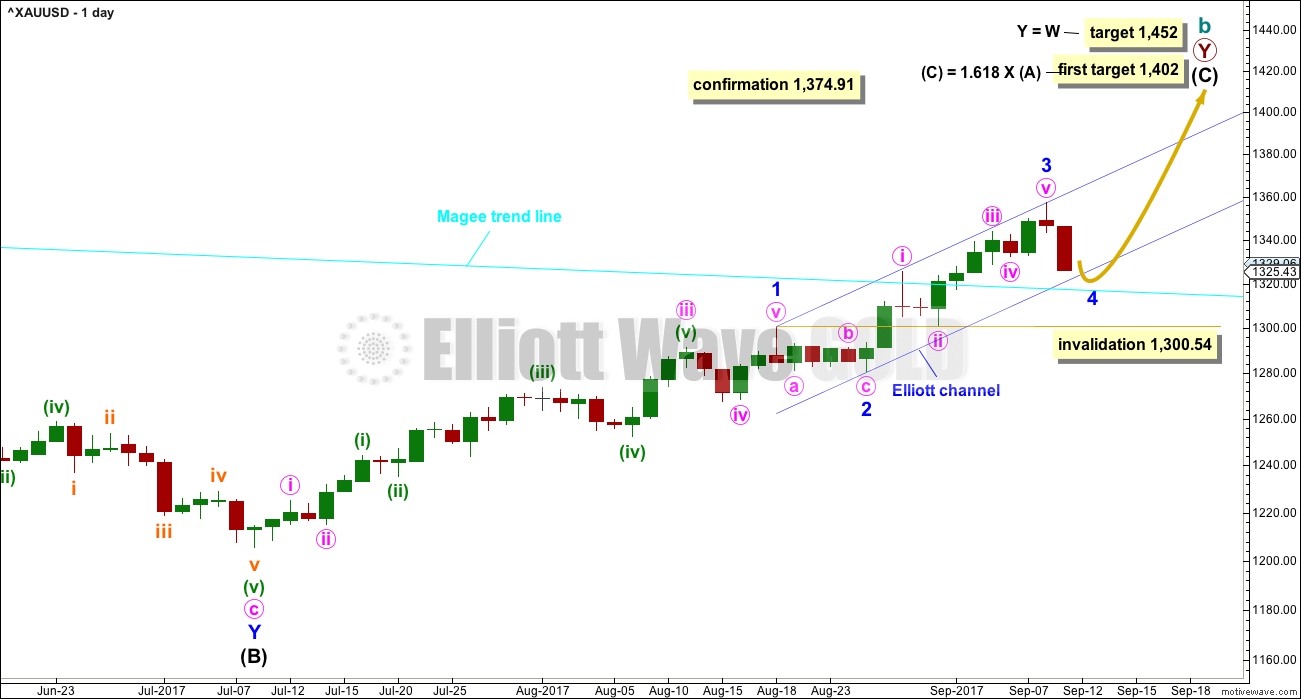
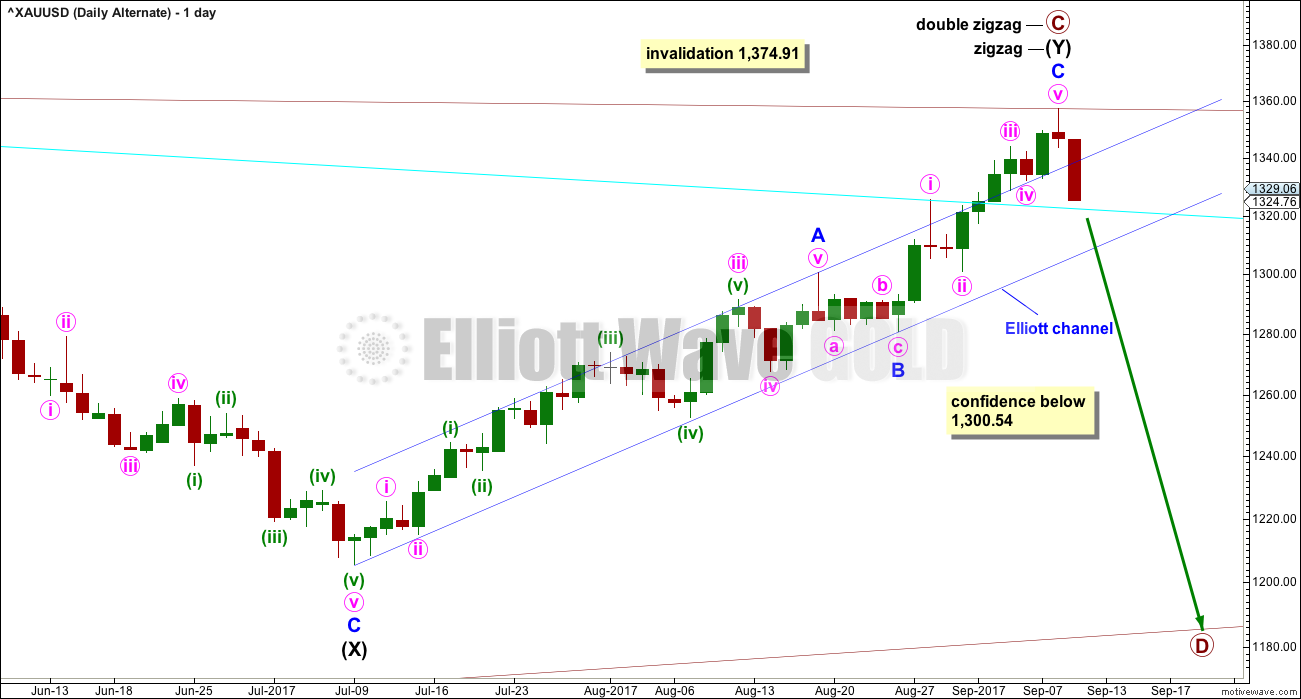
The analysis today will focus on the structure of intermediate wave (C). To see details of all the bull movement for this year see daily charts here.
Intermediate wave (C) may be unfolding as an impulse.
Within the impulse, minor waves 1 and 2 would now be complete.
Minor wave 2 may have ended as a relatively brief shallow second wave. It is unusual for second wave corrections to be this shallow. If my analysis of intermediate wave (C) is wrong, it may be in labelling minor waves 1 and 2 already over. It is possible that only minor wave 1 was over at last week’s high. If price moves below 1,300.54 at this stage, then I would expect a deeper more time consuming correction which would be labeled minor wave 2.
Minor wave 3 may only subdivide as an impulse. So far the corrections of minute waves ii and iv show up on the daily chart giving this portion of the wave count the right look. It looks like minor wave 3 could be over.
With minor wave 1 a very long extension, minor wave 3 may not be extended. If this labelling is correct, then there is no Fibonacci ratio between minor waves 1 and 3, and minor wave 3 is shorter than minor wave 1 by 18.80. This limits minor wave 5 to no longer than equality with minor wave 3 at 76.33, so that minor wave 3 is not the shortest and the core Elliott wave rule is met.
Minor wave 2 was a shallow 0.21 zigzag lasting five days. Given the guideline of alternation, minor wave 4 may be most likely a flat, triangle or combination. It may most likely last a Fibonacci five or eight days. Within all of flats, triangles and combinations, a new high above 1,357.09 may be included.
Minor wave 4 may not move into minor wave 1 price territory below 1,300.54.
Minor wave 4 should find very strong support at the cyan Magee trend line now if price gets down there. This would be a very typical curve down to back test support at prior resistance.
HOURLY CHART
Click chart to enlarge.
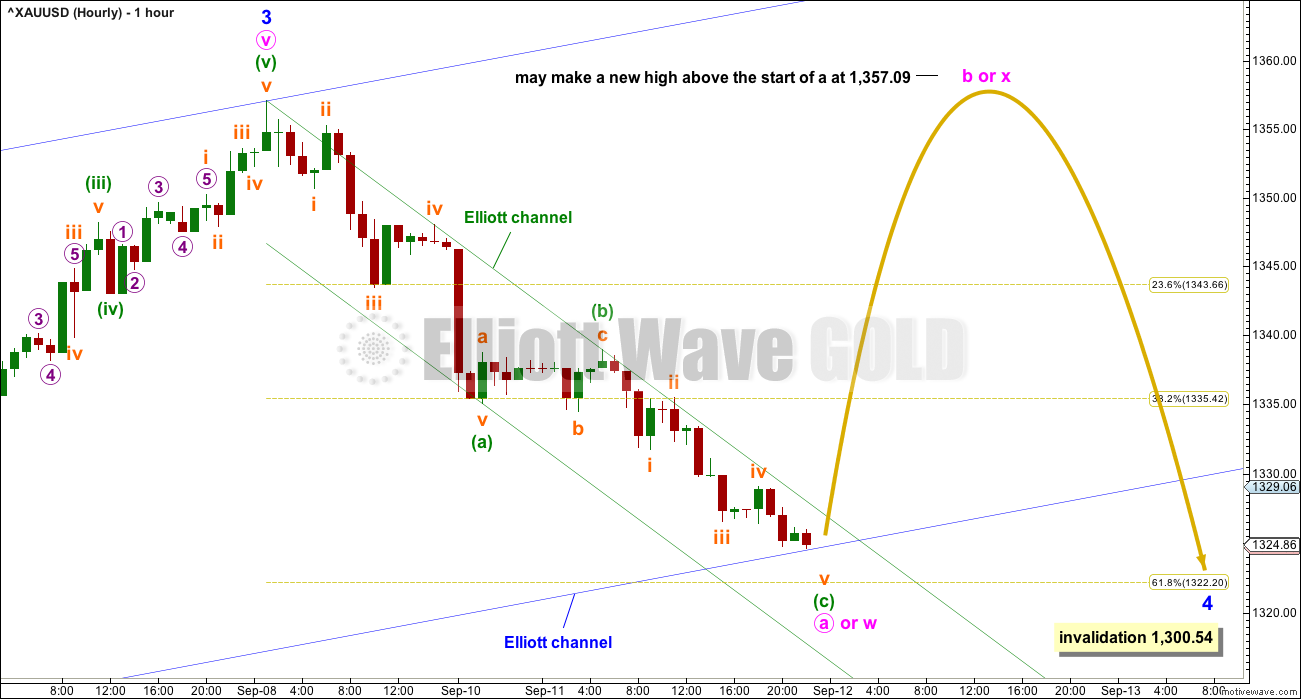
If minor wave 4 unfolds as either a flat, combination or triangle, then within it minute wave a would most likely be a three wave structure. When A waves subdivide as threes, they are almost always zigzags and occasionally flat corrections. A waves may not subdivide as triangles.
At this stage, it looks like minute wave a may be an almost complete zigzag finding support at the lower edge of the blue Elliott channel copied over from the daily chart.
A smaller channel is drawn about this possible zigzag. If price breaks above the upper edge of the green Elliott channel, that shall provide indication that minute wave a should be over and then minute wave b should be underway. Expect minute wave b to be very deep indeed.
If minor wave 4 is the most common flat correction, then within it minute wave b must retrace a minimum 0.9 length of minute wave a. Minute wave b of an expanded flat (the most common type and a very common structure) must be a minimum 1.05 length of minute wave a, so it must move above the start of minute wave a at 1,357.09.
If minor wave 4 is the next very common structure of a combination, then it would be labelled minute waves w, x and z. Doubles are common and triples are very rare, so triples will not be considered unless price proves it correct. Double combinations are most commonly a zigzag and a flat correction joined by a three for minute wave x in the opposite direction. Minute wave x may make a new high above 1,357.09.
If minor wave 4 is a triangle, then within it minute wave b may make a new high above 1,357.09 if the triangle is a running variety.
Minor wave 4 is now deeper than the price territory of the fourth wave of one lesser degree; minute wave iv within minor wave 3 had its lower limit at 1,332.22. While fourth wave corrections very often end within the fourth wave of one lesser degree price territory, they do not always end there. Minor wave 4 may yet complete within that zone if it is a triangle.
The labelling within minor wave 4 will change as more structure unfolds. At this stage, it is impossible for me to tell you with any confidence which of the multiple options outlined above minor wave 4 will be.
As more structure within minor wave 4 unfolds and the multiple options begin to diverge, then alternate hourly wave counts will be required.
ALTERNATE ELLIOTT WAVE COUNT
WEEKLY CHART
Click chart to enlarge.
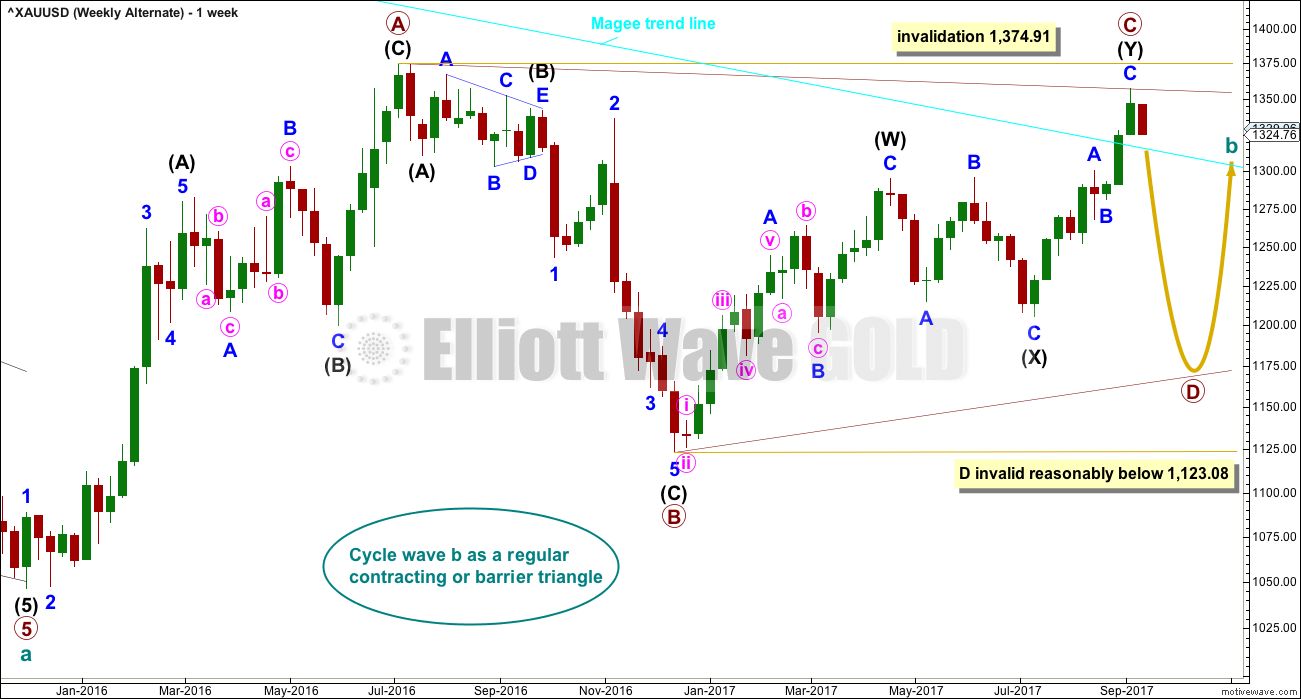
The Magee trend line is now breached by a full weekly candlestick above and not touching the line. This substantially reduces the probability of this wave count at the end of last week.
The Magee bear market trend line is drawn from the all time high for Gold on the 6th of September, 2011, to the first major swing high within the following bear market on the 5th of October, 2012.
To use this trend line in the way Magee describes, we should assume that price will find resistance at the line if it gets back up there. Now that the line is breached, it is signalling a major trend change from bear to bull.
Within a triangle, one sub-wave should be a more complicated multiple, which may be primary wave C. This is the most common sub-wave of the triangle to subdivide into a multiple.
Intermediate wave (Y) now looks like a developing zigzag at the weekly chart level, and minor wave B within it shows up with one red weekly candlestick.
Primary wave D of a contracting triangle may not move beyond the end of primary wave B below 1,123.08. Contracting triangles are the most common variety.
Primary wave D of a barrier triangle should end about the same level as primary wave B at 1,123.08, so that the B-D trend line remains essentially flat. This involves some subjectivity; price may move slightly below 1,123.08 and the triangle wave count may remain valid. This is the only Elliott wave rule which is not black and white.
Finally, primary wave E of a contracting or barrier triangle may not move beyond the end of primary wave C above 1,295.65. Primary wave E would most likely fall short of the A-C trend line. But if it does not end there, then it can slightly overshoot that trend line.
Primary wave A lasted 31 weeks, primary wave B lasted 23 weeks, and primary wave C started its 38th week. A double zigzag may be expected to be longer lasting than single zigzags within a triangle, and so this continuation of primary wave C is entirely acceptable and leaves the wave count with the right look at this time frame.
With upwards movement continuing, the A-C trend line now has too weak a slope. At this stage, this wave count now looks less likely.
DAILY CHART
Click chart to enlarge.
The cyan Magee trend line has now been breached. This must reduce the probability of this wave count.
A breach of the blue Elliott channel by downwards movement would indicate a trend change.
The structure of minor wave C may now be complete.
TECHNICAL ANALYSIS
WEEKLY CHART
Click chart to enlarge. Chart courtesy of StockCharts.com.
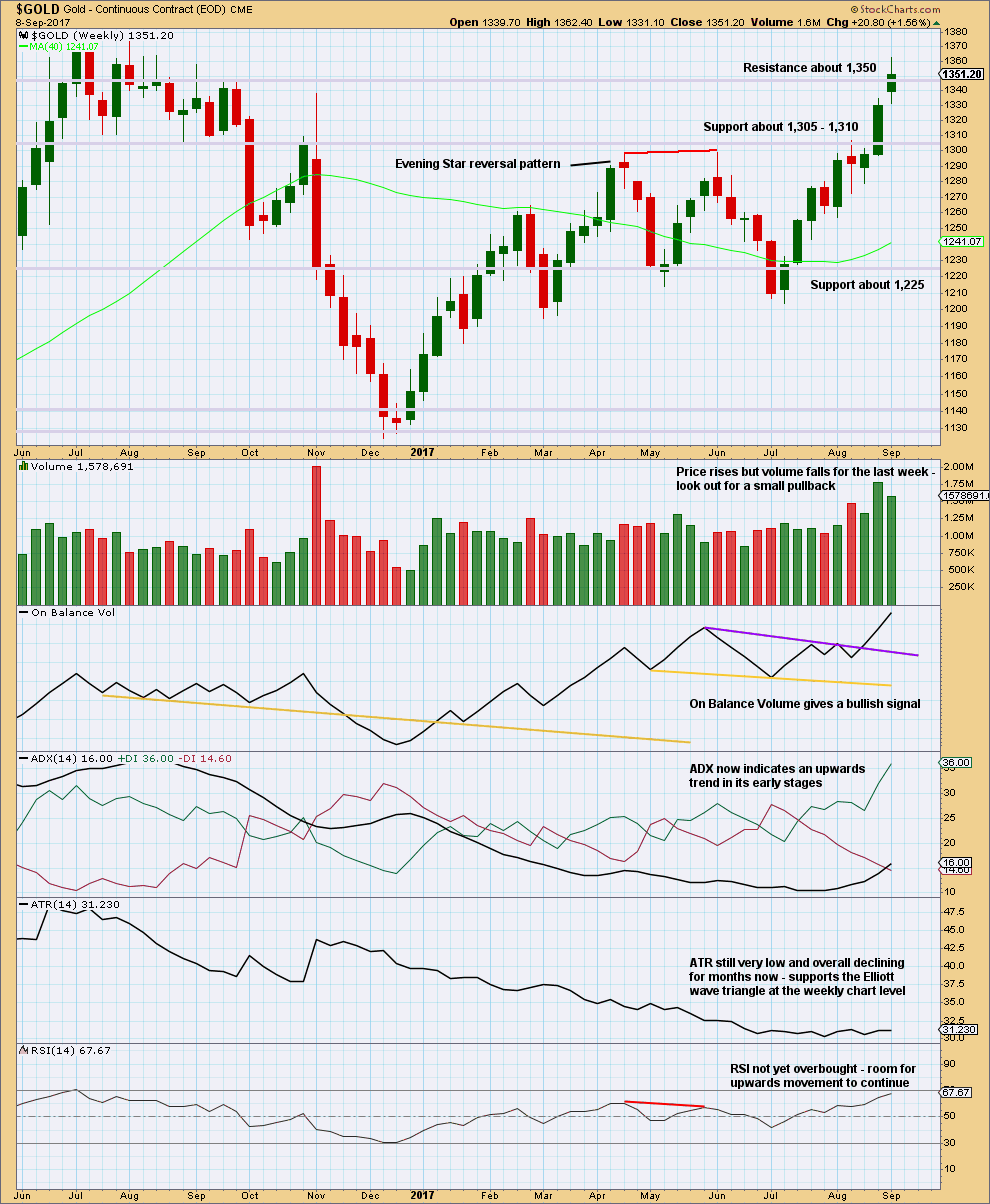
Overall, this chart is bullish. This trend may be expected to continue at least until weekly RSI reaches overbought.
A small pullback here within the upwards trend may pull RSI a little lower allowing more room for upwards movement to continue.
DAILY CHART
Click chart to enlarge. Chart courtesy of StockCharts.com.
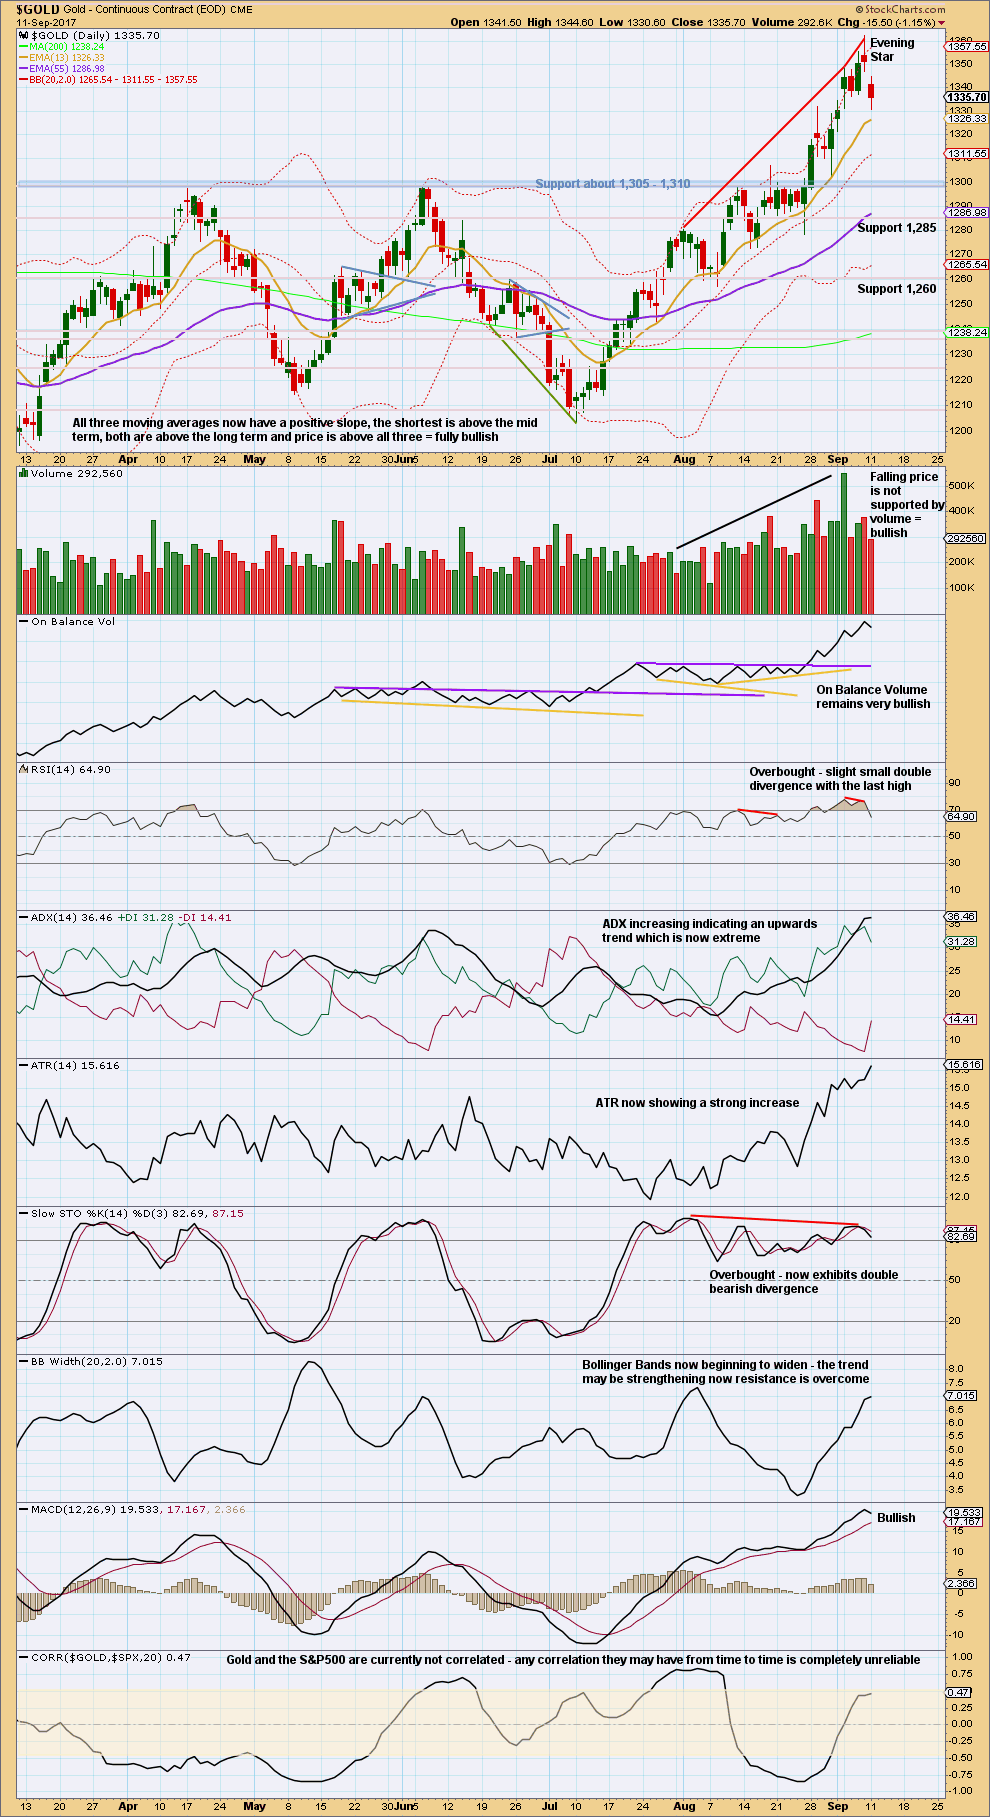
An Evening Star candlestick pattern indicates a trend change from up to either down or sideways. Candlestick reversal patterns do not necessarily mean a switch from up to down or down to up, they may also indicate a switch to sideways. This offers some support to the Elliott wave count.
Volume offers further support today to the Elliott wave count. Pullbacks and consolidations most typically come with lighter volume. Only should this view change if downwards movement continues and has support from volume. At this point, the data available indicates a consolidation.
Expect a pullback or consolidation as quite likely here. ADX is now above 35 and the black ADX line is above both directional lines. RSI and Stochastics are extreme and both exhibit double divergence with price, although it is weak.
These extreme readings are not enough to expect an end to the trend, only a pause within it.
GDX
DAILY CHART
Click chart to enlarge. Chart courtesy of StockCharts.com.
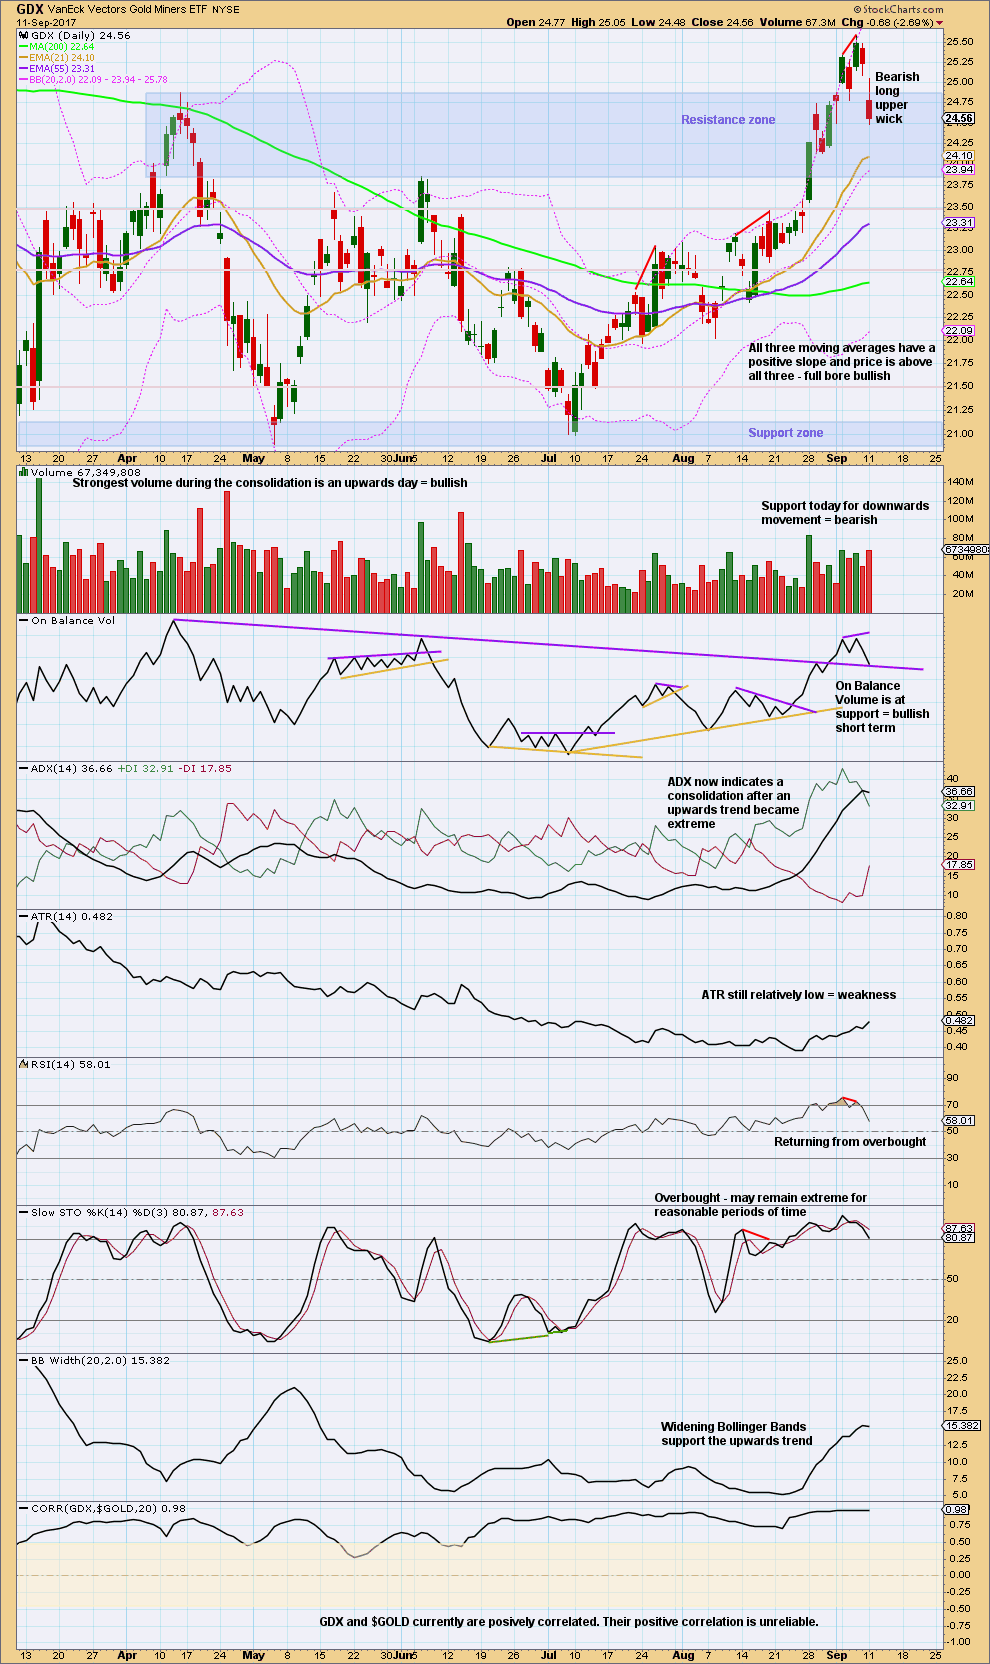
On Balance Volume may halt the fall in price, but support from volume contradicts this. Give more weight to support on On Balance Volume though; expect a small bounce here for GDX within a larger consolidation.
Expect the consolidation to continue until it relieves overbought and extreme conditions.
GOLD THIRD WAVE EXAMPLE – DAILY CHART
Click chart to enlarge. Chart courtesy of StockCharts.com.
This section will be left at the end of analysis until either the current wave count is proven wrong, or the third wave we are expecting has completed.
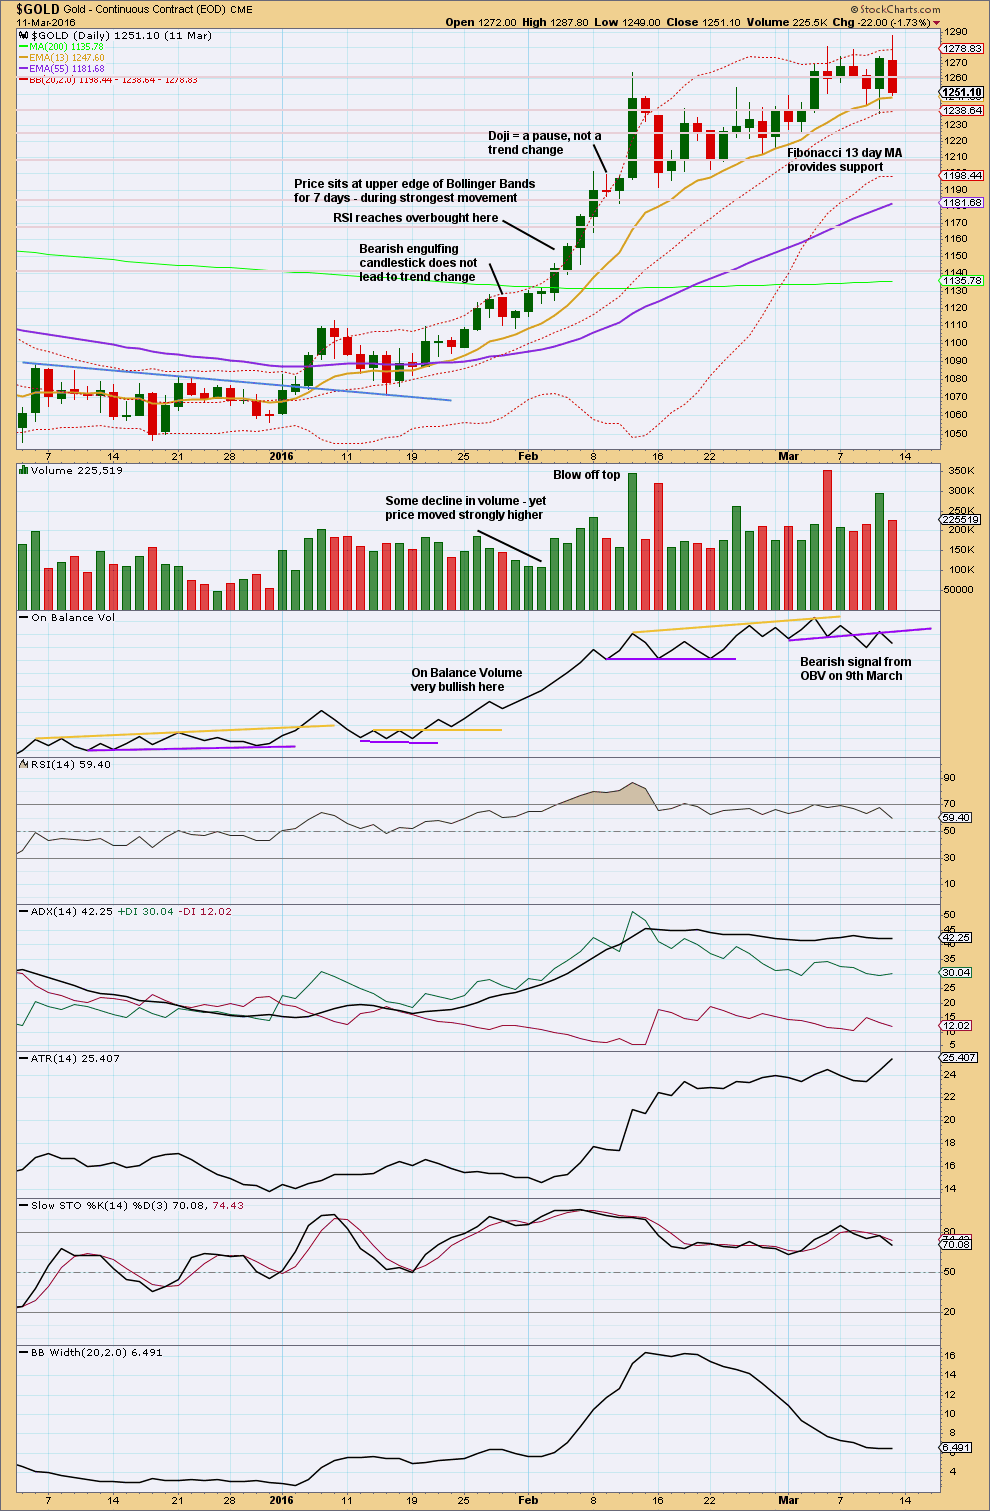
This chart has been published before. It shows the most recent example of a strong third wave in Gold from December 2015 to March 2016.
Note that during this strong upwards trend:
– RSI first reached overbought on the 4th of February and price then continued strongly higher for five more days culminating in a blowoff top on the 11th of February.
– RSI and Stochastics remained extreme for most of the second half of the trend. At the final high, they both exhibited strong divergence with price.
– Price found support at the short term Fibonacci 13 day moving average during the entire trend.
– All signals from On Balance Volume were bullish right up to the end of the trend. The 9th of March shows the first bearish signal, which was an important warning of a trend change.
– The trend begins with choppy overlapping and some hesitancy.
– The 6th of January was an important upwards breakout from resistance, with support from volume. Thereafter, price moved more strongly.
– While overall volume supported the upwards movement in price, this was not linear. Some weaker days occurred yet price continued higher. It is the overall trend of volume which is more important than any one or two days. On Balance Volume remaining bullish was an important guide.
No two waves are the same. So if the current wave count is correct, it may be different from this example. However, there are some important lessons to be learned here:
1. On Balance Volume is an important guide. Bullish signals should be taken seriously, particularly early on in the trend. Later in the trend, with RSI and Stochastics overbought, any bearish signal from On Balance Volume should see long positions closed.
2. RSI and Stochastics can reach extreme overbought. Only when they have been extreme for some time and then exhibit strong divergence should it be taken as a warning of a trend change.
Published @ 11:21 p.m. EST.
I am always bemused when offered a criticism of Elliott wave analysis during a consolidation, that it is not able to tell traders the exact pathway price may take during the consolidation.
I am bemused because there is literally no analytical method which will do this. If nothing else will tell you the smaller movements within a consolidation, they why should Elliott wave be able to do that?
What Elliott wave does have which is an improvement, is an outline of the different options, and use of invalidation points. It can tell you which pathway is more likely than others due to the guideline of alternation.
That’s as good as it’s going to get folks.
Hourly chart update:
First wave down within the consolidation done, now a wave up to complete.
It may be deep and it may make a new high.
It is still impossible for me to tell you which structure minor 4 may be. How high this next wave goes will give some clues. If it doesn’t reach the minimum for a flat then we can cut that option… for now.
The fact that minor 4 is not properly respecting the lower edge of the Elliott channel today indicates that it may not be contained within the channel. It may move lower to test support at the cyan trend line.
thAnk u lara sir
You’re welcome. But I’m not a sir, I’m a…. ma’am?
Ichimoku Gold Intraday Update
Data as at 6:00 am ET, September 12
==============================
Gold prices underwent a hefty pullback after reaching the high of 1357.09 last Friday. As of writing, prices have broken down below the tenkan-sen and the kijun-sen, and had gone back into the 4-hour kumo. The cloud support is expected to hold. Together with an oversold RSI 5 (not shown), a reversal of the short-term trend is quite likely.
On the daily chart (not shown), prices have broken down below the tenkan-sen. Kijun-sen support is at 1305. I see very slim chances of trading below the kijun-sen but as long as we are trading below the 4-hour tenkan-sen, 1331.51, the short-term bearish scenario cannot be written off yet. A close above the 4-hour kijun-sen, 1340.25, should turn things round towards a resumption of the bullish trend.
lara sir if gold sell then say sell
lara sir dnt say two sides please we r confusing u r report say only one side
Viky.
Lara has to consider all reasonable possibilities. At the moment, the bullish scenario is more likely, but the bearish case cannot be excluded yet. She is presenting all the facts, and it is up to us to make our own decisions. She can’t make them for us.
thank you Alan
Dreamer sir if to day n timmorrow not break mcx price 30282 then we go sell gold for the trgt of, 27600
Some additional thoughts on the Volume by Price chart.
Refer to the numbers on the chart:
(1) This price zone has the heaviest volume. This zone acted as resistance until it was broken to the upside. Once broken to the upside, the price zone now acts as strong support. I would not expect gold to break back below 1,300 while this bull move is intact.
(2) This next zone to the upside has lower volume and therefore provides less resistance than the lower price zone. So far price has attempted a breakout to the upside.
(3) This arrow shows that as price moves up, resistance becomes weaker because the volume in the next two price zones continues to decline until price gets to the very low volume, thin trading zone.
In summary, this price by volume chart supports a move up toward the 1,500+ range.
You can read about “Price by Volume” here:
http://stockcharts.com/school/doku.php?st=price+by+volume&id=chart_school:technical_indicators:volume_by_price
Thanks Dreamer. Interesting synopsis of volume & price. Just wondering if it’s not fear trade that drives Gold price up before a fizzle lol…. Crimea 1392, Brexit 1375, NK 1357…. Imo appears that Gold price is presently capped (toppy) at 1336 although a gap fill between Friday/Monday can be expected at some stage. Hard to say if the low for the day is in already at 1323 unless the high heeled boys decide to go for a break below 1319…Dang! Lacklustre performance so far. Test of patience 🙂
I see this correction as Minute wave 4 for GDX. The steep green channel is overshot to the downside today.
The correction could be over now, but I’m looking for this correction to find support at the lower edge of the purple Elliott Channel drawn around Minute waves 1 & 3 with a copy on Minute 2. That price level corresponds with the .382 Fib retracement @ 24.24.
Just below that is the top of the Base channel just above 24.00 That should provide strong support if this count is correct.
Good trading to all!
https://www.tradingview.com/x/farlJHTX/
Brilliant observation, Dreamer, as usual.
Chart Masterpiece!
Thank you.
i think buying is not gud