
A little more downwards movement was allowed for and was expected to find very strong support at a long term trend line. This is what appears to be happening today with price bouncing strongly up off the line.
Summary: This is my favourite trade set up: a breach of an important trend line followed by a back test. With price now moving up and away from the cyan trend line, this should be a good opportunity to enter long. The target is now 1,376. The limit is now 1,393.92. Stops may be set just below the invalidation point at 1,317.59.
Always use a stop. Invest only 1-5% of equity on any one trade.
New updates to this analysis are in bold.
Last monthly charts for the main wave count are here, another monthly alternate is here, and video is here.
Grand SuperCycle analysis is here.
MAIN ELLIOTT WAVE COUNT
WEEKLY CHART
Click chart to enlarge.
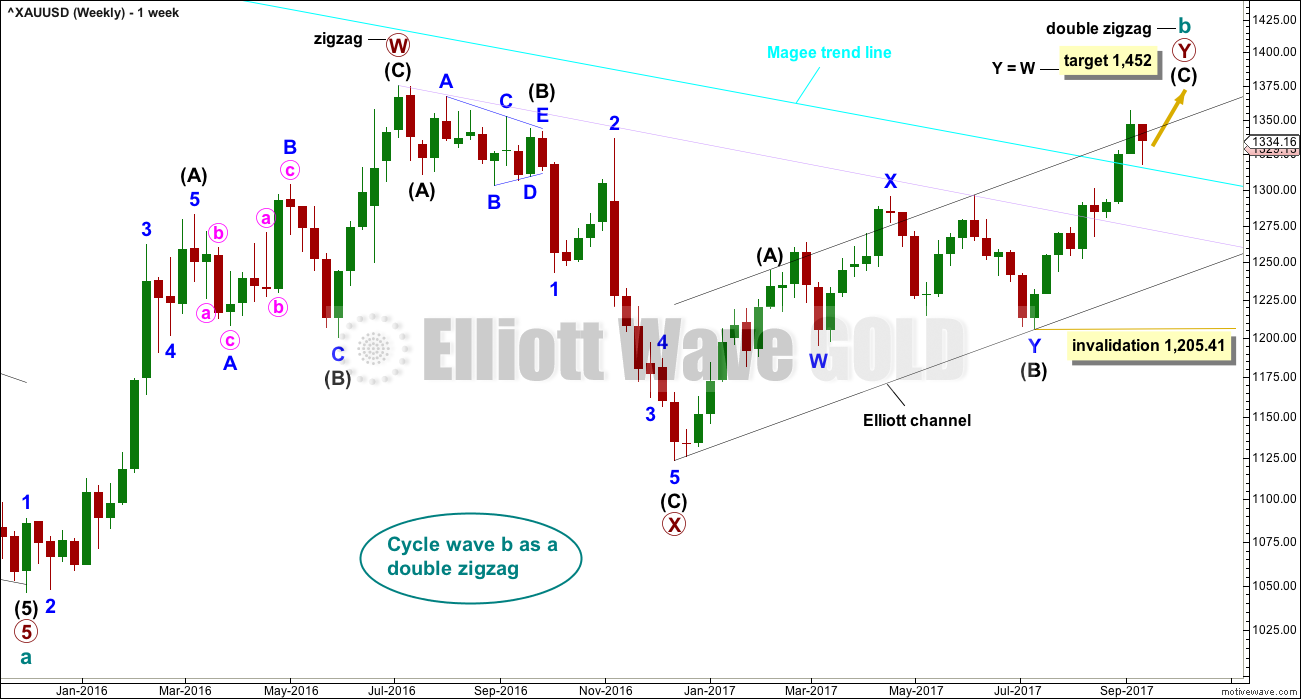
There is strong support from classic technical analysis for this wave count. Now that price has fully broken above the Magee trend line and has broken out above a consolidation zone, with support from volume, this wave count will now be the main wave count.
There are more than 23 possible corrective structures that B waves may take, and although cycle wave b still fits well at this stage as a triangle, it may still be another structure. This wave count looks at the possibility that it may be a double zigzag.
If cycle wave b is a double zigzag, then current upwards movement may be part of the second zigzag in the double, labelled primary wave Y.
The target remains the same.
Within intermediate wave (C), no second wave correction may move beyond the start of its first wave below 1,205.41.
There are two problems with this wave count which reduce its probability in terms of Elliott wave:
1. Cycle wave b is a double zigzag, but primary wave X within the double is deep and time consuming. While this is possible, it is much more common for X waves within double zigzags to be brief and shallow.
2. Intermediate wave (B) within the zigzag of primary wave Y is a double flat correction. These are extremely rare, even rarer than running flats. The rarity of this structure must further reduce the probability of this wave count.
Although this wave count still has these problems, technical analysis now points to it being more likely. The alternate will continue to be considered until price invalidates it.
DAILY CHART
Click chart to enlarge.
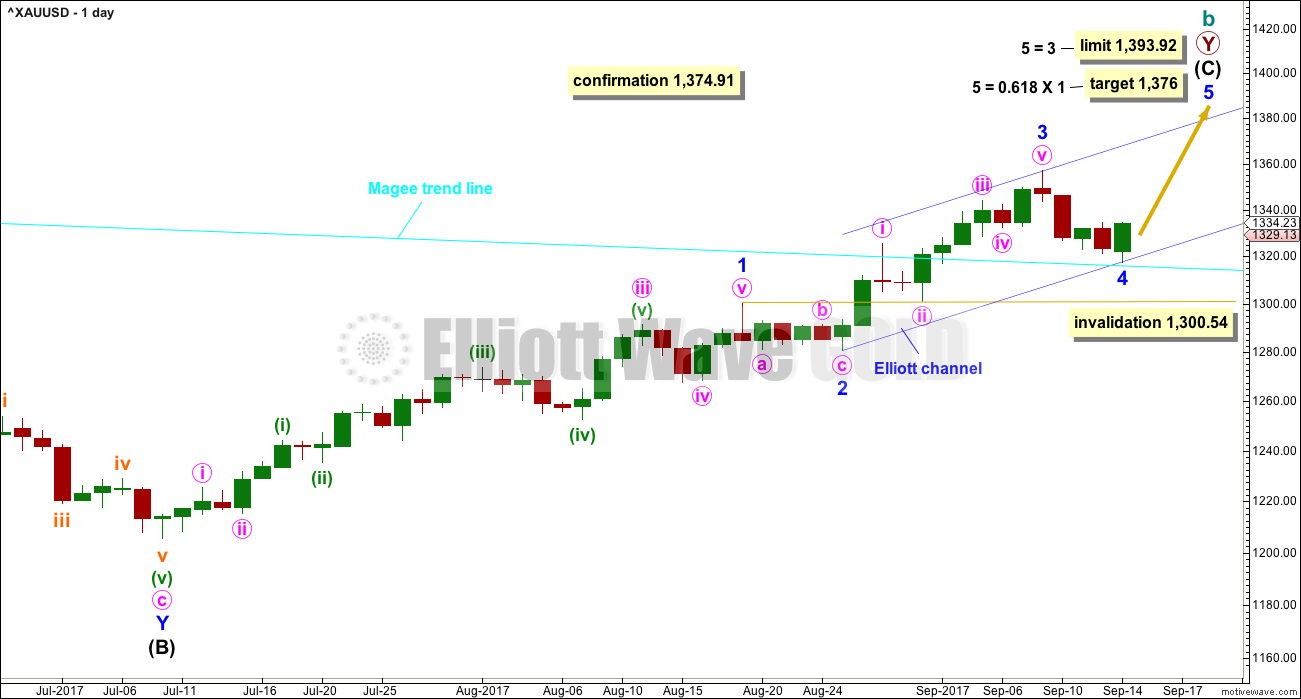
The analysis will focus on the structure of intermediate wave (C). To see details of all the bull movement for this year see daily charts here.
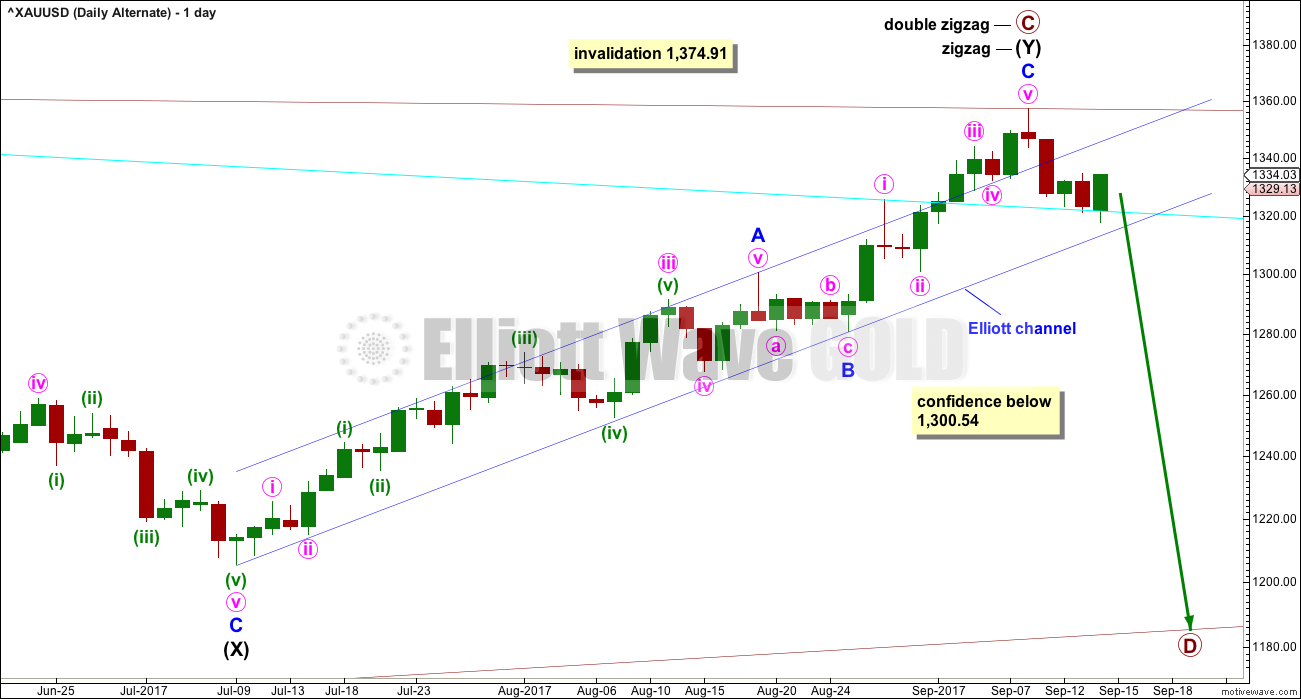
Intermediate wave (C) may be unfolding as an impulse.
Within the impulse, minor waves 1 through to 4 may now be complete.
Minor wave 2 may have ended as a relatively brief shallow second wave. It is unusual for second wave corrections to be this shallow. If my analysis of intermediate wave (C) is wrong, it may be in labelling minor waves 1 and 2 already over. It is possible that only minor wave 1 was over at last week’s high. If price moves below 1,300.54 at this stage, then I would expect a deeper more time consuming correction which would be labeled minor wave 2.
Minor wave 2 was a shallow 0.21 zigzag lasting five days. Minor wave 4 may be complete as a 0.52 double zigzag lasting four days. There is good alternation in depth and some alternation in structure.
It is also possible to move the degree of labelling within minor wave 4 down one degree; the zigzag may be only minute wave a of a triangle or flat correction for minor wave 4. Minor wave 4 may continue sideways for a few more days. However, with both minor waves 2 and 4 close to even in duration, they now have good proportions. If minor wave 4 is not even half way through, then when it is done the proportions between them would be poor, so it now looks most likely that minor wave 4 is over today.
Minor wave 4 may not move into minor wave 1 price territory below 1,300.54.
Minor wave 4 should find very strong support at the cyan Magee trend line now if price gets down there. This would be a very typical curve down to back test support at prior resistance. At this time, price has touched that trend line and is now beginning to move strongly higher. Support at the line has held, the back test is complete, so it would now be most typical to see price move up and away.
Fourth waves are often but not always contained within a channel drawn about the impulse using Elliott’s first technique. That is why Elliott developed a second technique to redraw the channel when a fourth wave breached it. The channel is redrawn using the second technique: the first trend line is drawn from the ends of minor waves 2 to 4, then a parallel copy is placed upon the end of minor wave 3. Minor wave 5 may end either mid way within this channel or at the upper edge.
HOURLY CHART
Click chart to enlarge.
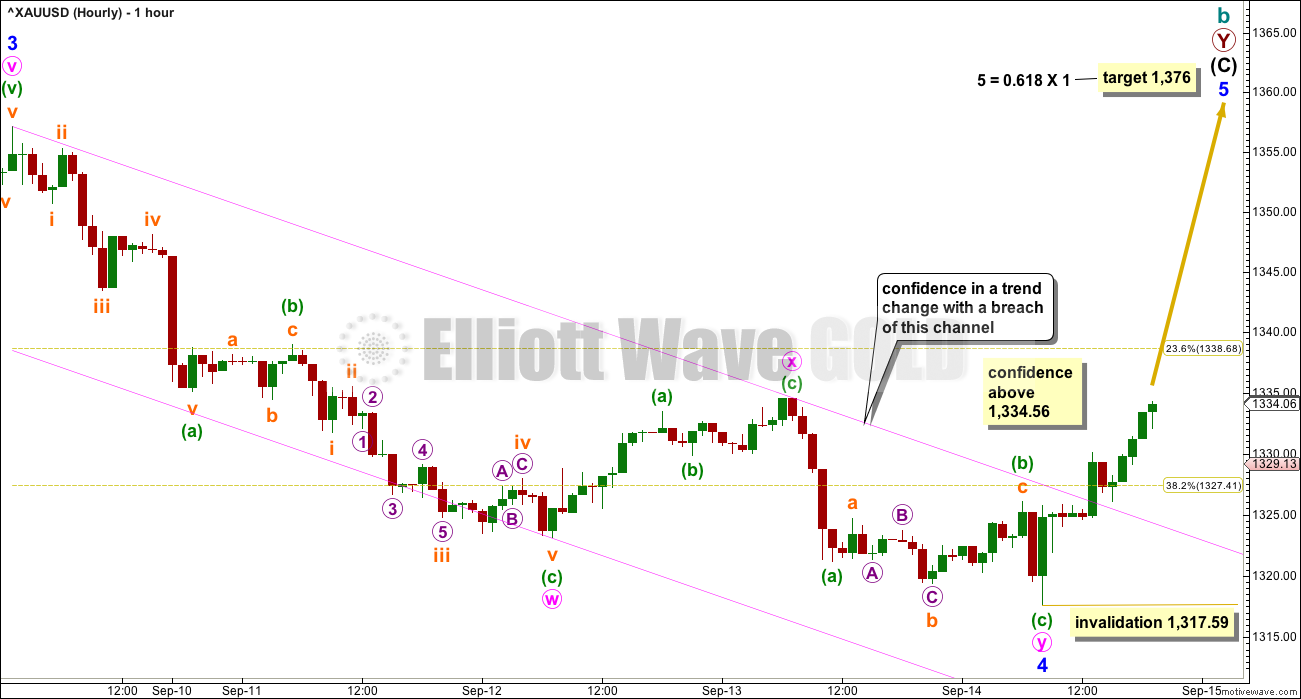
Minor wave 4 now fits best as a double zigzag offering a little alternation in structure with the single zigzag of minor wave 2.
The pink best fit channel about minor wave 4 is breached by upwards movement, offering some confidence now in a trend change.
A new high above 1,334.56 would add further confidence.
Targets for minor wave 5 are recalculated.
Within minor wave 5, no second wave correction may move beyond it’s start below 1,317.59.
ALTERNATE ELLIOTT WAVE COUNT
WEEKLY CHART
Click chart to enlarge.
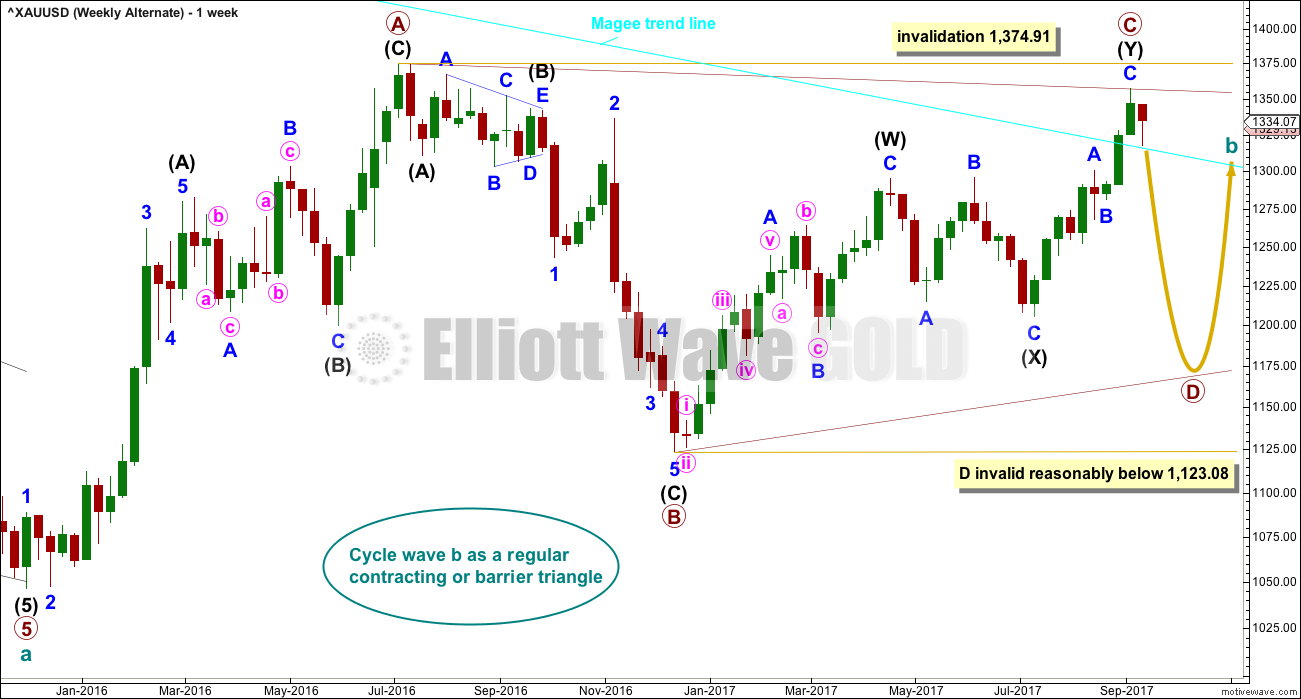
The Magee trend line is now breached by a full weekly candlestick above and not touching the line. This substantially reduces the probability of this wave count.
The Magee bear market trend line is drawn from the all time high for Gold on the 6th of September, 2011, to the first major swing high within the following bear market on the 5th of October, 2012.
To use this trend line in the way Magee describes, we should assume that price will find resistance at the line if it gets back up there. Now that the line is breached, it is signalling a major trend change from bear to bull.
Within a triangle, one sub-wave should be a more complicated multiple, which may be primary wave C. This is the most common sub-wave of the triangle to subdivide into a multiple.
Intermediate wave (Y) now looks like a complete zigzag at the weekly chart level.
Primary wave D of a contracting triangle may not move beyond the end of primary wave B below 1,123.08. Contracting triangles are the most common variety.
Primary wave D of a barrier triangle should end about the same level as primary wave B at 1,123.08, so that the B-D trend line remains essentially flat. This involves some subjectivity; price may move slightly below 1,123.08 and the triangle wave count may remain valid. This is the only Elliott wave rule which is not black and white.
Finally, primary wave E of a contracting or barrier triangle may not move beyond the end of primary wave C above 1,295.65. Primary wave E would most likely fall short of the A-C trend line. But if it does not end there, then it can slightly overshoot that trend line.
Primary wave A lasted 31 weeks, primary wave B lasted 23 weeks, and primary wave C started its 38th week. A double zigzag may be expected to be longer lasting than single zigzags within a triangle, and so this continuation of primary wave C is entirely acceptable and leaves the wave count with the right look at this time frame.
With upwards movement continuing, the A-C trend line now has too weak a slope. At this stage, this wave count now looks less likely.
DAILY CHART
Click chart to enlarge.
The cyan Magee trend line has now been breached. This must reduce the probability of this wave count.
A breach of the blue Elliott channel by downwards movement would indicate a trend change.
The structure of minor wave C may now be complete.
HOURLY CHART
Click chart to enlarge.
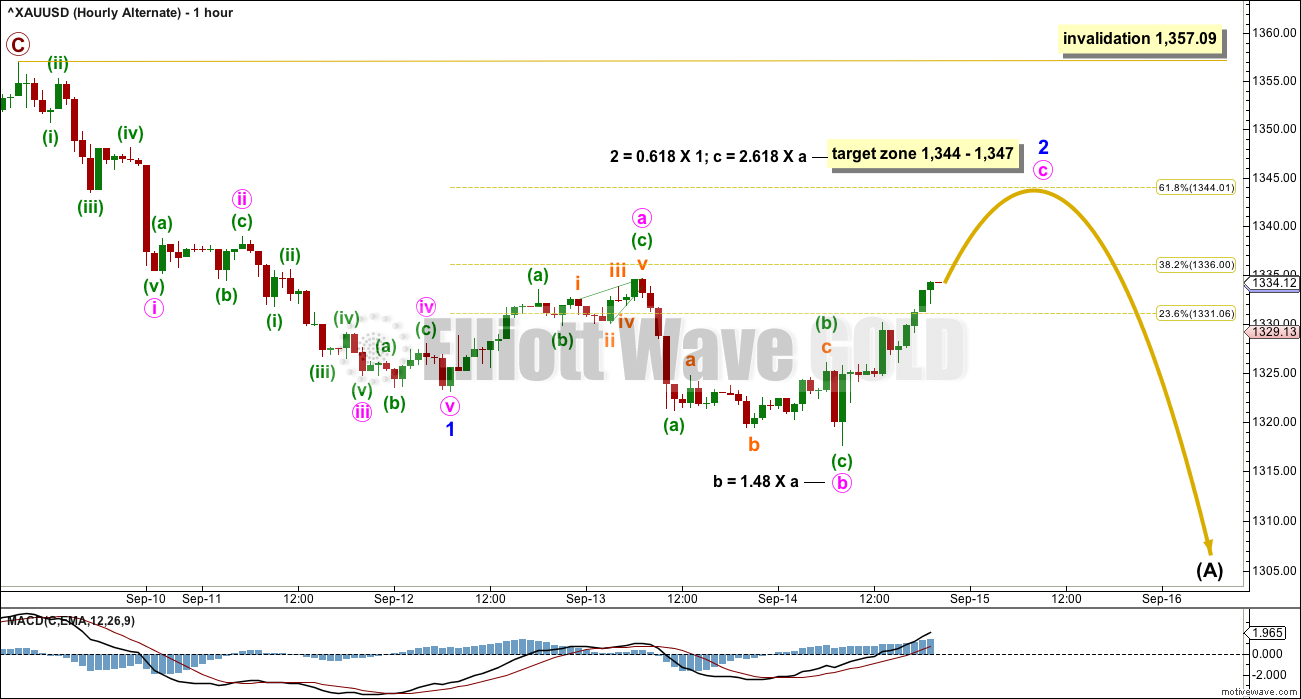
For this alternate, minor wave 2 may be continuing higher to end closer to the 0.618 Fibonacci ratio as an expanded flat correction. Expanded flats are very common structures.
Minor wave 2 may not move beyond the start of minor wave 1 above 1,357.09.
TECHNICAL ANALYSIS
WEEKLY CHART
Click chart to enlarge. Chart courtesy of StockCharts.com.
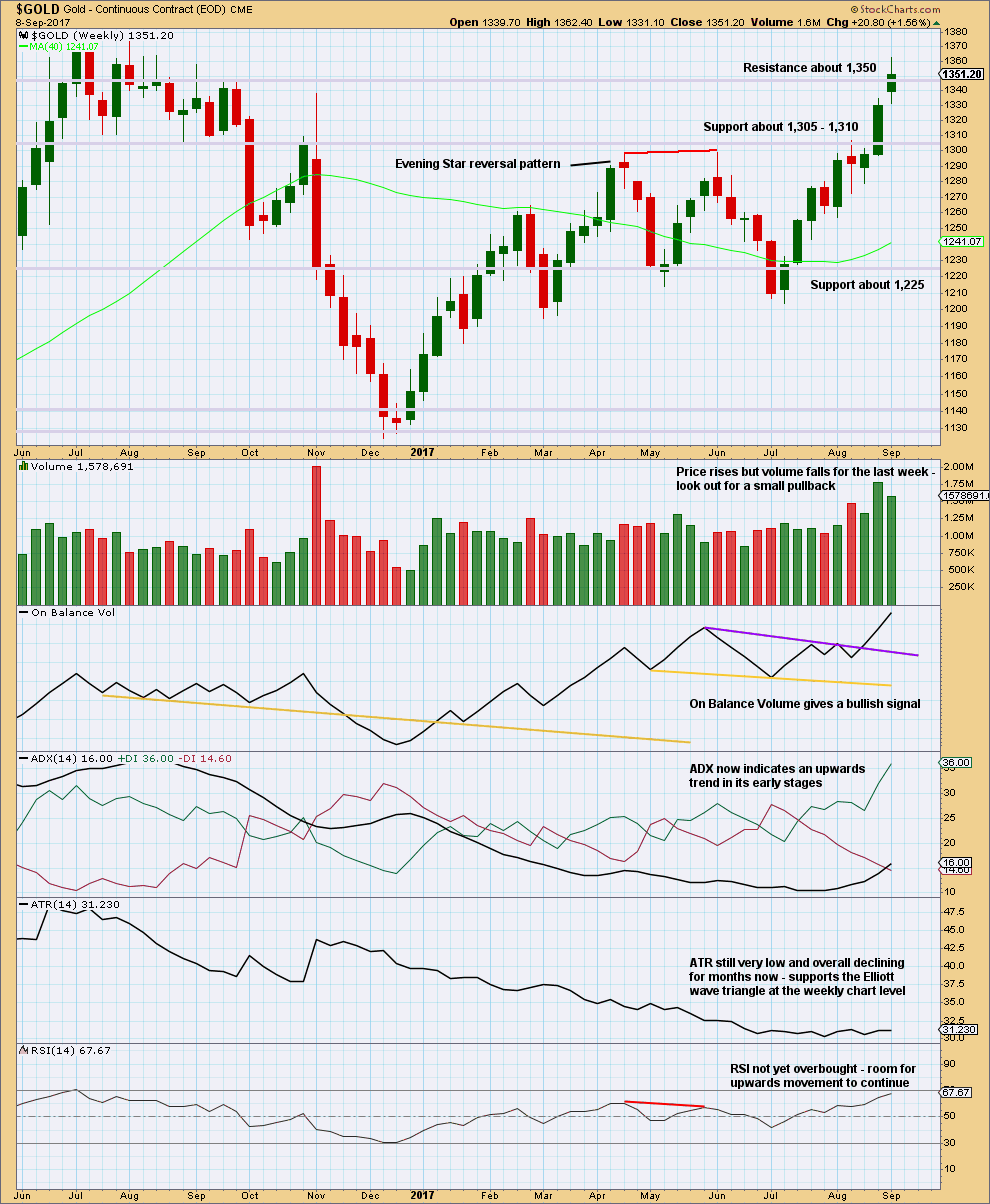
Overall, this chart is bullish. This trend may be expected to continue at least until weekly RSI reaches overbought.
A small pullback here within the upwards trend may pull RSI a little lower allowing more room for upwards movement to continue.
DAILY CHART
Click chart to enlarge. Chart courtesy of StockCharts.com.
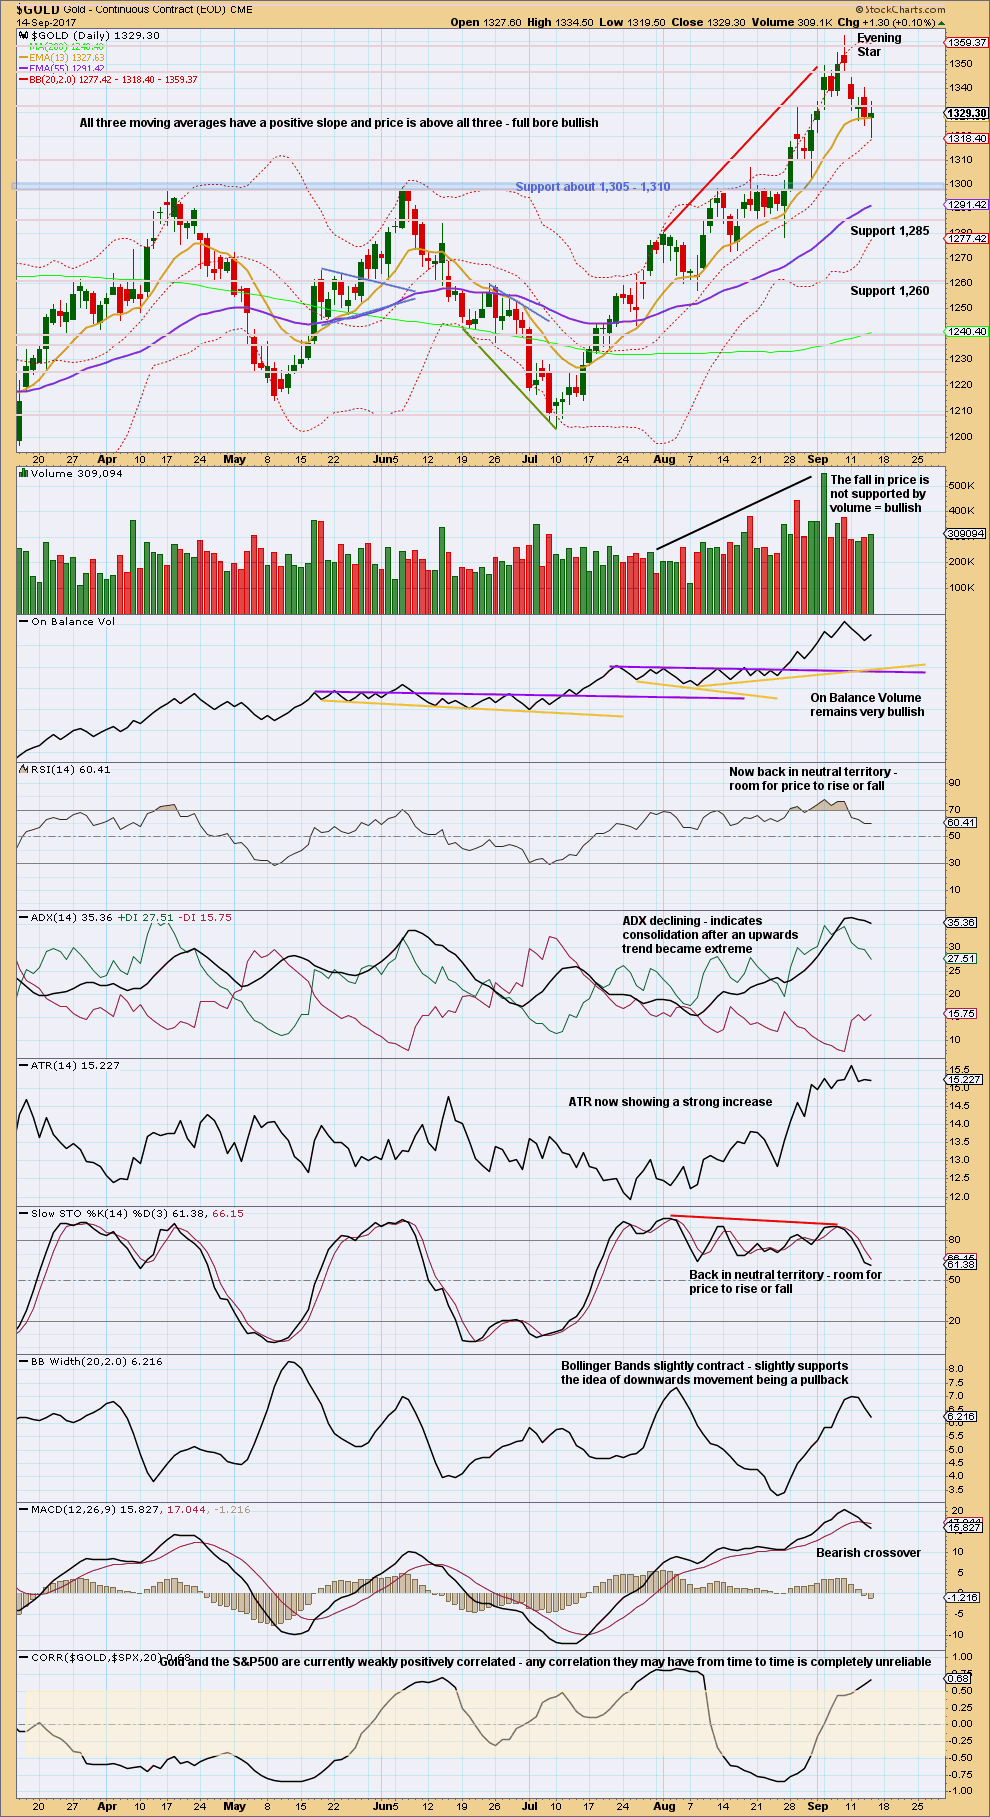
Thursday’s session completes a green candlestick with the balance of volume upwards, although it made a lower low and a lower high. There was slight support during the session for upwards movement from volume.
This trend is still stretched, but it does not look complete yet. The volume profile remains bullish and as yet there is no bearish signal from On Balance Volume for Gold.
GDX
DAILY CHART
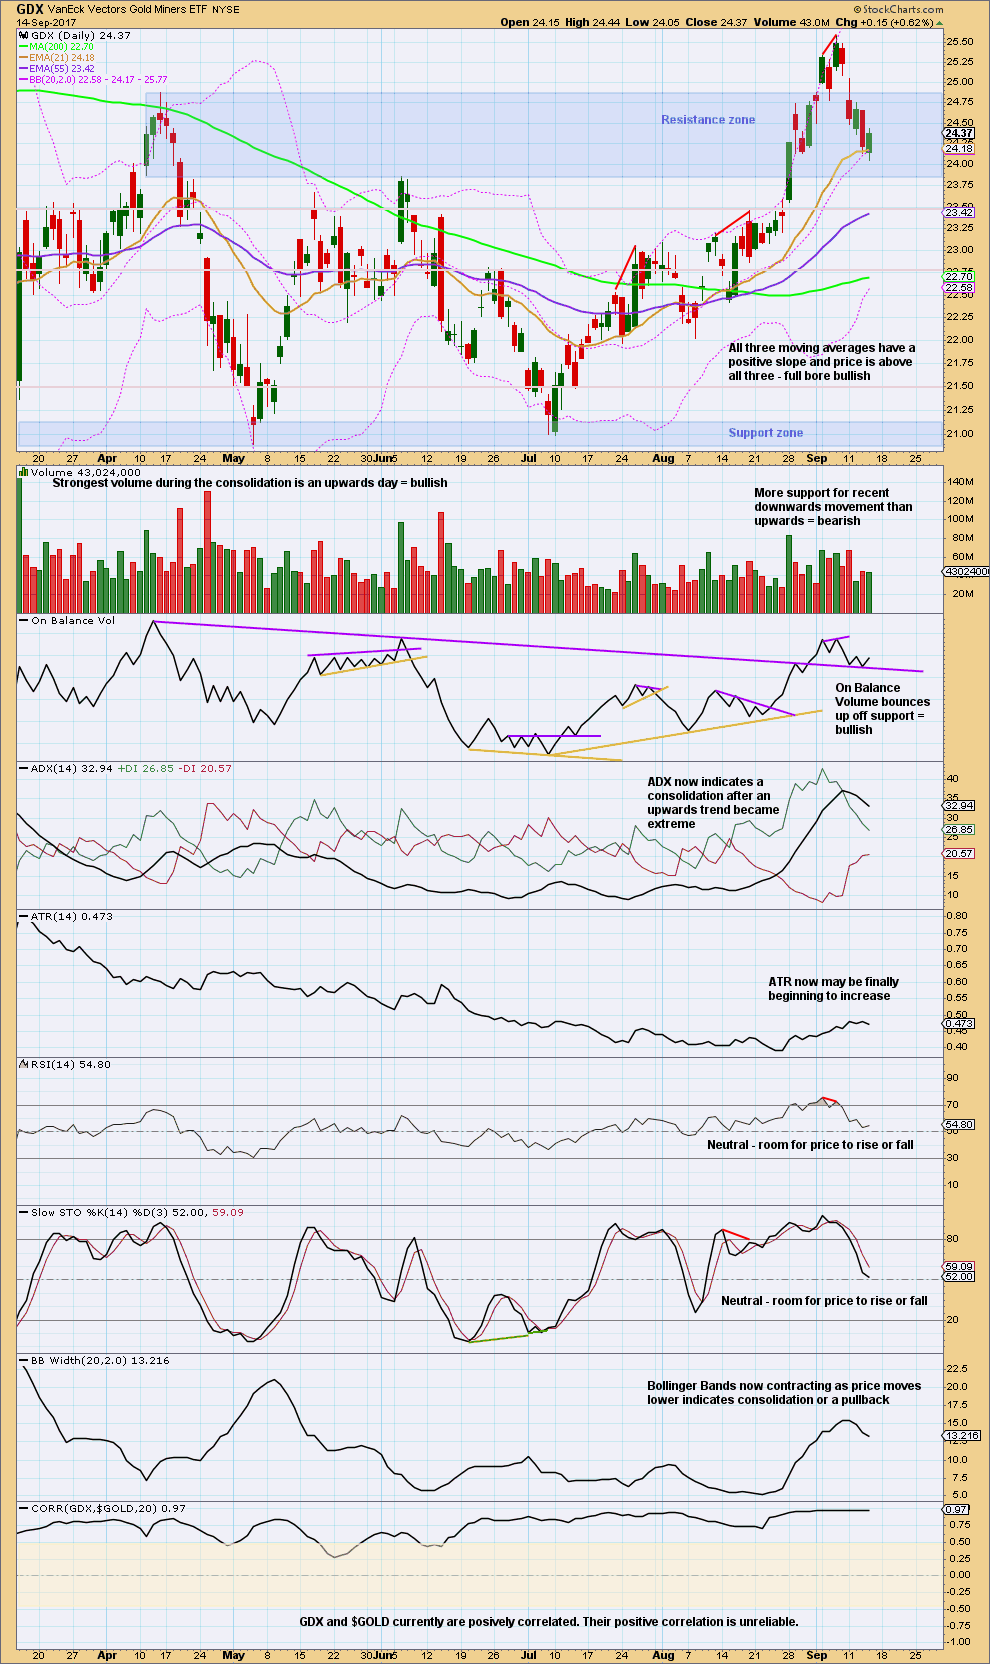
Click chart to enlarge. Chart courtesy of StockCharts.com.
On Balance Volume provides another bullish signal for GDX. Give this reasonable weight.
A slightly longer lower wick on today’s candlestick is also slightly bullish.
The only cause for concern regarding the bullish outlook is ADX still being extreme.
GOLD THIRD WAVE EXAMPLE – DAILY CHART
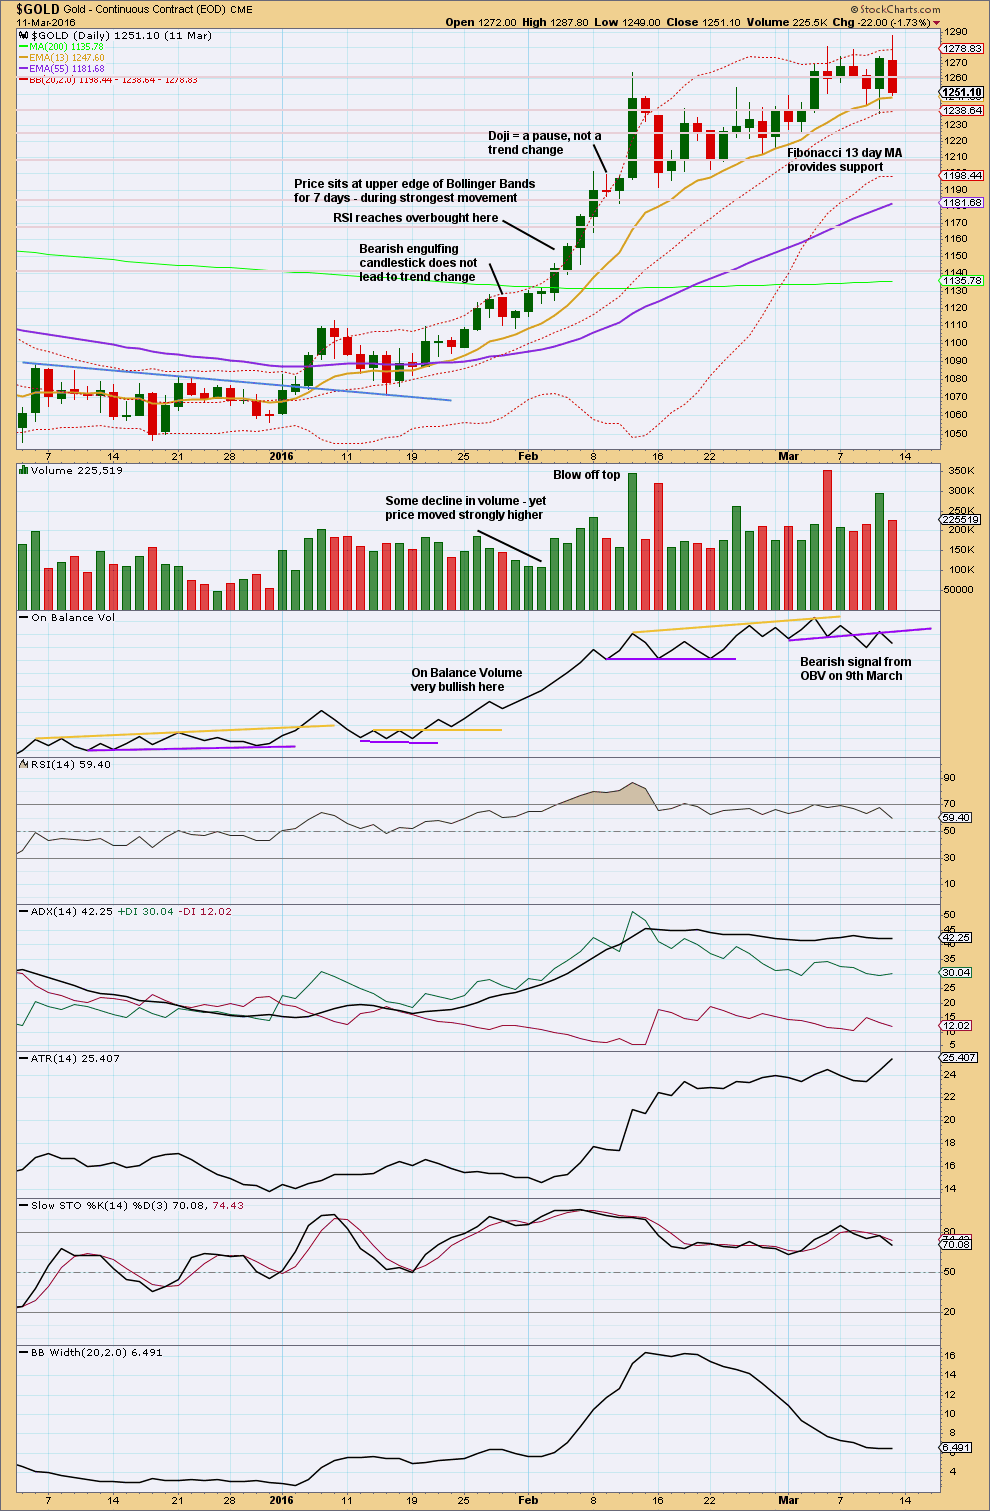
Click chart to enlarge. Chart courtesy of StockCharts.com.
This section will be left at the end of analysis until either the current wave count is proven wrong, or the third wave we are expecting has completed.
This chart has been published before. It shows the most recent example of a strong third wave in Gold from December 2015 to March 2016.
Note that during this strong upwards trend:
– RSI first reached overbought on the 4th of February and price then continued strongly higher for five more days culminating in a blowoff top on the 11th of February.
– RSI and Stochastics remained extreme for most of the second half of the trend. At the final high, they both exhibited strong divergence with price.
– Price found support at the short term Fibonacci 13 day moving average during the entire trend.
– All signals from On Balance Volume were bullish right up to the end of the trend. The 9th of March shows the first bearish signal, which was an important warning of a trend change.
– The trend begins with choppy overlapping and some hesitancy.
– The 6th of January was an important upwards breakout from resistance, with support from volume. Thereafter, price moved more strongly.
– While overall volume supported the upwards movement in price, this was not linear. Some weaker days occurred yet price continued higher. It is the overall trend of volume which is more important than any one or two days. On Balance Volume remaining bullish was an important guide.
No two waves are the same. So if the current wave count is correct, it may be different from this example. However, there are some important lessons to be learned here:
1. On Balance Volume is an important guide. Bullish signals should be taken seriously, particularly early on in the trend. Later in the trend, with RSI and Stochastics overbought, any bearish signal from On Balance Volume should see long positions closed.
2. RSI and Stochastics can reach extreme overbought. Only when they have been extreme for some time and then exhibit strong divergence should it be taken as a warning of a trend change.
Published @ 09:02 p.m. EST.
Hourly chart updated:
the first second wave correction in a new wave is usually very deep, and so the deep pullback labelled minute ii is typical behaviour for Gold.
While price remains above the invalidation point this will be the preferred outlook.
the target remains the same
in my view this is last year 2016 sep its already running fourth wave so already starts
total four points present one point already leace up side now second point leave
Mam once this is the fourth wave then which one is gud resisitance present
The recent low was just beyond .618 retracement of yesterday’s up move and also likely another double zigzag. If this mornings low holds that would have been minute wave 2 of minor 5. So up we should go.
Good call Syed!
Hi Patrick. Thanks, didn’t know I had made a call lol. But yeah at the top of the day it was my sense for Gold price to pullback to 1320-1318. I think we have almost got that today. On the upside, Gold price has not been able to get past 1335 since 12-Sept. Imo Gold price would be getting ahead of itself if it did! With a falling ADX, bullish ROC & momentum, price tends to get choppy. Hard to pick an entry and exit with overlapping price movement. Very deceptive! GL with your trades and may they be profitable. 🙂
Agree with that sentiment. Tough call here. My charts signaling me to go back long, but the patterns being carved out can be interpreted as bearish. Plus with this break, it feels to soon to head back up for real. And COT just came out and commercials went further short and hedgies went further long, even after the move down into Tuesday. Should probably get flat for the weekend but against my better judgment will stay a small amount short
Hi Eli. Last week Friday it was a question of putting a stop and reverse at 1342. Gold price fell through. This week Friday, Gold price is weak below pivot and with a low range close, can expect some downside continuation on Monday possibly for a break below 1316 (or price may not get below invalidation mentioned by Lara?). Be cautious with the shorts though. A slow down in momentum suggests looking out for a rally although imo Gold price remains toppy under 1325 and further out under 1335. GL & happy days!
Gold Ichimoku Daily Analysis
Data as at 6:15 am EDT, September 15
================================
Gold prices surged after the market closed yesterday, possibly as a reaction to the much anticipated North Korean missile launch. However, the buying quickly dried up and prices retreated back to nearly unchanged. The early price action was a typical knee-jerk response into safe haven assets.
Prices reached a high of 1334.24, just over the daily tenkan-sen resistance of yesterday, but the rejection was disconcerting. It was not a good sign for the bulls: more downside could be expected. Evidently, the markets were in less of a panic than seen following previous tests, with the response to the test now key to market risk sentiment in today’s trading. This is more so because of Trump’s failure to respond. That the UN Security Council will convene on Friday at 1500 hours EDT would keep traders on their toes. As is also the possibility of a retaliatory move by Kim over the weekend.
The 1334 level will largely determine the market direction. A sustained move beyond that will signal the presence of buyers. This could drive the market into a resistance cluster at 1341 – 1342. However, it appears that the short-term trend is weak, and justifies a deeper pullback towards 1310. Should 1334 hold, then sellers will be dominant in the market. The first downside target is the Fibonacci level at 1325.30, followed by a support cluster at 1320. If 1320 fails to hold, then the next major Fibonacci level at 1312.30 will be next.
Personally, I would look for the bullish trend to resume on a sustained move above 1334.24, and for intraday selling to continue on a sustained move under 1334.24. Judging from the Daily Ichimoku Chart, I suspect today’s trading would not be exciting. The kumo is red until 7 pm EDT Sunday, which is when the international gold markets resume trading the following week. My conjecture of the polarising forces of increased UN sanctions vis-a-vis the whimsical mood of Kim Jong-Un could promote indecision on the part of traders.
Brilliant! Thank you so much. Echoing similar sentiments; expecting a pullback and with an ATR of $12-13, won’t be surprised if price goes down to 1312 level. Upside is toppy under 1335. An upside move is expecting though and will look to short at about 1340-41/SL1346 if price can get that far up which may happen if the boys in blue are looking for Friday/Monday gap fill lol….
total one to five waves how many points game please explain lara mam
stoploss closing base r jst trigging base lara madam