
With price closing below a long term bear market trend line, the analysis is today again changed.
Summary: Expect downwards movement now to continue at least for the short term. A short term target is at 1,300 to 1,297.
This downwards swing may go as low as 1,170 to 1,158.
New updates to this analysis are in bold.
Last monthly charts for the main wave count are here, another monthly alternate is here, and video is here.
Grand SuperCycle analysis is here.
FIRST ELLIOTT WAVE COUNT
WEEKLY CHART
Click chart to enlarge.
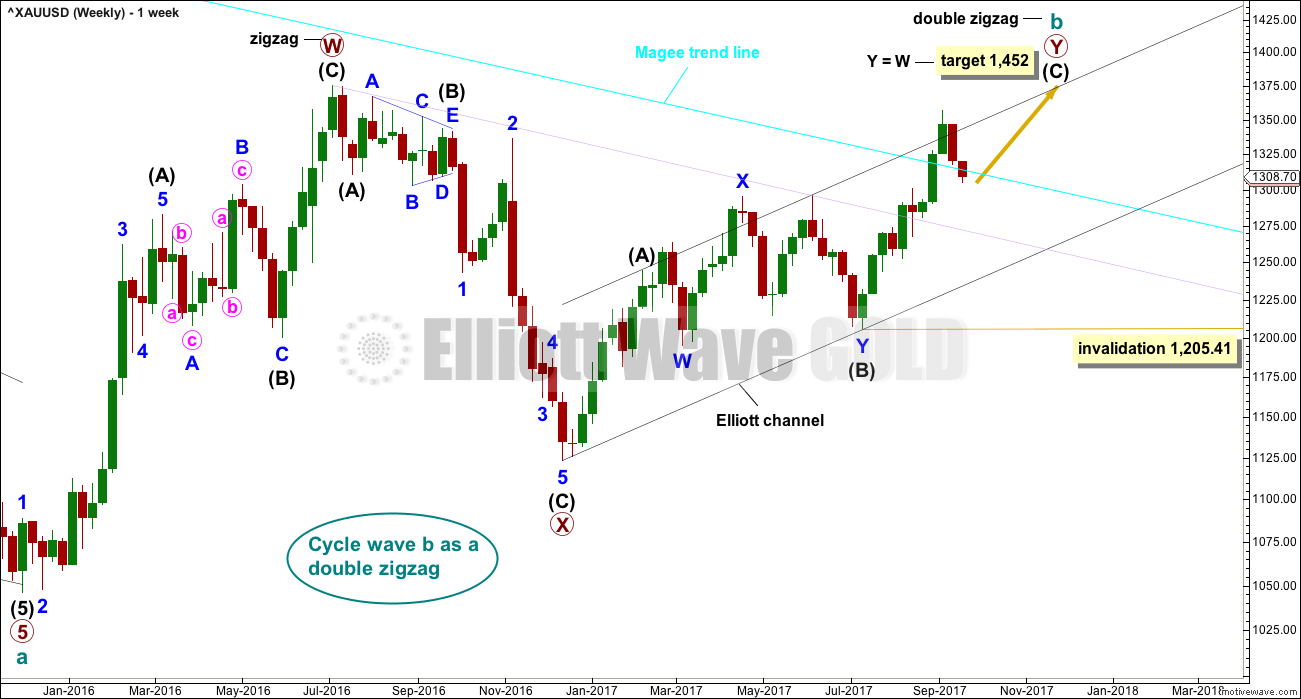
There was strong technical support for this wave count up until today. The full weekly candlestick above the long term Magee bear market trend line had to be interpreted as very bullish; this trend line goes back to 2011 and was repeatedly tested. However, price has closed back below the trend line today. The trend line did not offer any support, which was expected. It appears that this line is not working as it should and no longer offers any support or resistance. The rationale for swapping the wave counts over when the line was breached is no longer valid.
The wave counts will be labelled first and second. Classic technical analysis will be used to determine which wave count looks to be more likely.
There are more than 23 possible corrective structures that B waves may take, and although cycle wave b still fits well at this stage as a triangle, it may still be another structure. This wave count looks at the possibility that it may be a double zigzag.
If cycle wave b is a double zigzag, then current upwards movement may be part of the second zigzag in the double, labelled primary wave Y.
The target remains the same.
Within intermediate wave (C), no second wave correction may move beyond the start of its first wave below 1,205.41.
There are two problems with this wave count which reduce its probability in terms of Elliott wave:
1. Cycle wave b is a double zigzag, but primary wave X within the double is deep and time consuming. While this is possible, it is much more common for X waves within double zigzags to be brief and shallow.
2. Intermediate wave (B) within the zigzag of primary wave Y is a double flat correction. These are extremely rare, even rarer than running flats. The rarity of this structure must further reduce the probability of this wave count.
DAILY CHART
Click chart to enlarge.
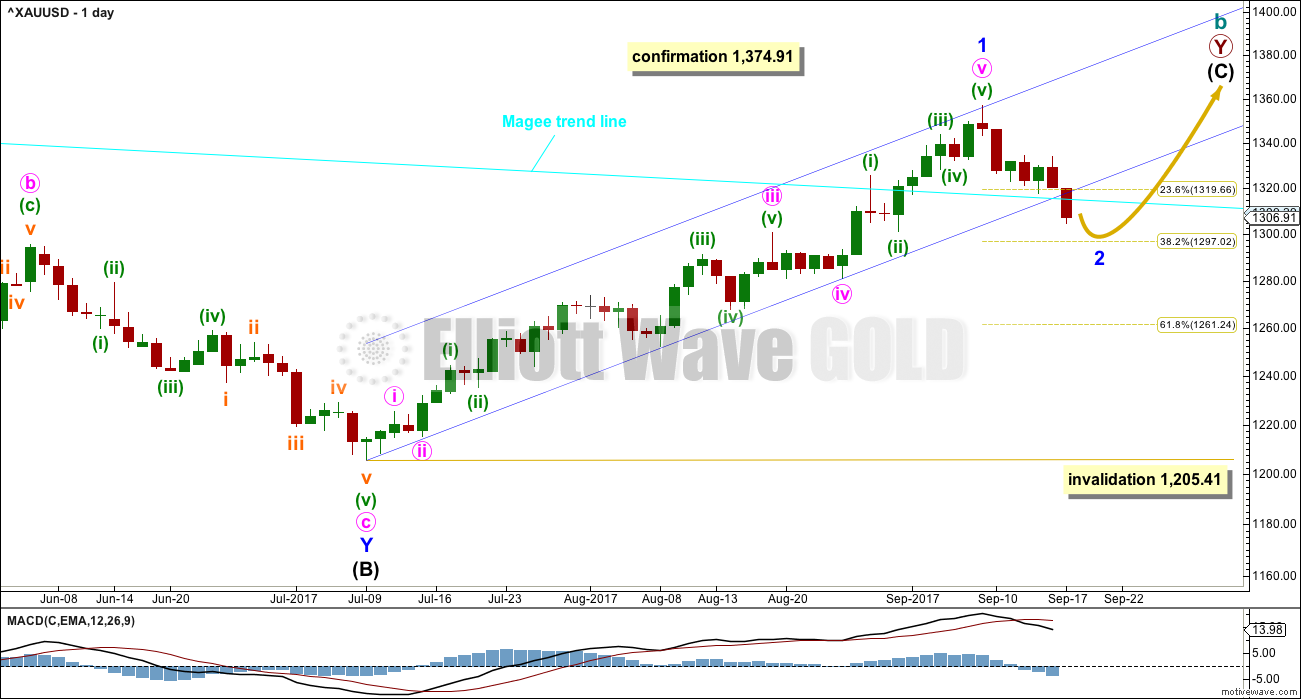
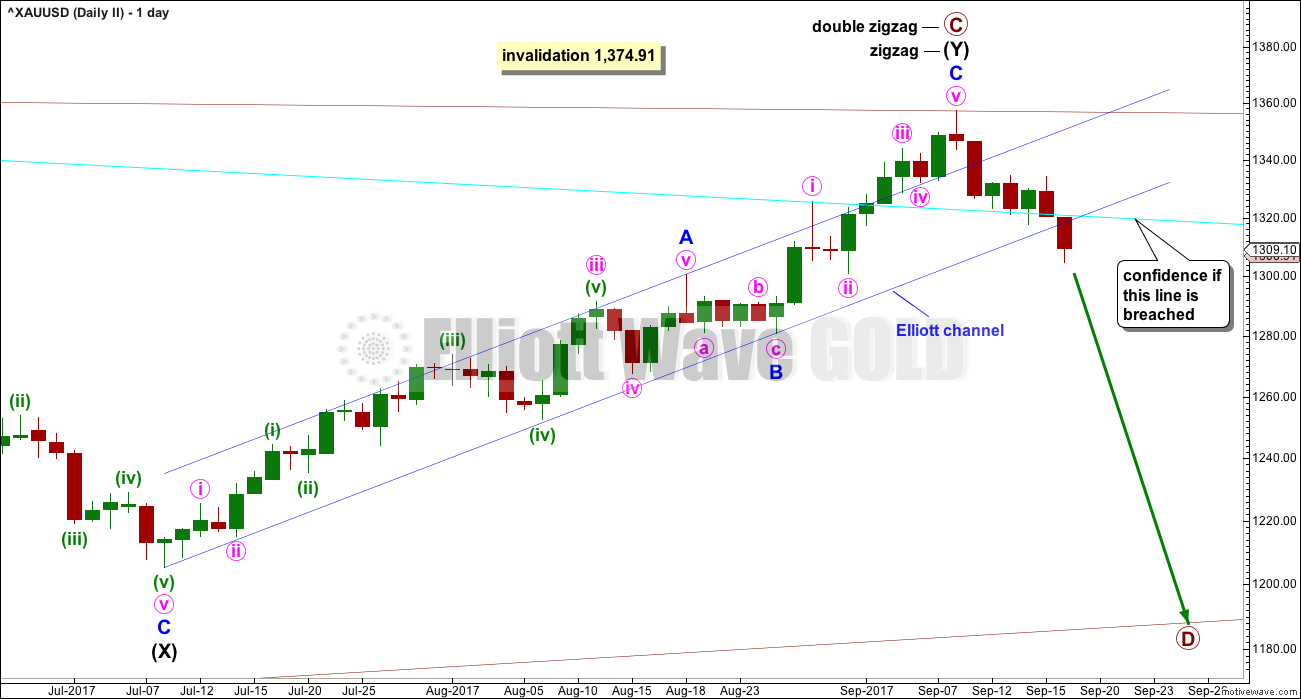
The analysis will focus on the structure of intermediate wave (C). To see details of all the bull movement for this year see daily charts here.
Intermediate wave (C) must be a five wave structure, either an impulse or an ending diagonal. It is unfolding as the more common impulse.
With the current pullback no longer remaining within a channel drawn about the prior upwards wave, this looks like a new wave separate to the last wave up. Labelling the last wave up and now this pullback at the same degree looks more correct.
It is possible that minor wave 1 may have been over at the last high and the current pullback may be minor wave 2. Minor wave 2 may not move beyond the start of minor wave 1 below 1,205.41.
The target for minor wave 2 is calculated at the hourly chart level. If it is wrong it may not be low enough. A lower target at the 0.618 Fibonacci ratio of minor wave 1 about 1,261 may also be possible.
HOURLY CHART
Click chart to enlarge.
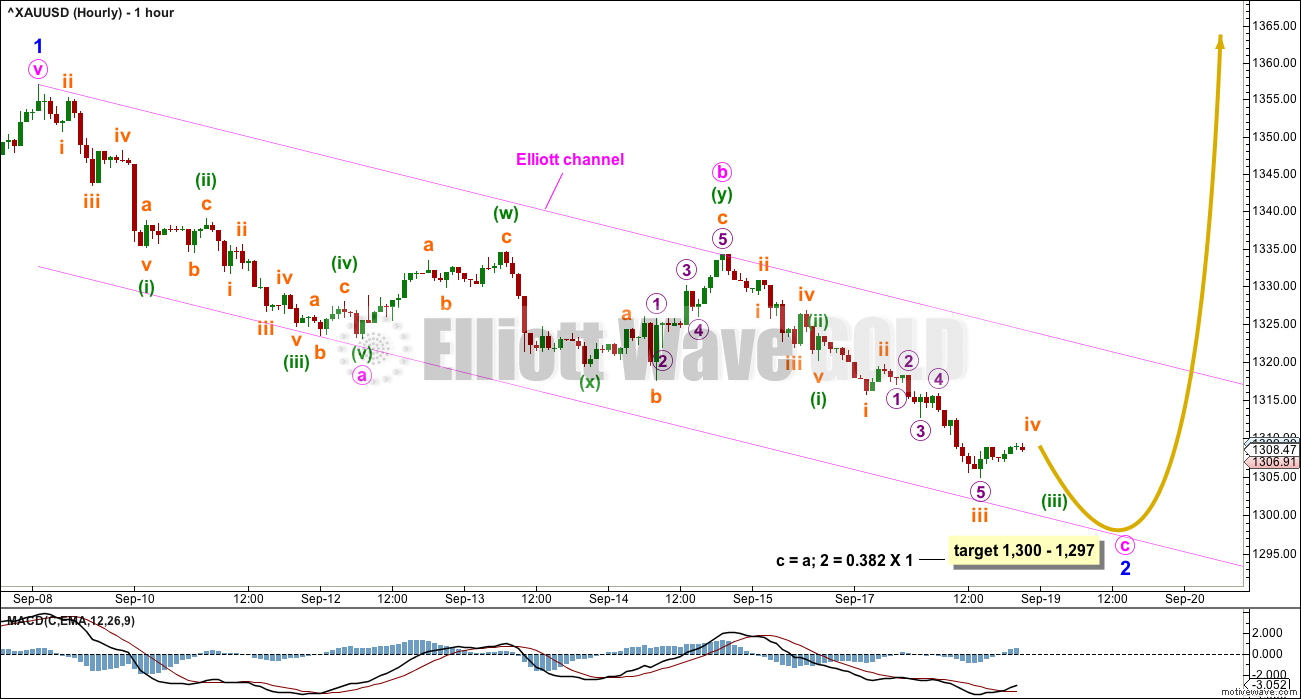
Minor wave 2 may be unfolding as a single zigzag, which is one of the most common structures for a second wave.
Minute wave b may have completed as a double combination: zigzag – X – flat.
The target is a $3 zone calculated at two wave degrees.
Price should remain with the Elliott channel while minor wave 2 continues. If this channel is breached by upwards movement, that shall be an early indicator that minor wave 2 may be over.
If this wave count is correct, then when this pullback is complete then a third wave up should unfold.
SECOND ELLIOTT WAVE COUNT
WEEKLY CHART
Click chart to enlarge.
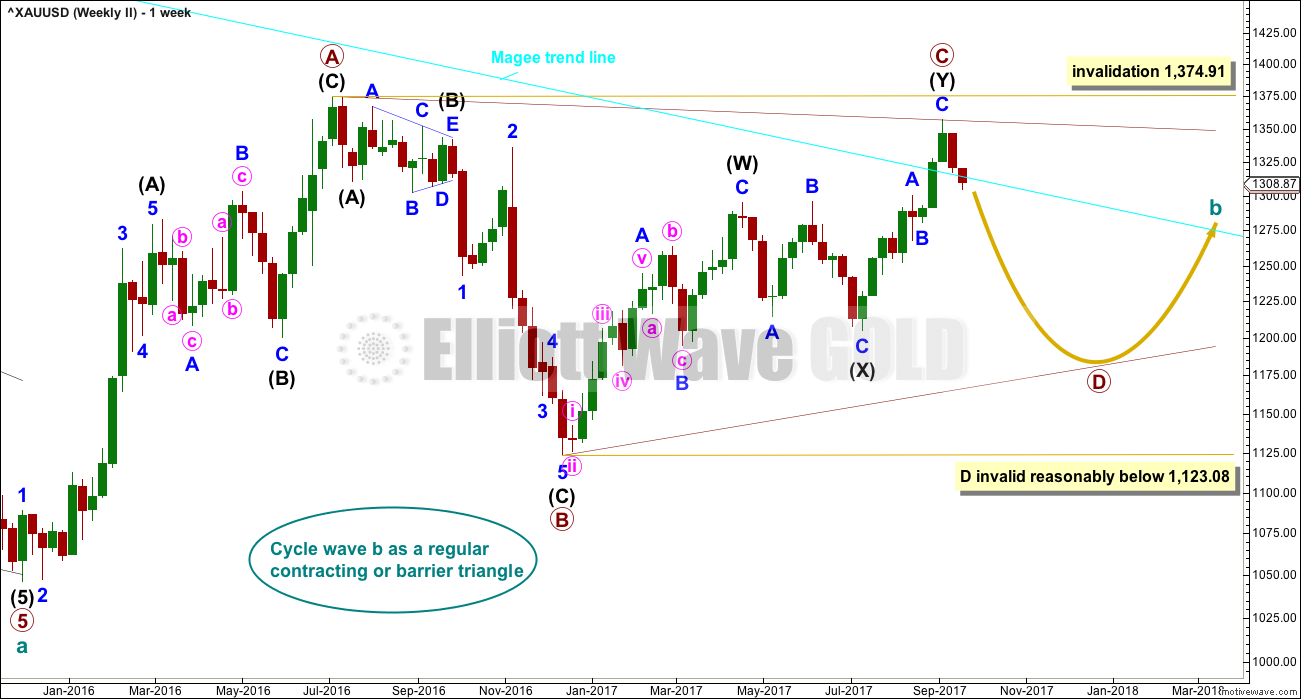
The Magee bear market trend line is no longer working as expected: price has closed back below it and the trend line is not offering support or resistance. This trend line has failed.
The Magee bear market trend line is drawn from the all time high for Gold on the 6th of September, 2011, to the first major swing high within the following bear market on the 5th of October, 2012.
Within a triangle, one sub-wave should be a more complicated multiple, which may be primary wave C. This is the most common sub-wave of the triangle to subdivide into a multiple.
Intermediate wave (Y) now looks like a complete zigzag at the weekly chart level.
Primary wave D of a contracting triangle may not move beyond the end of primary wave B below 1,123.08. Contracting triangles are the most common variety.
Primary wave D of a barrier triangle should end about the same level as primary wave B at 1,123.08, so that the B-D trend line remains essentially flat. This involves some subjectivity; price may move slightly below 1,123.08 and the triangle wave count may remain valid. This is the only Elliott wave rule which is not black and white.
Finally, primary wave E of a contracting or barrier triangle may not move beyond the end of primary wave C above 1,295.65. Primary wave E would most likely fall short of the A-C trend line. But if it does not end there, then it can slightly overshoot that trend line.
Primary wave A lasted 31 weeks, primary wave B lasted 23 weeks, and primary wave C started its 38th week. A double zigzag may be expected to be longer lasting than single zigzags within a triangle, and so this continuation of primary wave C is entirely acceptable and leaves the wave count with the right look at this time frame.
With upwards movement continuing, the A-C trend line now has too weak a slope. At this stage, this is now a problem for this wave count, the upper A-C trend line no longer has such a typical look.
DAILY CHART
Click chart to enlarge.
A clear and strong breach today below the blue Elliott channel about intermediate wave (Y) indicates that upwards movement should be over and a new wave down should have begun.
This second wave count expects the new wave down may be deeper and longer lasting than the first wave count allows for.
A common length for triangle sub-waves is from 0.8 to 0.85 the length of the prior wave. Primary wave D would reach this range from 1,170 to 1,158.
If primary wave C is correctly labelled as a double zigzag, then primary wave D must be a single zigzag.
HOURLY CHART
Click chart to enlarge.
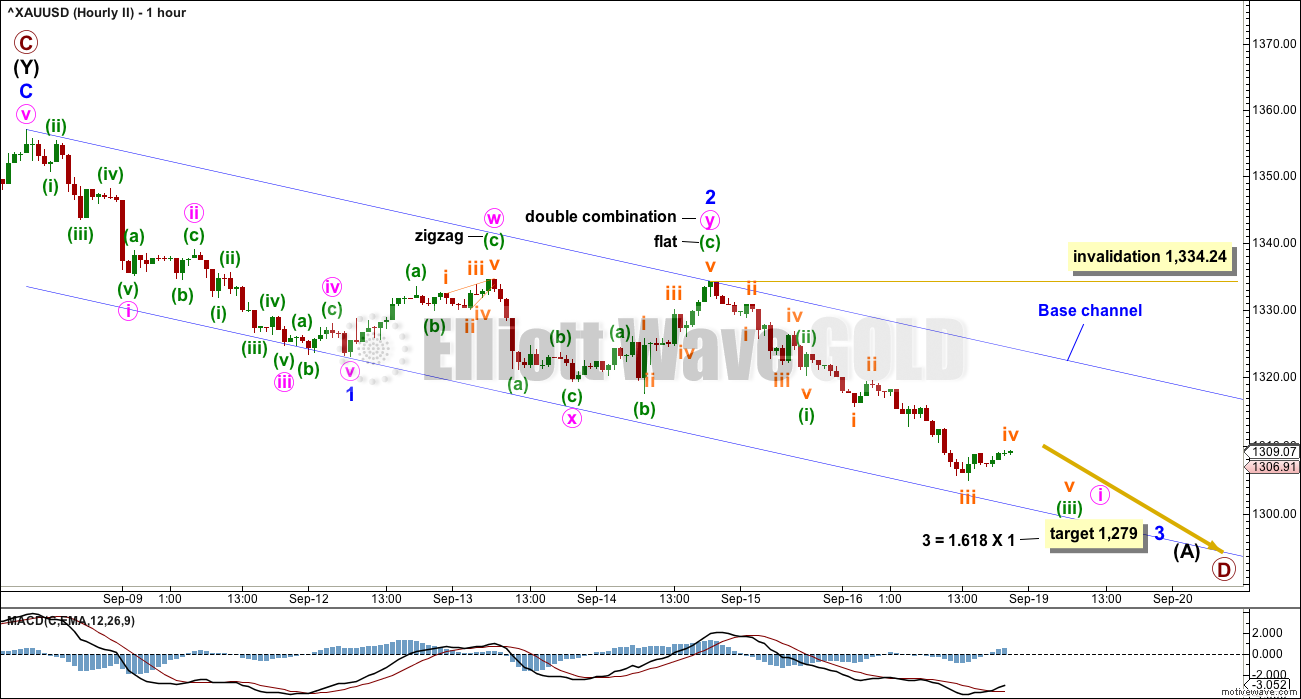
1-2-3 of an unfolding impulse and a-b-c of a zigzag have exactly the same subdivisions: 5-3-5. Subdivisions of downwards movement are seen in the same way for both hourly wave counts.
Here, the target is lower. Minor wave 3 may reach a common Fibonacci ratio to minor wave 1.
Within minor wave 3, minute wave ii may not move beyond the start of minute wave i above 1,334.24.
The base channel is exactly the same as the Elliott channel on the first wave count. If this second wave count is correct, then along the way down corrections should find resistance about the upper edge of the base channel.
A third wave should have the power to break below a base channel. If price does break below the lower trend line, that shall offer a little confidence in this wave count.
TECHNICAL ANALYSIS
WEEKLY CHART
Click chart to enlarge. Chart courtesy of StockCharts.com.
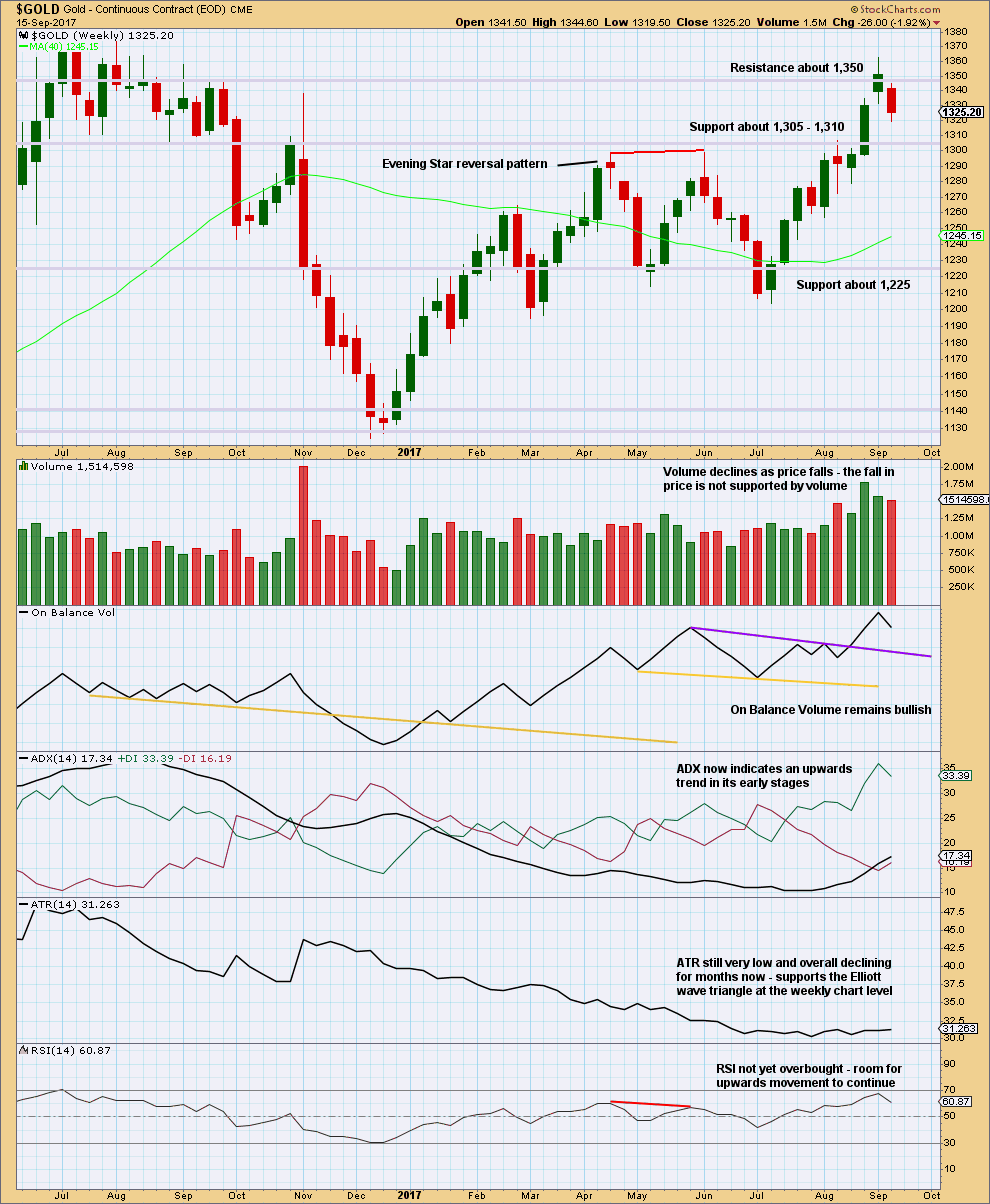
Last weekly candlestick completes as very bearish. It is not engulfing the prior weekly candlestick, but it is even more bearish than that. The week gaps open lower and then closes well below the prior weekly candlestick. Bears dominated last week. They managed to pull price down to new lows substantially below the prior week, closing below the lower wick of the week before.
This candlestick supports the second Elliott wave count.
ADX and On Balance Volume however remain very bullish.
DAILY CHART
Click chart to enlarge. Chart courtesy of StockCharts.com.
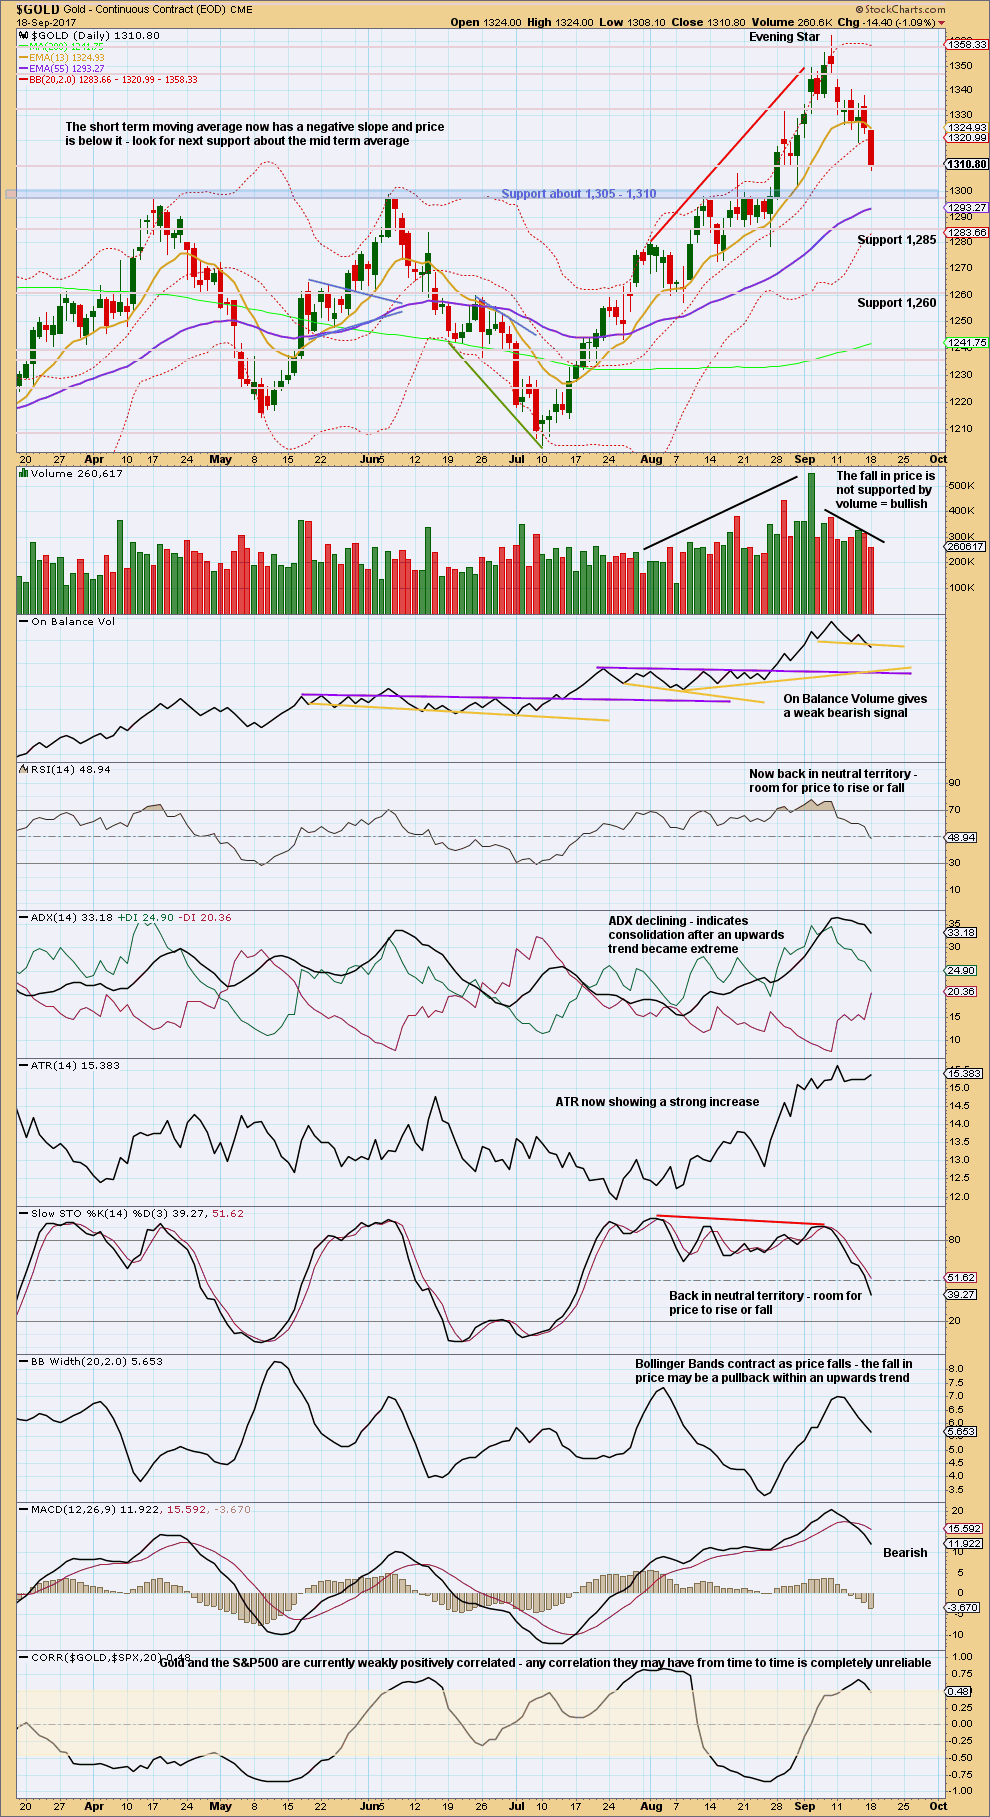
On Balance Volume today gives a bearish signal. The outlook may now be more bearish.
Look now for strong support about 1,310 to 1,305.
Volume is still bullish. If volume begins to increase as price falls, then this view could change. But for now volume is declining as price falls. This is typical of a pullback or consolidation within a larger ongoing bull trend.
The pullback has brought RSI and Stochastics down from extreme, but ADX is still not down below the directional lines. ADX still indicates a consolidation or pullback.
With this pullback not finding support at the short term moving average, the next mid term moving average may now be used for support.
GDX
DAILY CHART
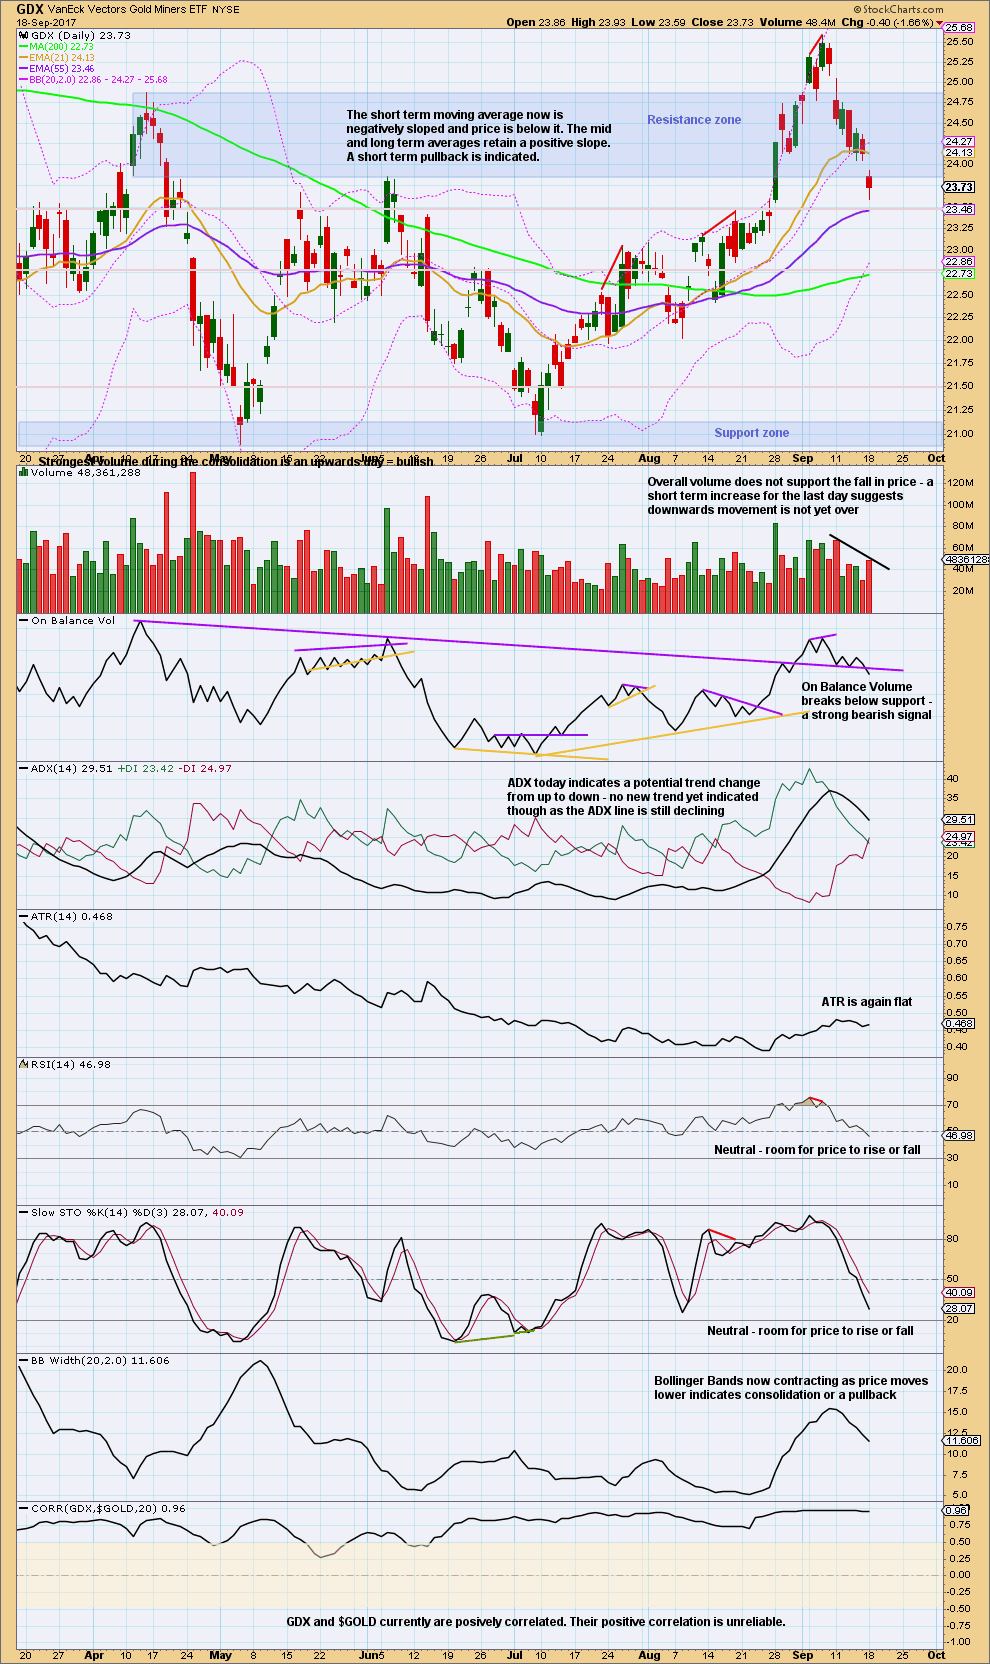
Click chart to enlarge. Chart courtesy of StockCharts.com.
A gap lower and another downwards day with some increase in volume is more bearish.
Price is now back within the large consolidation zone. Tahe upwards breakout thought to have occurred is now proven to be false.
Look for price to keep falling until it finds support and Stochastics is oversold at the same time. An end to this downwards swing may only be seen when Stochastics has been oversold and then exhibits some divergence with price.
GOLD THIRD WAVE EXAMPLE – DAILY CHART
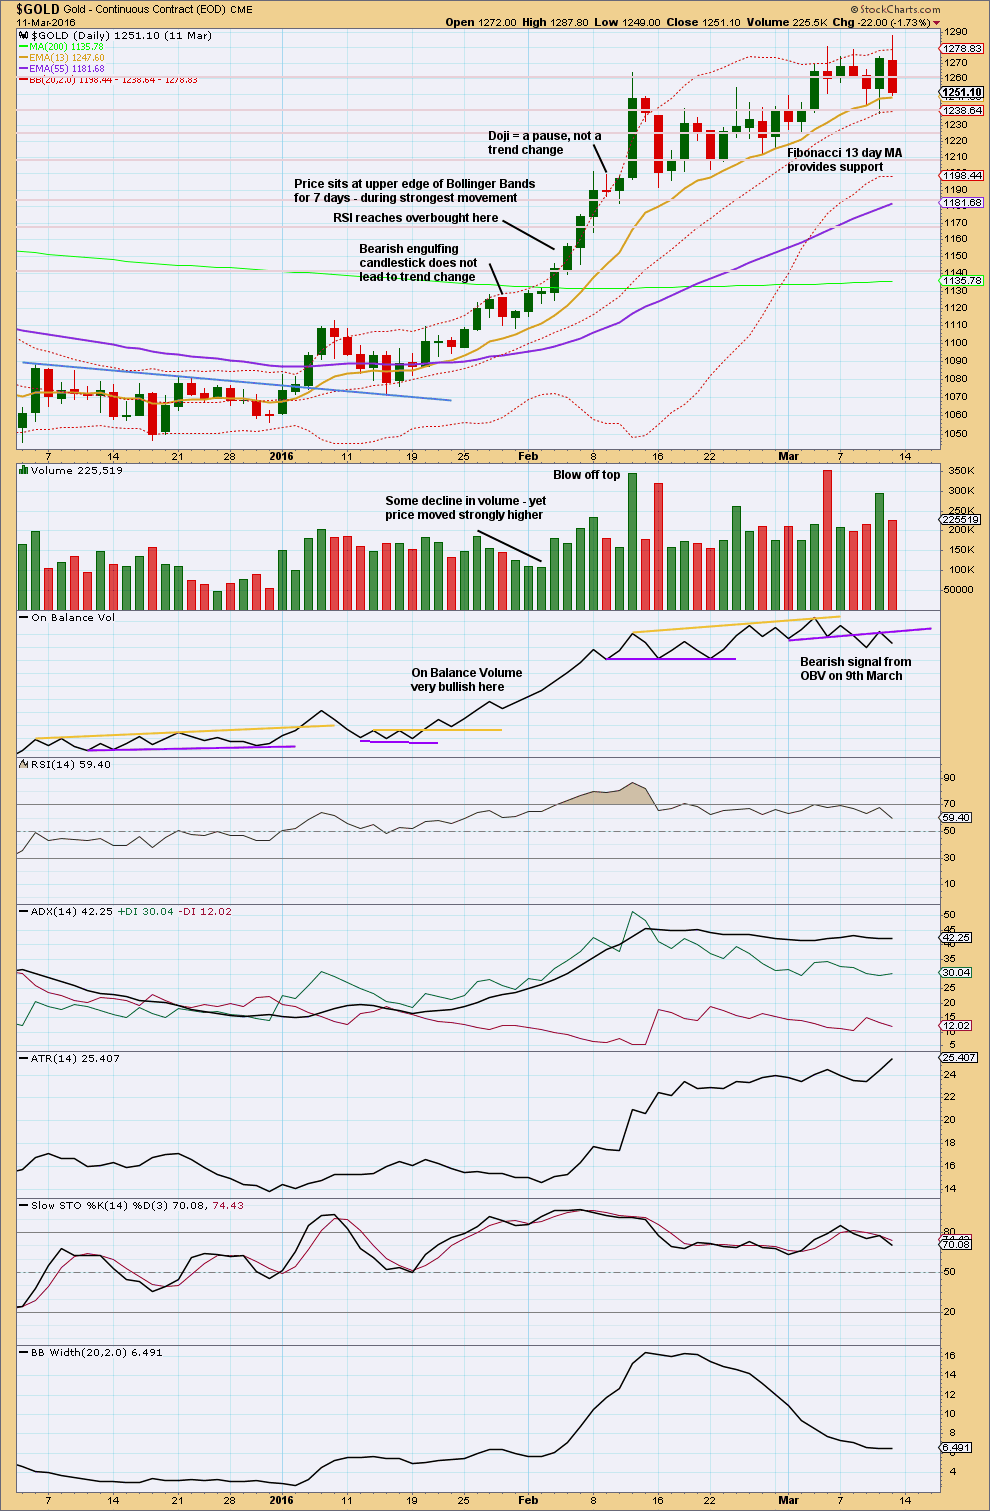
Click chart to enlarge. Chart courtesy of StockCharts.com.
This section will be left at the end of analysis until either the current wave count is proven wrong, or the third wave we are expecting has completed.
This chart has been published before. It shows the most recent example of a strong third wave in Gold from December 2015 to March 2016.
Note that during this strong upwards trend:
– RSI first reached overbought on the 4th of February and price then continued strongly higher for five more days culminating in a blowoff top on the 11th of February.
– RSI and Stochastics remained extreme for most of the second half of the trend. At the final high, they both exhibited strong divergence with price.
– Price found support at the short term Fibonacci 13 day moving average during the entire trend.
– All signals from On Balance Volume were bullish right up to the end of the trend. The 9th of March shows the first bearish signal, which was an important warning of a trend change.
– The trend begins with choppy overlapping and some hesitancy.
– The 6th of January was an important upwards breakout from resistance, with support from volume. Thereafter, price moved more strongly.
– While overall volume supported the upwards movement in price, this was not linear. Some weaker days occurred yet price continued higher. It is the overall trend of volume which is more important than any one or two days. On Balance Volume remaining bullish was an important guide.
No two waves are the same. So if the current wave count is correct, it may be different from this example. However, there are some important lessons to be learned here:
1. On Balance Volume is an important guide. Bullish signals should be taken seriously, particularly early on in the trend. Later in the trend, with RSI and Stochastics overbought, any bearish signal from On Balance Volume should see long positions closed.
2. RSI and Stochastics can reach extreme overbought. Only when they have been extreme for some time and then exhibit strong divergence should it be taken as a warning of a trend change.
Today for the current upwards wave there has been a bearish signal from On Balance Volume while RSI and Stochastics had reached extreme and exhibited divergence. If the past lesson from this example is correct, then the current upwards wave should now be considered over.
Published @ 10:41 p.m. EST.
First hourly chart updated:
A small correction should find resistance at the upper pink trend line, if the trend at least short – mid term remains down.
Miserly inside day so far. Not much in it yet for the longs with 5dma (resistive) having crossed below both 10dma & 20dma. Possible bear flag on the 4-hourly?
So here’s a bearish chart for the miners. Why?
Look at the chart for GDX posted previously below. GDX made a strong move up from July to the beginning of September. Now look at this ratio chart comparing GDXJ to GDX. For the same time period, GDXJ underperformed GDX. That’s bearish. In a healthy market, the junior miners, GDXJ should outperform the senior miners, GDX.
i hve no charts but i know mcx resistance price cani i explain
Please could you elaborate on “mcx resistance”
If the words are difficult, you could upload a chart?
“A picture tells a thousand words”
Lara.
MCX is the Multi Commodity Exchange of India, based in Mumbai. They deal with futures in bullion, non-ferrous metals, energy, and some agricultural products. I think it is similar to COMEX in scope.
They do have a live gold platform. I don’t know whether Viky refers to the gold price or the exchange index.
Maybe he is making an assumption about MCX and Gold spot price? They may or may not be correlated, and you know how I am on assumptions. I really don’t like them, I’d rather rely on math.
Viky: Stockcharts have a nice tool to see if two markets are correlated or not.
On a chart of MCX.IN or $GOLD choose from indicators > correlation > input the market > update
I’ve just checked, and MCX.IN and $GOLD do not have a reliable correlation. While their correlation coefficient is currently 0.75 indicating a current positive correlation, this fluctuates from positive to negative and spends more time between 0.5 and -0.5 then it does above or below.
In short, there is absolutely no reliable correlation between them.
And so if your analysis which told you that $GOLD will fall this week was based upon an assumption of a correlation between $GOLD and MCX.IN then it is luck, and not math.
I’ll add the correlation today to the end of the technical analysis chart so you can see what I mean in pictures.
Just in case, I dusted off a triangle chart that I thought was no longer needed. Should Gold take a more bearish path, then this is a very possible count for GDX.
A move below 23.06 will increase the probability of this count.
https://www.tradingview.com/x/GWBI6Z5p/
“dusted off a triangle chart”
Yep. That sounds familiar Dreamer! I’m busy doing some dusting off of my own for US Oil. Not easy 🙁
How about seeing primary C moving higher? That would give it a better slope, and make the triangle look more normal.
But triangles are such tricky beasts to get right! Excellent efforts Dreamer. Much appreciated. Thank you.
Certainly, Primary C could move higher if Gold decides on a move to new highs.
Today was a rough day for GDX. Gap down with a volume increase and a bearish signal from OBV. The base channel failed to act as support. At least some more downward movement is expected. There is still room for price to move down as the invalidation point is 23.06.
On the positive side, the 50MA and 200MA still have positive upward slopes. If this count is correct, price will likely turn back upward by Wednesday.
https://www.tradingview.com/x/BO7dZhV2/
lara mam wat about my idea is correct r wrong
Viky, Lara wants to know the reasoning (analysis) behind your ideas. Please share charts or other analysis with your ideas. That way we can all learn from others. Thanks,
Without seeing what analysis led you to your conclusion, I have no idea if it’s correct or not.
It’s just a prediction, not an analysis.
What technical methods do you use? Support and resistance? Stochastics? Moving averages? Something else?
In comments you will find various technical analysis from members here. When they post their analysis and reasons for predictions we all learn new ideas. It is the sharing of ideas which makes this community so valuable.
We could all make comments about what direction we think the market may move in (up or down) and we would all be right about half the time. But with no reason for the prediction it’s really of not much use to anyone.
Does that make sense Viky?
I don’t want to put you off from commenting at all, and we are all richer when members engage. I only wish for you to add your reasons for your prediction.