
A small inside day sees the target for one of the two Elliott wave counts adjusted. This new target is now closer to the target for the other Elliott wave count.
Summary: Expect downwards movement now to continue at least for the short term. A short term target is at 1,261.
Use the channels drawn on the hourly charts (they are the same). Expect price to keep falling while it remains within the channel. If that channel is breached by upwards movement, expect a big bounce. The upper edge of the channel may be used to place trailing stops for shorts.
This downwards swing may go as low as 1,170 to 1,158.
Always trade with stops and invest only 1-5% of equity on any one trade.
New updates to this analysis are in bold.
Last monthly charts for the main wave count are here, another monthly alternate is here, and video is here.
Grand SuperCycle analysis is here.
The wave counts will be labelled first and second. Classic technical analysis will be used to determine which wave count looks to be more likely.
FIRST ELLIOTT WAVE COUNT
WEEKLY CHART
Click chart to enlarge.
The Magee bear market trend line is removed from all charts today because it has clearly failed. It is no longer showing where price is finding resistance or support, and so it is no longer of any technical significance.
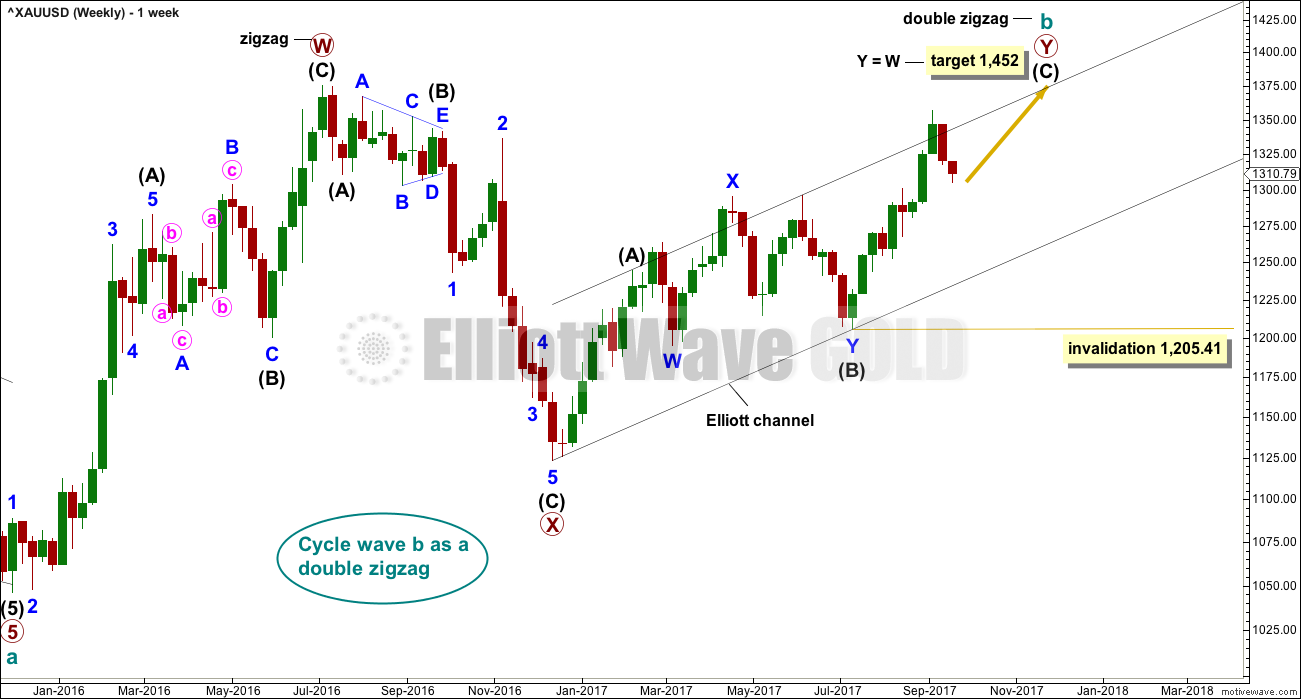
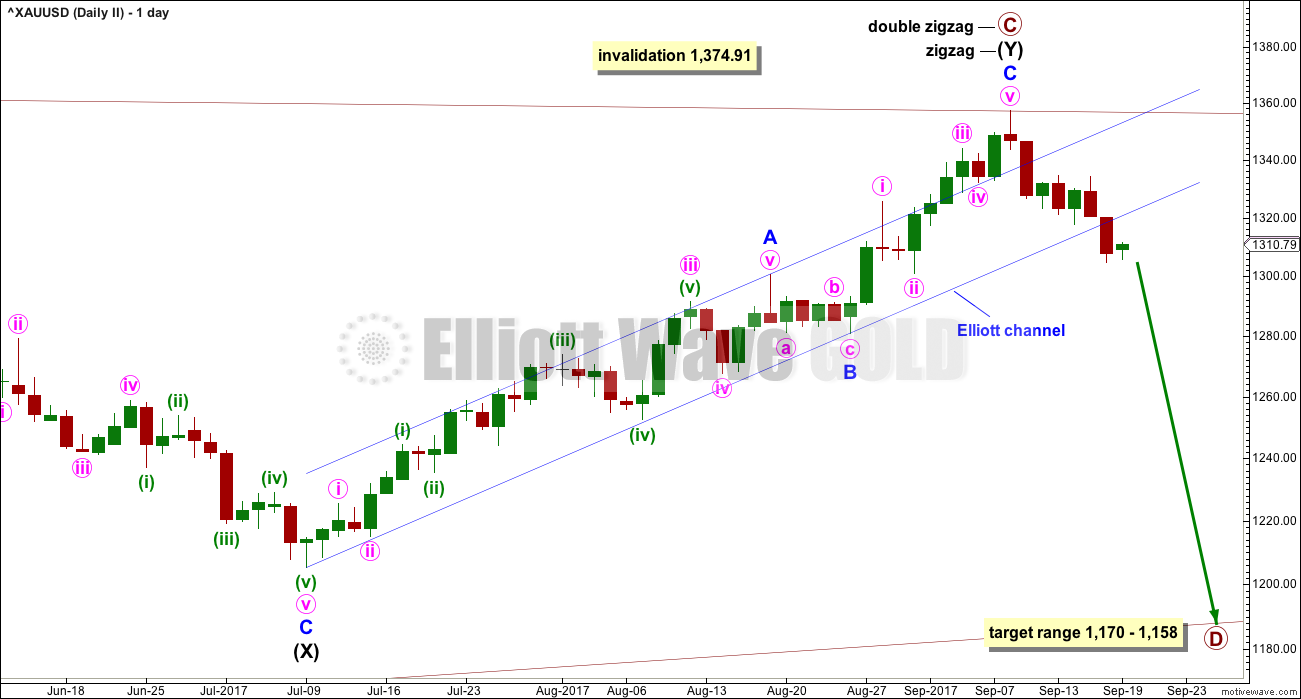
There are more than 23 possible corrective structures that B waves may take, and although cycle wave b still fits well at this stage as a triangle, it may still be another structure. This wave count looks at the possibility that it may be a double zigzag.
If cycle wave b is a double zigzag, then current upwards movement may be part of the second zigzag in the double, labelled primary wave Y.
The target remains the same.
Within intermediate wave (C), no second wave correction may move beyond the start of its first wave below 1,205.41.
There are two problems with this wave count which reduce its probability in terms of Elliott wave:
1. Cycle wave b is a double zigzag, but primary wave X within the double is deep and time consuming. While this is possible, it is much more common for X waves within double zigzags to be brief and shallow.
2. Intermediate wave (B) within the zigzag of primary wave Y is a double flat correction. These are extremely rare, even rarer than running flats. The rarity of this structure must further reduce the probability of this wave count.
DAILY CHART
Click chart to enlarge.
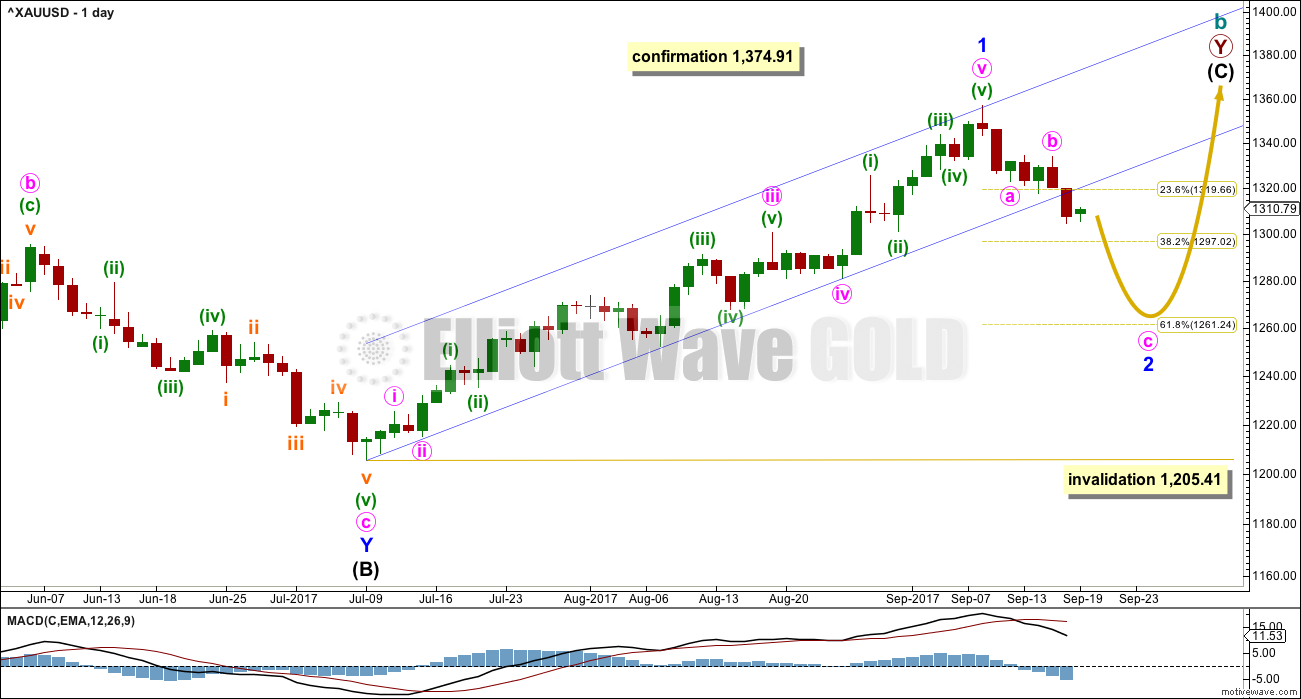
The analysis will focus on the structure of intermediate wave (C). To see details of all the bull movement for this year see daily charts here.
Intermediate wave (C) must be a five wave structure, either an impulse or an ending diagonal. It is unfolding as the more common impulse.
With the current pullback no longer remaining within a channel drawn about the prior upwards wave, this looks like a new wave separate to the last wave up. Labelling the last wave up and now this pullback at the same degree looks more correct.
It is possible that minor wave 1 may have been over at the last high and the current pullback may be minor wave 2. Minor wave 2 may not move beyond the start of minor wave 1 below 1,205.41.
The target for minor wave 2 is calculated at the hourly chart level. If it is wrong it may not be low enough. A lower target at the 0.618 Fibonacci ratio of minor wave 1 about 1,261 may also be possible.
HOURLY CHART
Click chart to enlarge.
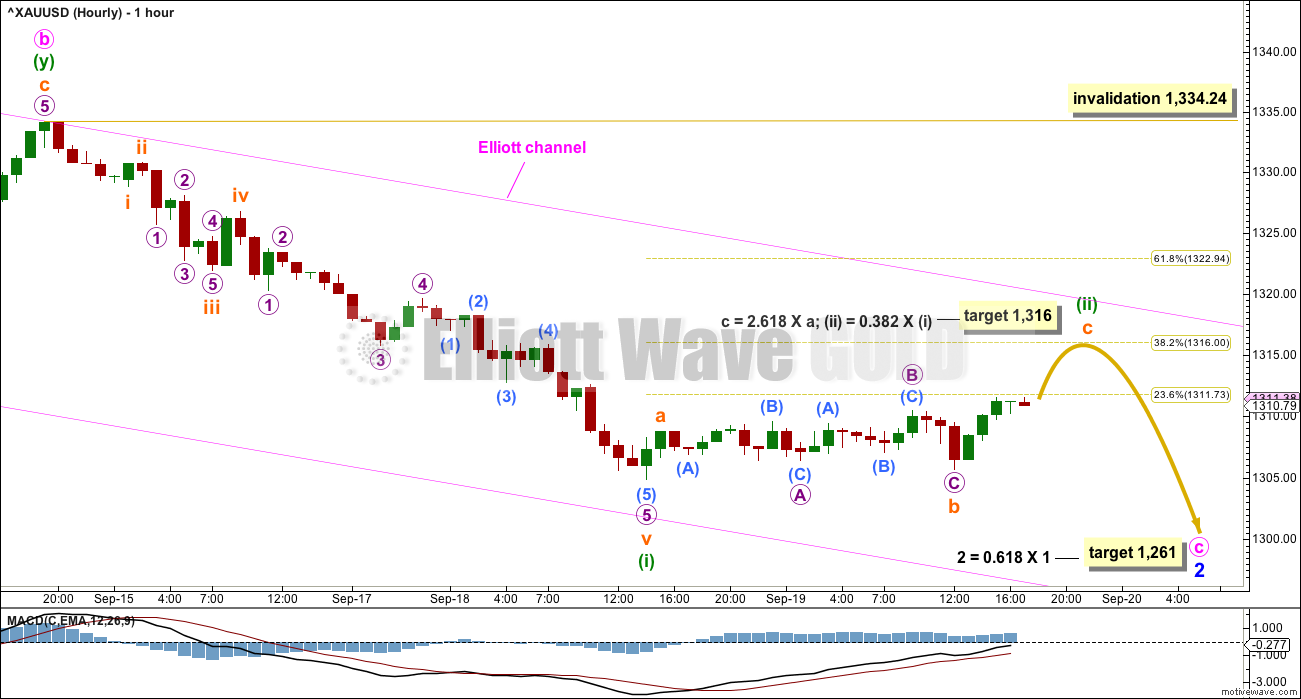
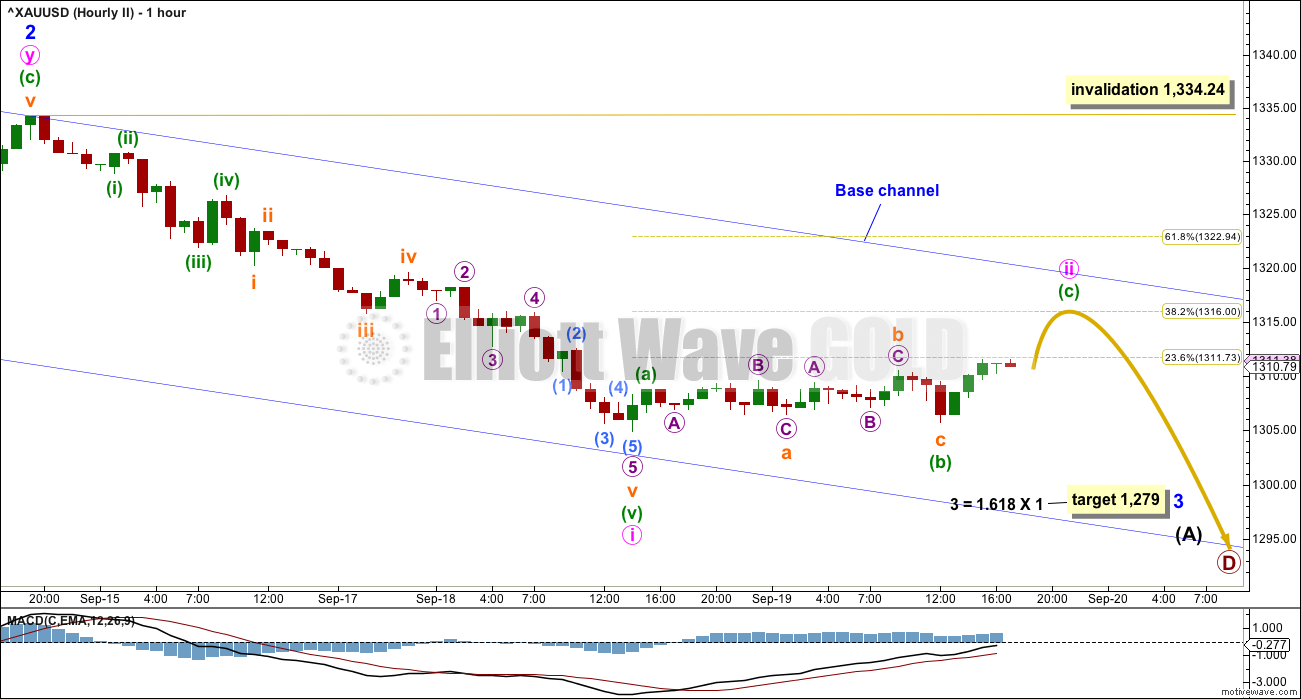
Minor wave 2 may be unfolding as a single zigzag, which is one of the most common structures for a second wave.
The target is recalculated today. While it is possible that minor wave 2 was over at yesterday’s low, this would see a very shallow and brief second wave correction. It would be better to expect it to be have a more typical look. The target given yesterday is now too close. If only minuette wave (i) within minute wave c is complete, then there would not be enough room for the structure to continue to reach yesterday’s target.
Minor wave 1 lasted 44 days in total. So far minor wave 2 has only lasted 7 days. It should be expected to last longer than this for the wave count to have good proportions.
Price should remain with the Elliott channel while minor wave 2 continues. If this channel is breached by upwards movement, that shall be an early indicator that minor wave 2 may be over.
If this wave count is correct, then when this pullback is complete then a third wave up should unfold.
Minuette wave (ii) may not move beyond the start of minuette wave (i) above 1,334.24.
SECOND ELLIOTT WAVE COUNT
WEEKLY CHART
Click chart to enlarge.
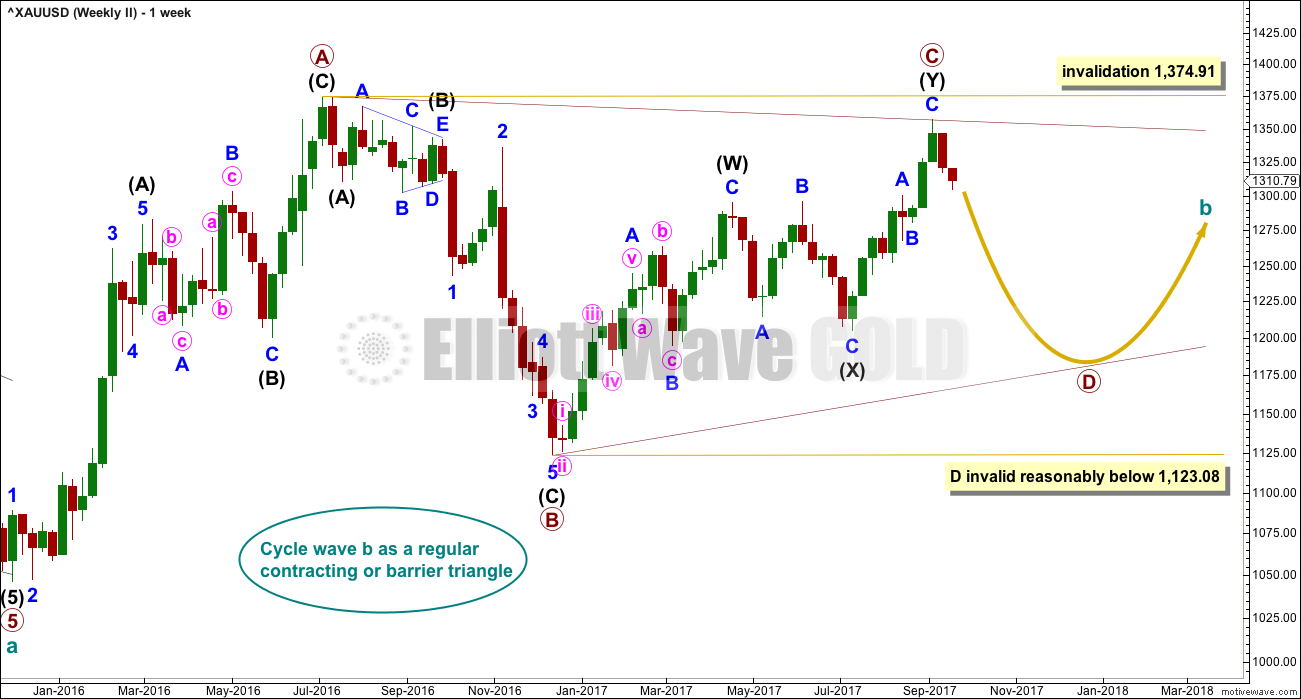
With the failure of the Magee bear market trend line (now removed), it is again a reasonable possibility that cycle wave b is continuing sideways as a triangle.
Within a triangle, one sub-wave should be a more complicated multiple, which may be primary wave C. This is the most common sub-wave of the triangle to subdivide into a multiple.
Intermediate wave (Y) now looks like a complete zigzag at the weekly chart level.
Primary wave D of a contracting triangle may not move beyond the end of primary wave B below 1,123.08. Contracting triangles are the most common variety.
Primary wave D of a barrier triangle should end about the same level as primary wave B at 1,123.08, so that the B-D trend line remains essentially flat. This involves some subjectivity; price may move slightly below 1,123.08 and the triangle wave count may remain valid. This is the only Elliott wave rule which is not black and white.
Finally, primary wave E of a contracting or barrier triangle may not move beyond the end of primary wave C above 1,295.65. Primary wave E would most likely fall short of the A-C trend line. But if it does not end there, then it can slightly overshoot that trend line.
Primary wave A lasted 31 weeks, primary wave B lasted 23 weeks, and primary wave C started its 38th week. A double zigzag may be expected to be longer lasting than single zigzags within a triangle, and so this continuation of primary wave C is entirely acceptable and leaves the wave count with the right look at this time frame.
With upwards movement continuing, the A-C trend line now has too weak a slope. At this stage, this is now a problem for this wave count, the upper A-C trend line no longer has such a typical look.
DAILY CHART
Click chart to enlarge.
A clear and strong breach below the blue Elliott channel about intermediate wave (Y) indicates that upwards movement should be over and a new wave down should have begun.
This second wave count expects the new wave down may be deeper and longer lasting than the first wave count allows for.
A common length for triangle sub-waves is from 0.8 to 0.85 the length of the prior wave. Primary wave D would reach this range from 1,170 to 1,158.
If primary wave C is correctly labelled as a double zigzag, then primary wave D must be a single zigzag.
HOURLY CHART
Click chart to enlarge.
1-2-3 of an unfolding impulse and a-b-c of a zigzag have exactly the same subdivisions: 5-3-5. Subdivisions of downwards movement are seen in the same way for both hourly wave counts.
Minor wave 3 may reach a common Fibonacci ratio to minor wave 1.
Within minor wave 3, minute wave ii may not move beyond the start of minute wave i above 1,334.24.
The base channel is exactly the same as the Elliott channel on the first wave count. If this second wave count is correct, then along the way down corrections should find resistance about the upper edge of the base channel.
A third wave should have the power to break below a base channel. If price does break below the lower trend line, that shall offer a little confidence in this wave count.
TECHNICAL ANALYSIS
WEEKLY CHART
Click chart to enlarge. Chart courtesy of StockCharts.com.
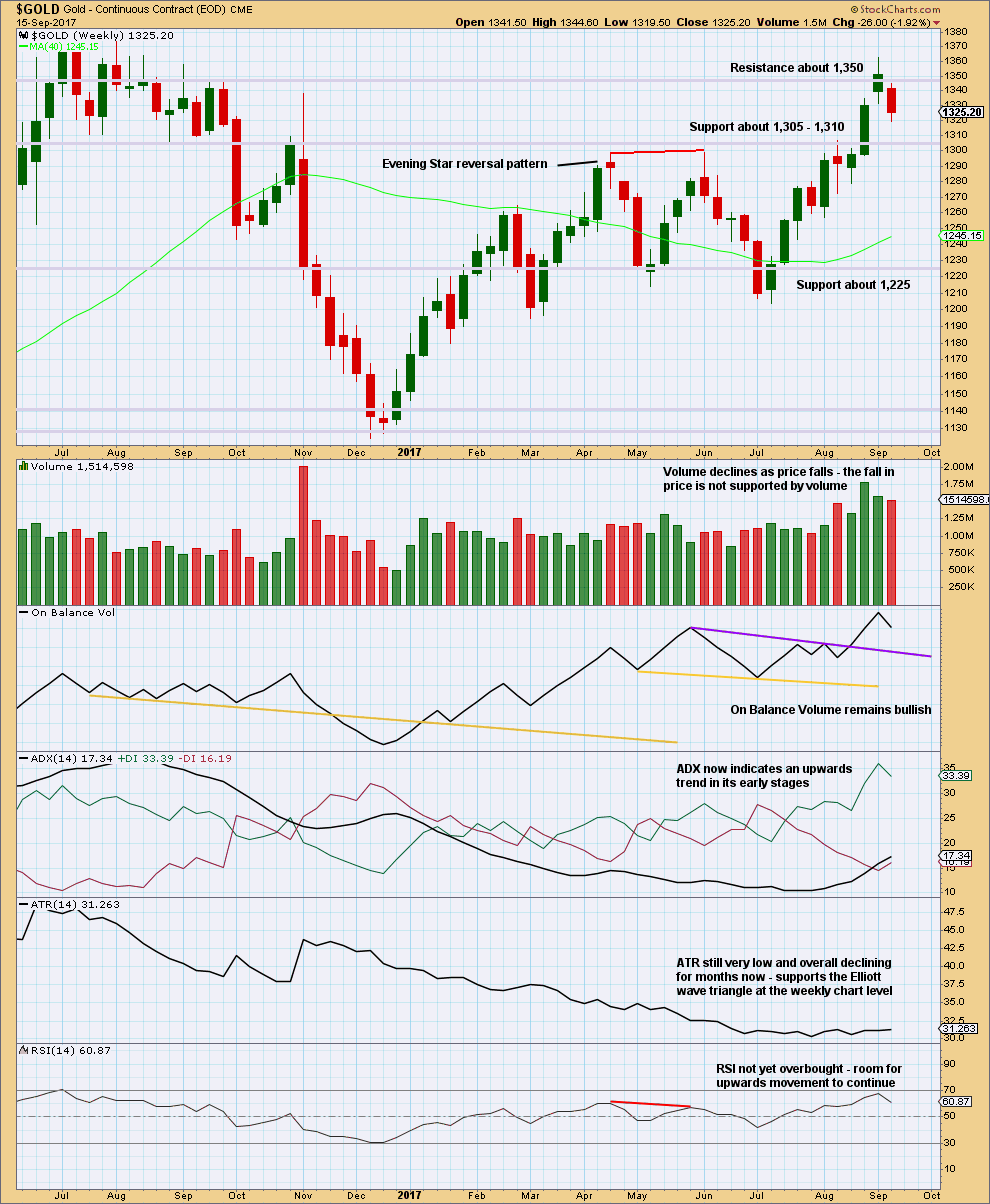
Last weekly candlestick completes as very bearish. It is not engulfing the prior weekly candlestick, but it is even more bearish than that. The week gaps open lower and then closes well below the prior weekly candlestick. Bears dominated last week. They managed to pull price down to new lows substantially below the prior week, closing below the lower wick of the week before.
This candlestick supports the second Elliott wave count.
ADX and On Balance Volume however remain very bullish.
DAILY CHART
Click chart to enlarge. Chart courtesy of StockCharts.com.
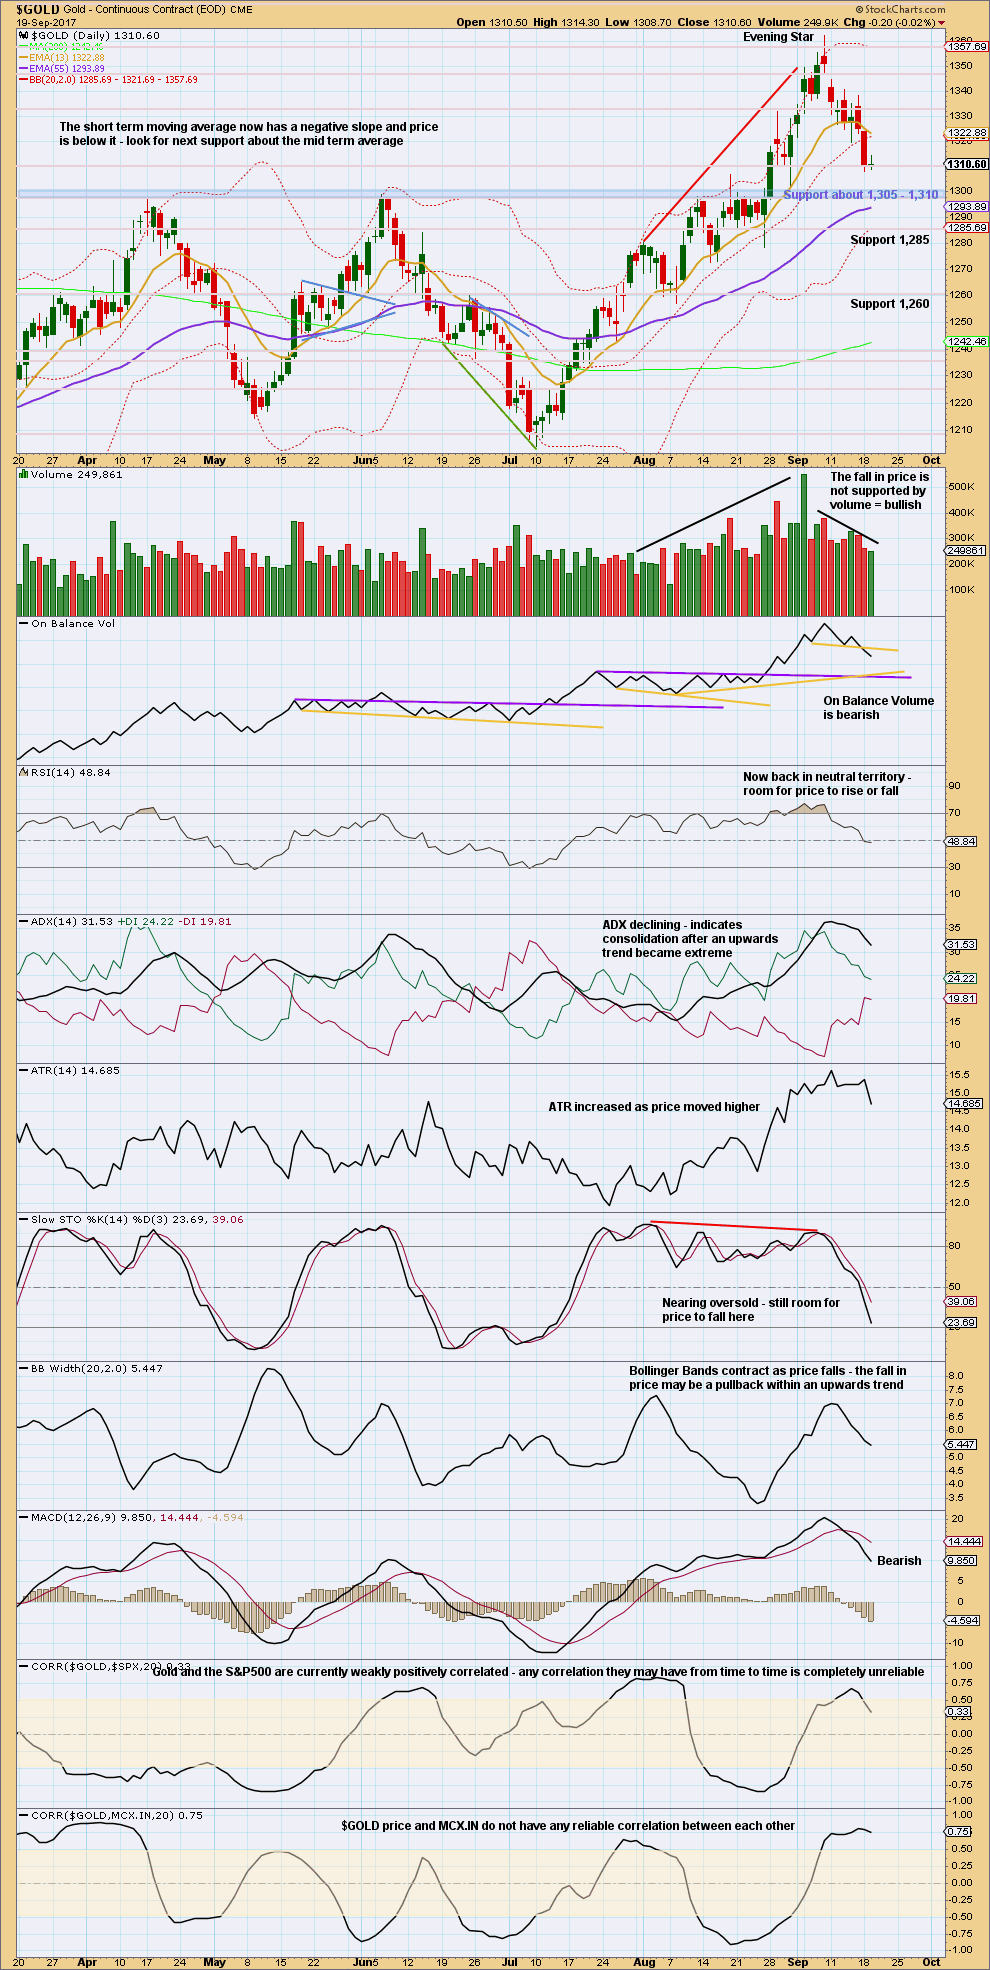
Today’s candlestick completes a small doji, which indicates a small pause within a trend and on its own is not a reversal signal. The balance of volume was down and shows a decline. This is inconclusive, for a small range doji, and it looks only like a small pause and not a warning of a change, yet.
Look now for strong support about 1,310 to 1,305.
Volume is still bullish. If volume begins to increase as price falls, then this view could change. But for now volume is declining as price falls. This is typical of a pullback or consolidation within a larger ongoing bull trend.
The pullback has brought RSI and Stochastics down from extreme, but ADX is still not down below the directional lines. ADX still indicates a consolidation or pullback.
With strong support here about 1,305 to 1,310, the doji today is entirely reasonable. If price can break below support here, then the next line of support is about 1,285. Expect price may keep falling until it finds support and Stochastics reaches oversold.
Markets are positively correlated if their correlation co-efficient is reliably above 0.5. Markets are negatively correlated if their correlation co-efficient is reliably below -0.5. Markets which fluctuate between positive and negative, and spend time in the shaded area between 0.5 and -0.5, do not have a reliable correlation.
The correlation co-efficient is added today to illustrate the idea of market correlations, and this one in particular: There is no reliable correlation between Gold spot price and Multi Commodity Exchange of India. Therefore, any analysis of one market cannot be used to indicate price direction of the other.
GDX
DAILY CHART
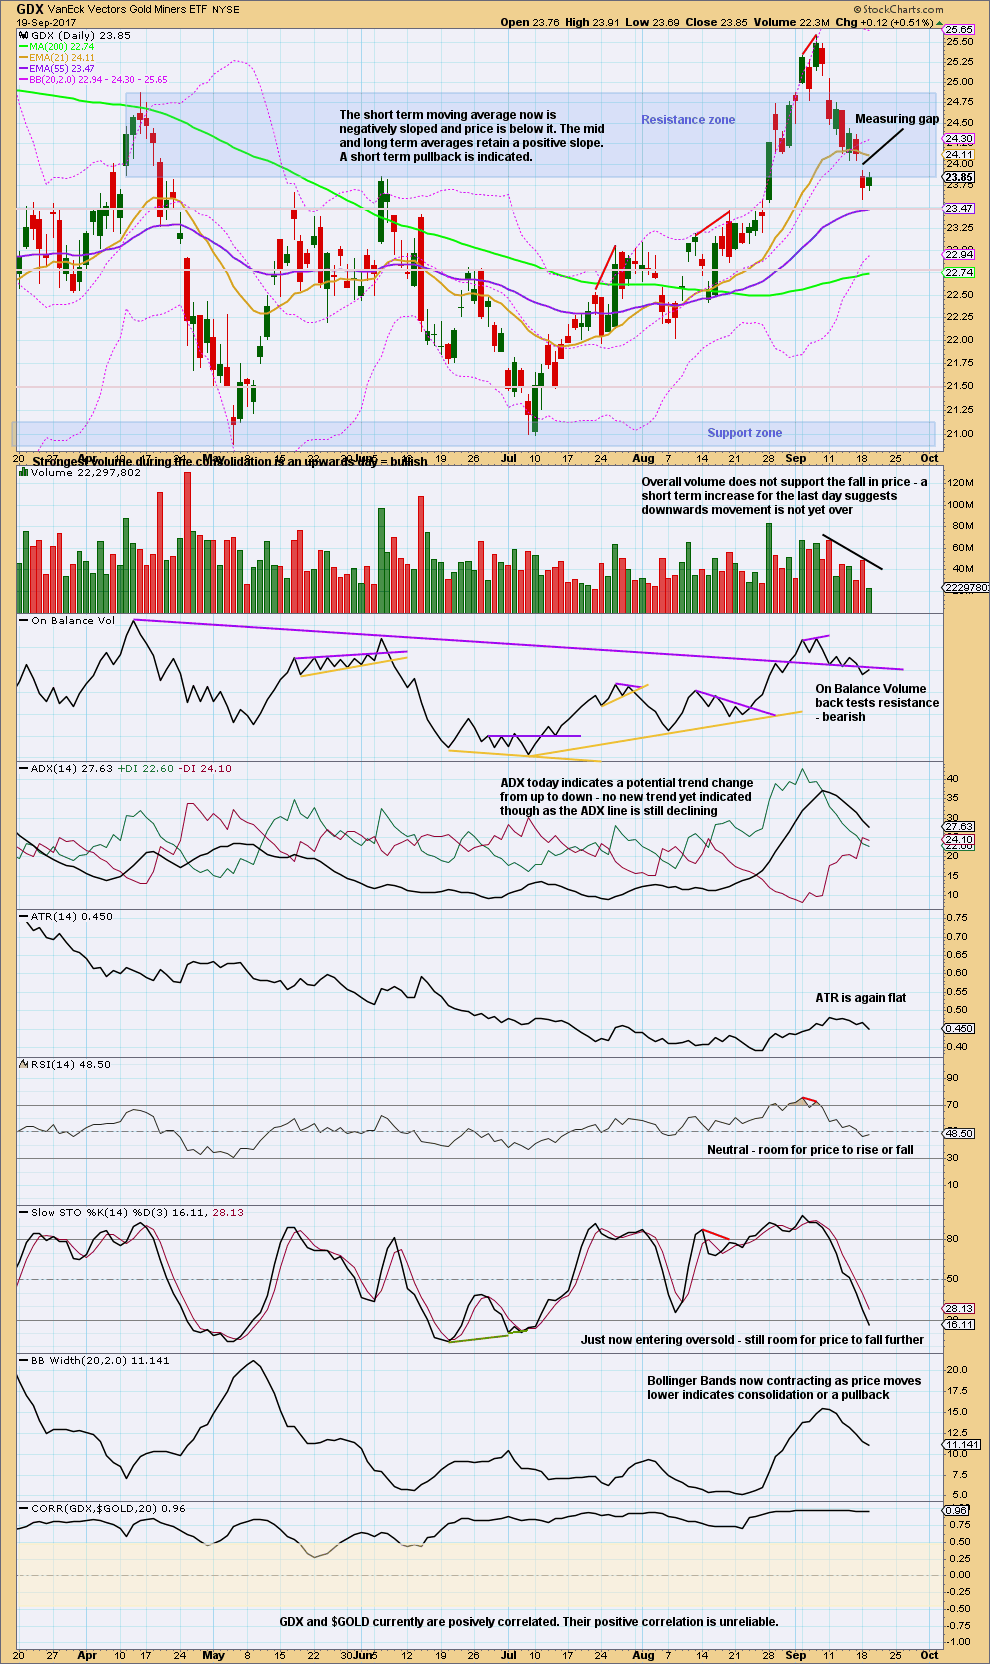
Click chart to enlarge. Chart courtesy of StockCharts.com.
The gap looks to be a measuring gap, and should be assumed to be until it is closed. Measuring gaps are useful in two different ways: they can be used to place stops and they can be used to calculate targets.
A target given using the measuring gap is 22.40.
If the gap is closed, then it is not a measuring gap and the downwards wave may be over, so shorts should be closed. Stops for any short positions may be placed just above the upper edge of the gap now at 24.05.
With the gap offering resistance (if it is a measuring gap) and On Balance Volume offering resistance, this may force price to turn here.
Published @ 06:10 p.m. EST.
Updated hourly chart:
Minuette (ii) looks fine to me, looks to have reasonable proportion. It’s remained within the Elliott channel for this correction. Minuette (iii) is starting off strongly. It should continue lower with an increase in momentum if an impulse is continuing lower.
sweet! Let’s see if it breaks 1300. Not sure if it has any other choice at this time. Lot’s of COT overhang makes this a potential huge move. Interesting that the stock market also seeing weakness. USD rallying strong
down to 1,296… now resistance just around 1,300 with what looks like a very small triangle unfolding…
so far so good.
Well….
We hit 1316.
I am banking on Lara’s short term direction.
Suspense….
I hope that’s worked out well for you KS Park, and mitigated some earlier losses.
I added positions as it went up so it averaged out pretty good, and made some $$ on the way down.
to day fed meeting wat about next gold down r up in my view gold moves down in the market n wat about syed n lara u r views one side
We have a range of views here because we are using different analysis techniques and we give weight to different techniques.
It’s up to you to decide who you will follow and how to do that.
I agree with Syed. I think Gold may have bottomed – minuette wave II looks out of proportion.
Sir, imo at this stage Gold price would need to begin to hold 1314 to mitigate downside risk 1305-03 & target the upside 1320-23+…. there is no telling who’s doing the yelling; maybe rocket man looking to travel up the yellow brick stairway to heaven lol. Have a fine & profitable trade. GL!
Hyuk! Hyuk! 🙂
im confusing u r graphs n ur tips levels say clarity
I’m suspecting that may be at least in part because English is your second language?
Elliott wave is complicated.
Focus on the summary, it’s there for clarity.
Then read the analysis carefully. I try to cover different possibilities.
It may take some time for you to read the Elliott wave stuff and for it to make sense to you.
lara wat u r saying we cant understamd u r grph language market up side r down side say atleast one side if market down then say down dnt say both side
The summary at the top of the analysis is clear.
“Expect downwards movement now to continue at least for the short term. A short term target is at 1,261.”
Daily view. As you can see, he calls the move up “not friendly” to counting five waves. As he struggles with the structure, he currently shows a 1-2, 1-2 count in progress. He doesn’t show the detail so hard to say for sure, but I see problems with the way this is labeled. I’m sure Lara will be amused…lol
The interesting thing is that he sees the current correction ending near 1,297
On that first chart if they’re seeing a leading diagonal over at the high of 17th April, then within it the third wave is shorter than the first and the fifth wave is shorter than the third which indicates a contracting diagonal. But the fourth wave is longer than the second and the trend lines diverge.
That’s not just like the problem they have with the ending diagonal on the last wave down, this is way worse. It completely fails rules regarding wave lengths for diagonals.
I thought you would be amused. 🤣 It is amazing how some EWI analysts seem to publish wavecounts that blatantly violate rules. Quality control does seem to be an issue over there.
LOL
Yes, I was amused.
I don’t think it’s a quality control thing, I am beginning to think that they actually think it’s okay to violate EW rules. Because the violations are held onto for so long.
And the problem I have with that is if EWI publicly treat EW rules as negotiable, that gives a green light to the wider public who are learning EW to treat the rules as guidelines. And only make a wave count fit rules if they feel like it.
Which could lead to a bunch of worse than useless stuff online calling itself EW and wasting everyones time.
Yet having said all that I’m aware that my track record this week is truly awful. Even when one follows all EW rules and basic TA one can still get it woefully wrong 🙁
Don’t feel badly Lara. Everyone has a week like this one now and then.
I was very suspicious of the move up as it looked quite choppy and overlapping and was expecting a considerable re-trace. I felt quit silly missing the move up but it was a good reminder that we all need to take full responsibility for our trading decisions, and that sometimes the TA will not get it exactly right. Hang in there!! 🙂
Thank you Verne. I do try to not take it badly, but it’s really hard knowing so many people have $$ riding on my analysis. And when I get it wrong I know quickly because people cancel their membership.
It always makes me more determined to work harder to get it right, but I don’t think I’ll ever lose that sick sinking feeling I get when I open charts in the morning and see price has done the opposite to what I expected.
Oh well. Keep on keeping on… from experience a focus on the technicals and considering all information will see it come right.
Run for your lives!! 🙂
Weekly view. He has two views, again similar to Lara.
I see they still have a fourth wave triangle followed by a five wave ending diagonal that violates an EW rule. The third wave of the diagonal is the longest.
I’ll never get my head around how EWI violate EW rules.
I can see why they’ve done it though to be fair. It does look like a triangle and an ending diagonal.
So EWI’s free pro week access is coming to an end. Thought I would share a couple of Tom Denham’s charts.
Big picture monthly, fairly similar to Lara’s
A bit frustrating at the moment as Gold supposed to be long and is now short and oil support to be short and now long? Easy just 180 in the opposite direction… 🙁
watch this: https://www.youtube.com/watch?v=spnxD39-ftc&t=7s
very intersting
Hehe… He needs to show us his track record first before trying to convince us to watch his video.
He’s got some good trading tips, but short term I don’t agree that the bottom is in. Looks like a bear flag. Thanks for sharing.
over 40 minutes… I just can’t
the only TA videos I can manage are Chris Ciovacco’s.
a quick summary please?
Expect the unexpected. Imo Gold price appears to be in a bottoming process. They may have us fooled here like they did at 1205, looking for lower and price turned up; maybe same thing at 1305. Imo Gold price is beginning to clip above its pivot and if it can hold, likely break above 1323 today…..
Extremely frustrating, and I am very sorry for it Ursula.
One of my worst weeks to date. And my trading account agrees.
I’ll just keep plugging away and sticking to the rules of EW, and revising my texts…. from experience this will come right. But not without damage first.