
Trading advice given in last analysis favoured the bullish scenario. Members who opened a hedge or long positions should have profits.
Summary: An upwards breakout has support from volume. Look out for very strong upwards movement in upcoming weeks to a target at 1,452.
Corrections are an opportunity to join the trend. Stops should always be used; set now just below prior support about 1,305 would allow the market room to move. Manage risk by investing only 1-5% of equity on any one trade.
New updates to this analysis are in bold.
Last monthly charts for the main wave count are here, another monthly alternate is here, and video is here.
Grand SuperCycle analysis is here.
MAIN ELLIOTT WAVE COUNT
WEEKLY CHART
Click chart to enlarge.
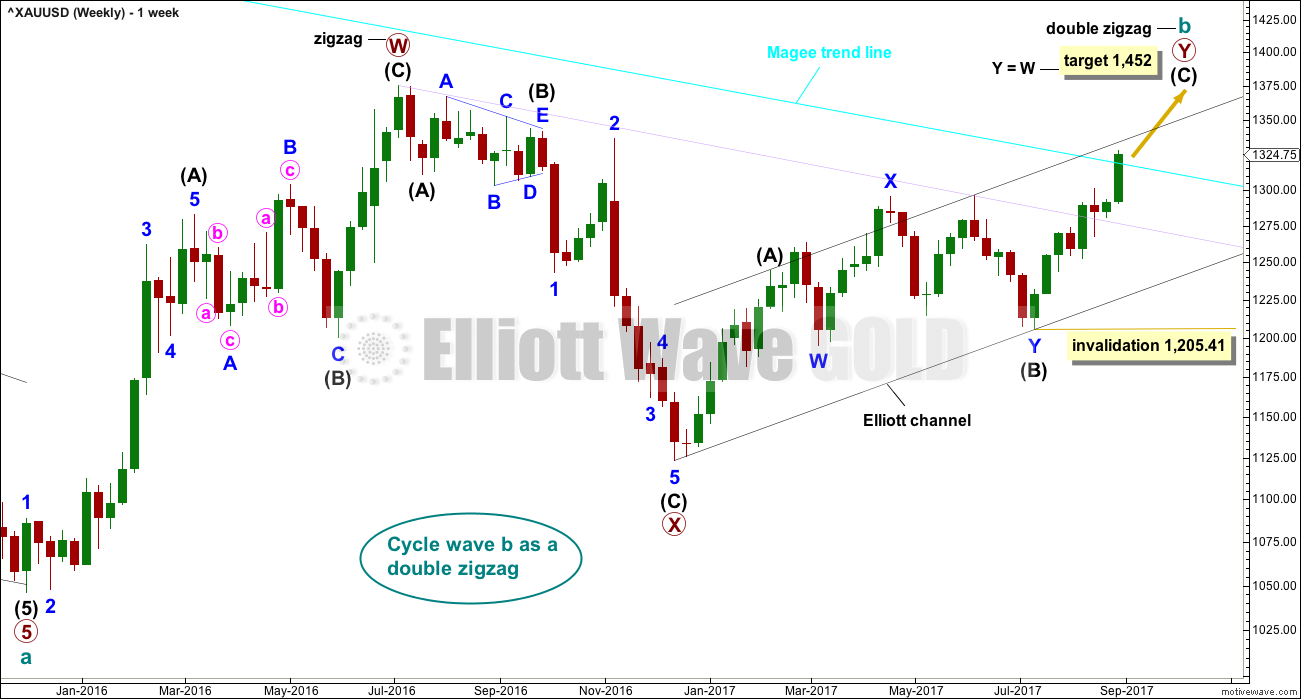
There is strong support from classic technical analysis for this wave count. Now that price has closed above the Magee trend line and has broken out above a consolidation zone, with support from volume, this wave count will now be the main wave count.
There are more than 23 possible corrective structures that B waves may take, and although cycle wave b still fits best at this stage as a triangle, it may still be another structure. This wave count looks at the possibility that it may be a double zigzag.
If cycle wave b is a double zigzag, then current upwards movement may be part of the second zigzag in the double, labelled primary wave Y.
The target remains the same.
Price has closed above the Magee trend line this week with an upwards breakout from a consolidation zone (weekly technical analysis chart). This upwards breakout has support from volume, so we should expect more upwards movement.
Within intermediate wave (C), no second wave correction may move beyond the start of its first wave below 1,205.41.
There are two problems with this wave count which reduce its probability in terms of Elliott wave:
1. Cycle wave b is a double zigzag, but primary wave X within the double is deep and time consuming. While this is possible, it is much more common for X waves within double zigzags to be brief and shallow.
2. Intermediate wave (B) within the zigzag of primary wave Y is a double flat correction. These are extremely rare, even rarer than running flats. The rarity of this structure must further reduce the probability of this wave count.
Although this wave count still has these problems, technical analysis now points to it being more likely. The alternate will continue to be considered until price invalidates it.
DAILY CHART
Click chart to enlarge.
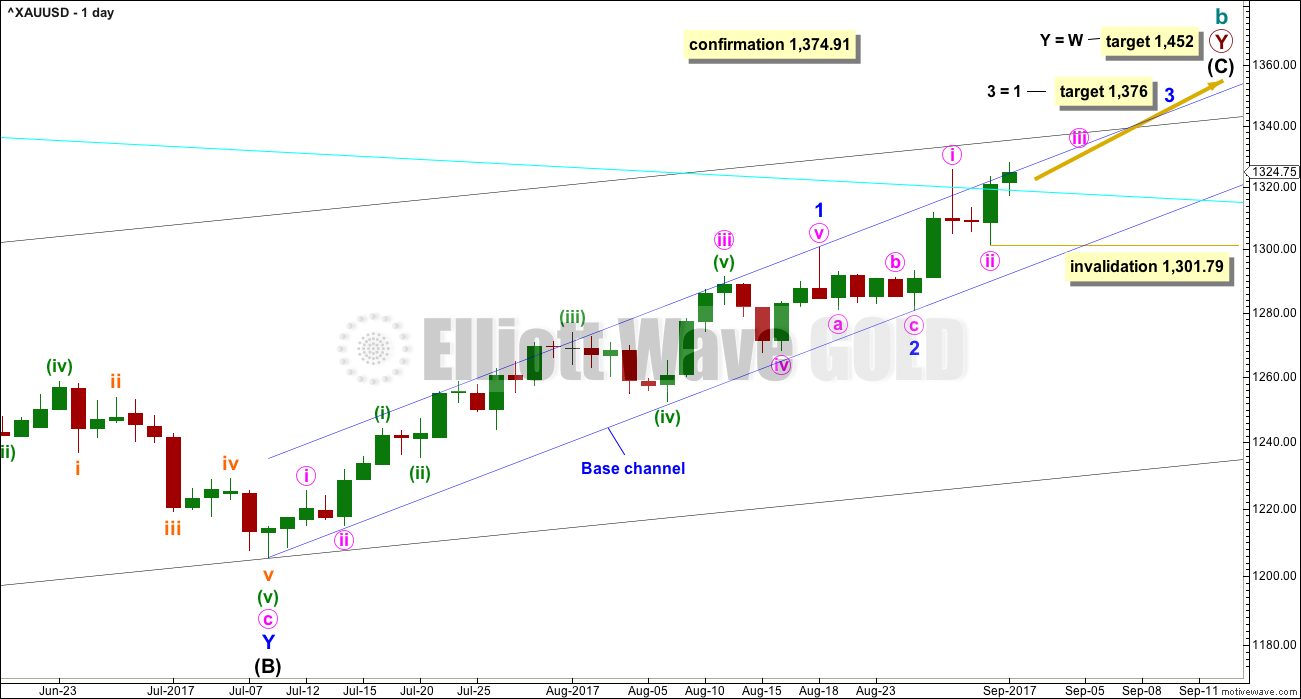
Intermediate wave (C) may be unfolding as an impulse.
Within the impulse, minor waves 1 and 2 would now be complete.
Minor wave 2 may have ended as a relatively brief shallow second wave. It is unusual for second wave corrections to be this shallow.
With minor wave 1 a very long extension, the Fibonacci ratio of equality is used for a target for minor wave 3 now.
Within minute wave iii, no second wave correction may move beyond its start below 1,301.79.
HOURLY CHART
Click chart to enlarge.
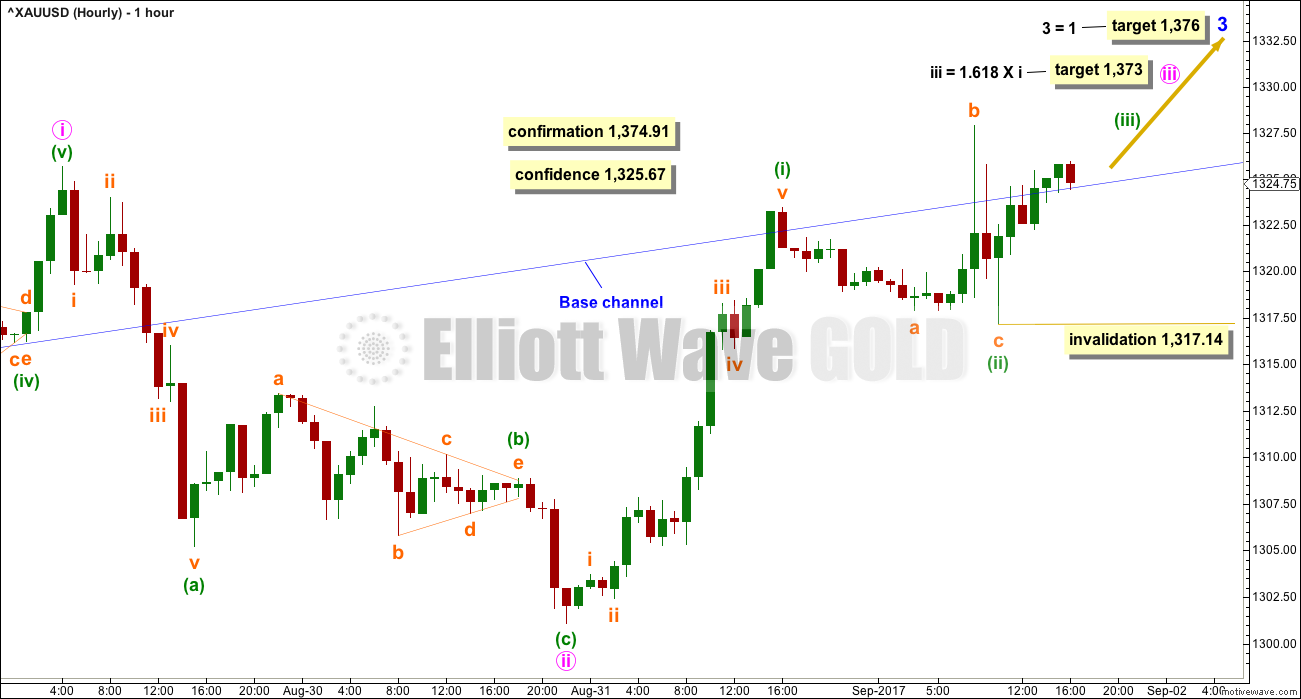
Price is having difficulty breaking above the upper edge of the base channel and staying there. It should do that; the line should offer support.
The correction during Friday’s session is too large to be labelled minuette wave (iv) because it would be grossly disproportionate to minuette wave (ii). Labelling is changed for the last wave up; it may be another first wave.
There may now be three first and second waves complete. This indicates a strong increase in upwards momentum to come. A new target is calculated for minute wave iii to end.
Gold often exhibits swift strong fifth waves, typical of commodities. This tendency is especially prevalent at the end of its third wave impulses. Look out for very strong upwards movement to end one or both of minute wave iii or minor wave 3.
Within minuette wave (iii), no second wave correction may move beyond the start of its first wave below 1,317.14.
ALTERNATE ELLIOTT WAVE COUNT
WEEKLY CHART
Click chart to enlarge.
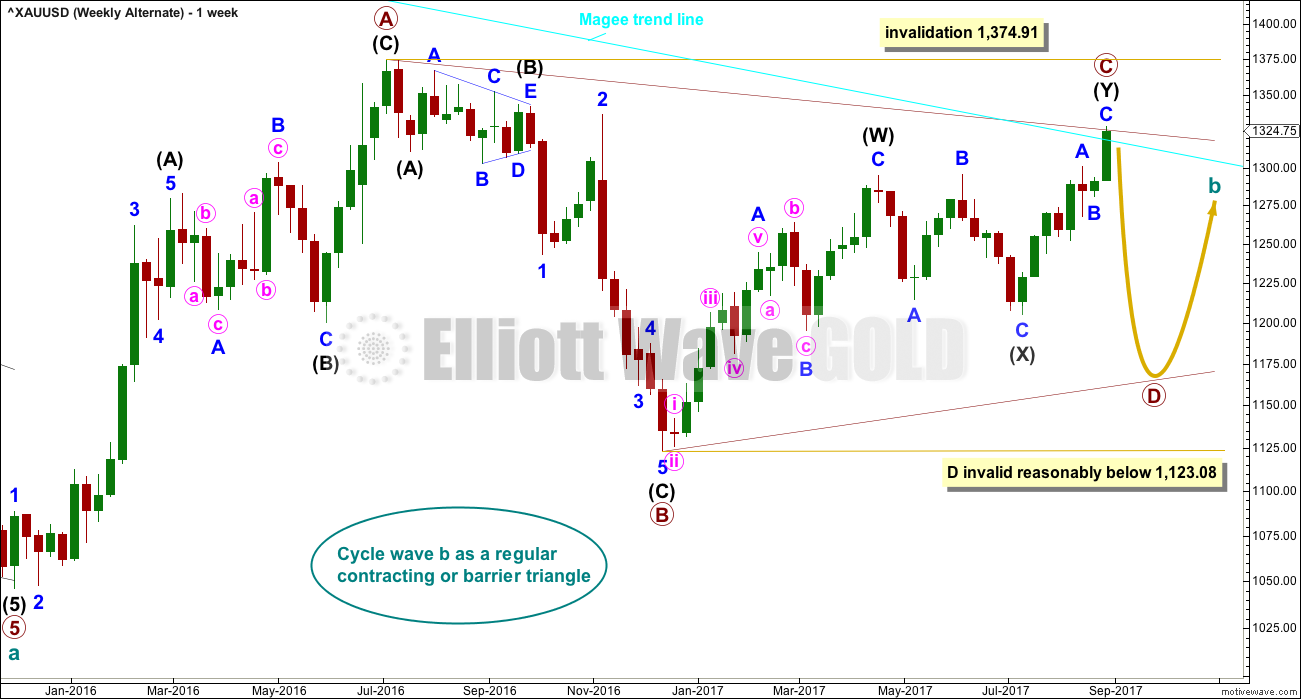
Price has closed above the Magee trend line. This is now an alternate wave count. It remains valid, but classic technical analysis points to it now having a lower probability.
The Magee bear market trend line is drawn from the all time high for Gold on the 6th of September, 2011, to the first major swing high within the following bear market on the 5th of October, 2012. Initially this line provided resistance, but at the end of this week resistance is giving way.
To use this trend line in the way Magee describes, we should assume that price will find resistance at the line if it gets back up there. If the line is breached (by at least one or two full daily candlesticks above it), it will be signalling a major trend change from bear to bull.
At this stage, a triangle still looks possible and has the best fit for cycle wave b. It has strong support now from declining ATR and MACD hovering about zero at the weekly chart level.
Within a triangle, one sub-wave should be a more complicated multiple, which may be primary wave C. This is the most common sub-wave of the triangle to subdivide into a multiple.
Intermediate wave (Y) now looks like a developing zigzag at the weekly chart level, and minor wave B within it shows up with one red weekly candlestick.
Primary wave D of a contracting triangle may not move beyond the end of primary wave B below 1,123.08. Contracting triangles are the most common variety.
Primary wave D of a barrier triangle should end about the same level as primary wave B at 1,123.08, so that the B-D trend line remains essentially flat. This involves some subjectivity; price may move slightly below 1,123.08 and the triangle wave count may remain valid. This is the only Elliott wave rule which is not black and white.
Finally, primary wave E of a contracting or barrier triangle may not move beyond the end of primary wave C above 1,295.65. Primary wave E would most likely fall short of the A-C trend line. But if it does not end there, then it can slightly overshoot that trend line.
Primary wave A lasted 31 weeks, primary wave B lasted 23 weeks, and primary wave C may now be completed its 37th week. A double zigzag may be expected to be longer lasting than single zigzags within a triangle, and so this continuation of primary wave C is entirely acceptable and leaves the wave count with the right look at this time frame.
DAILY CHART
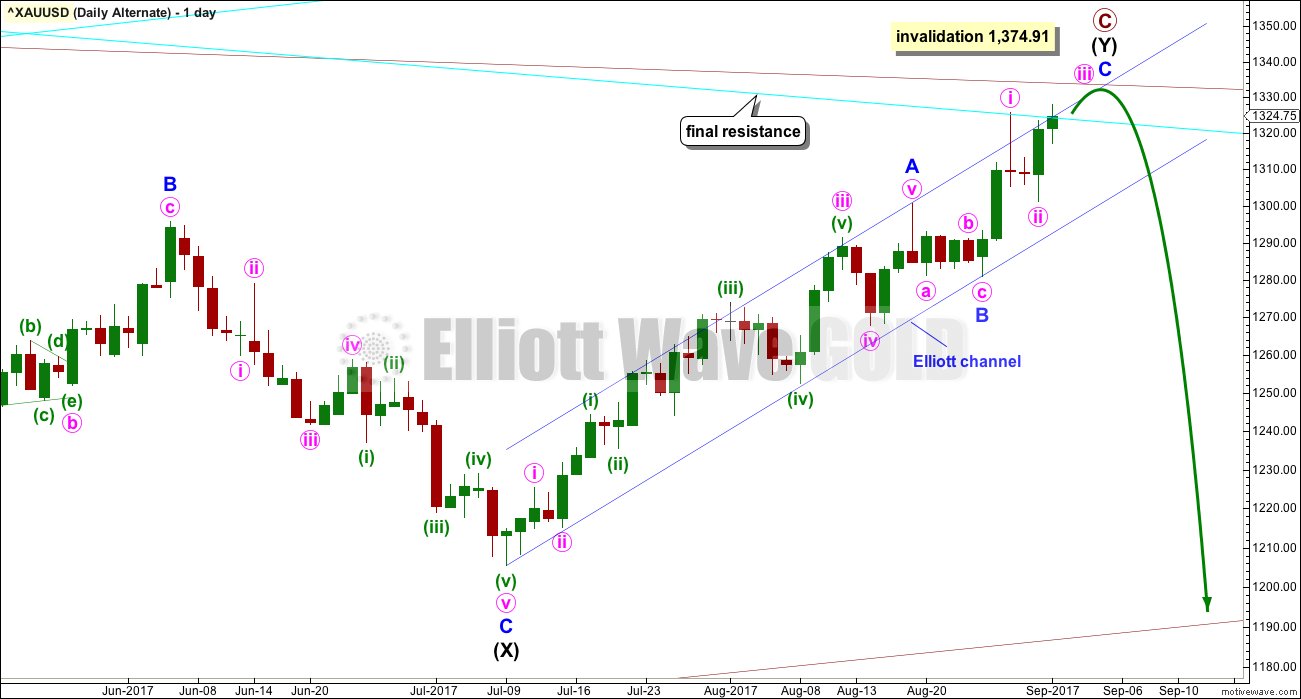
Click chart to enlarge.
The cyan Magee trend line should offer very strong resistance. The fact that it is now overshot and looks like it will be breached must reduce the probability of this wave count.
A breach of the blue Elliott channel by downwards movement would indicate a trend change.
With the new high for Friday, minor wave C no longer is a complete five wave impulse. I have tried several different ways to label upwards movement of intermediate wave (Y). With the overlapping in it, the structure of minor wave C now cannot be complete. This wave count now requires more upwards movement.
With both wave counts expecting the same direction next, upwards, only one hourly chart will be published.
TECHNICAL ANALYSIS
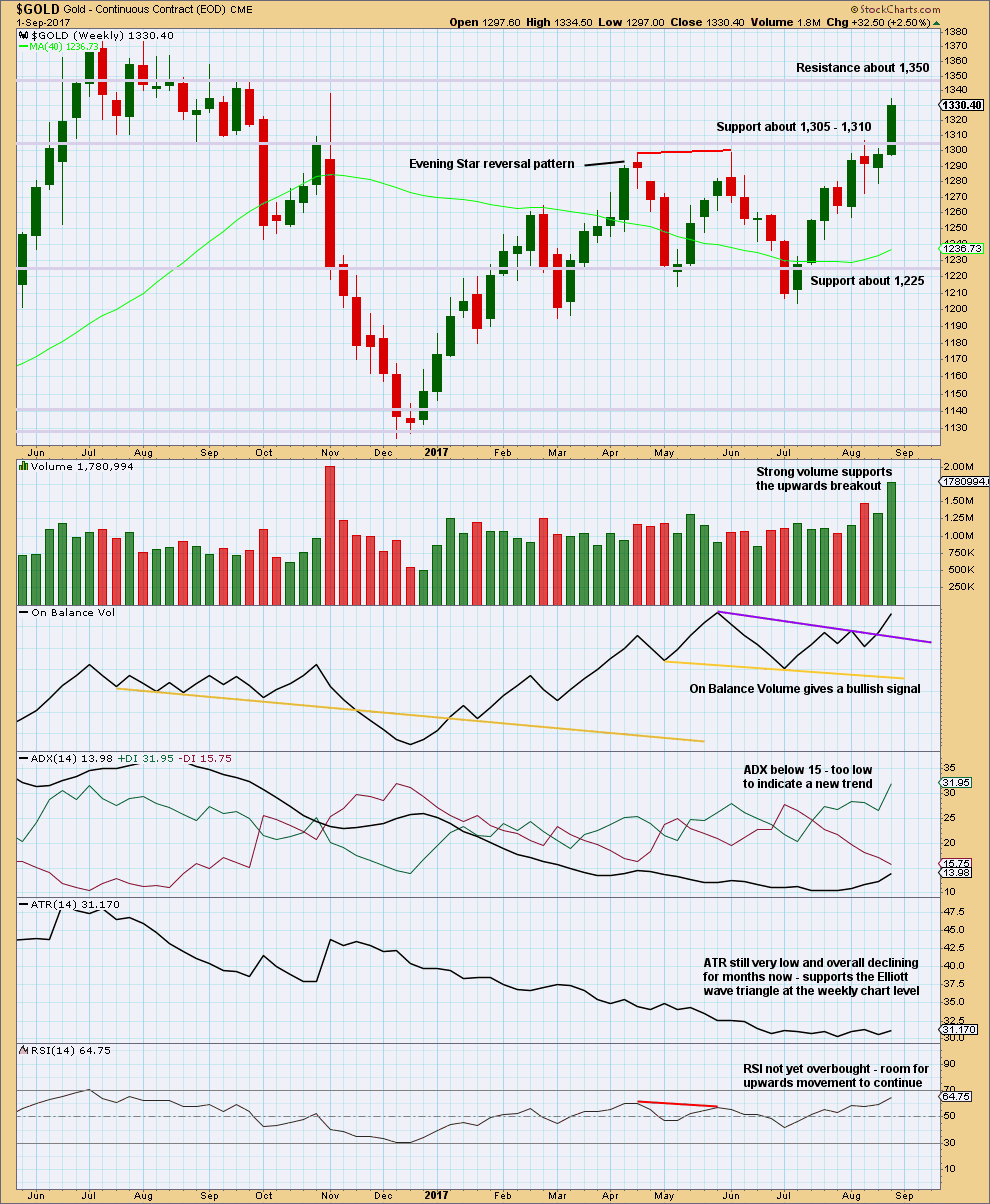
WEEKLY CHART
Click chart to enlarge. Chart courtesy of StockCharts.com.
Price has closed this week above the consolidation zone, which began back in February this year. The close above resistance comes with a week of strong volume. This is a classic upwards breakout supported by volume.
It is very common after an upwards breakout to see price curve down to test support which was prior resistance. Look out for a pullback to find support now about 1,305 to 1,310. Thereafter, price should turn up and move strongly higher.
If price behaves like this, it would offer a good opportunity to join the trend at a good price. This does not always happen, but it happens much more often than it does not.
On Balance Volume gives a weak bullish signal. ADX continues to rise, but is not high enough yet to indicate an upwards trend. RSI indicates there is room still for price to rise.
DAILY CHART
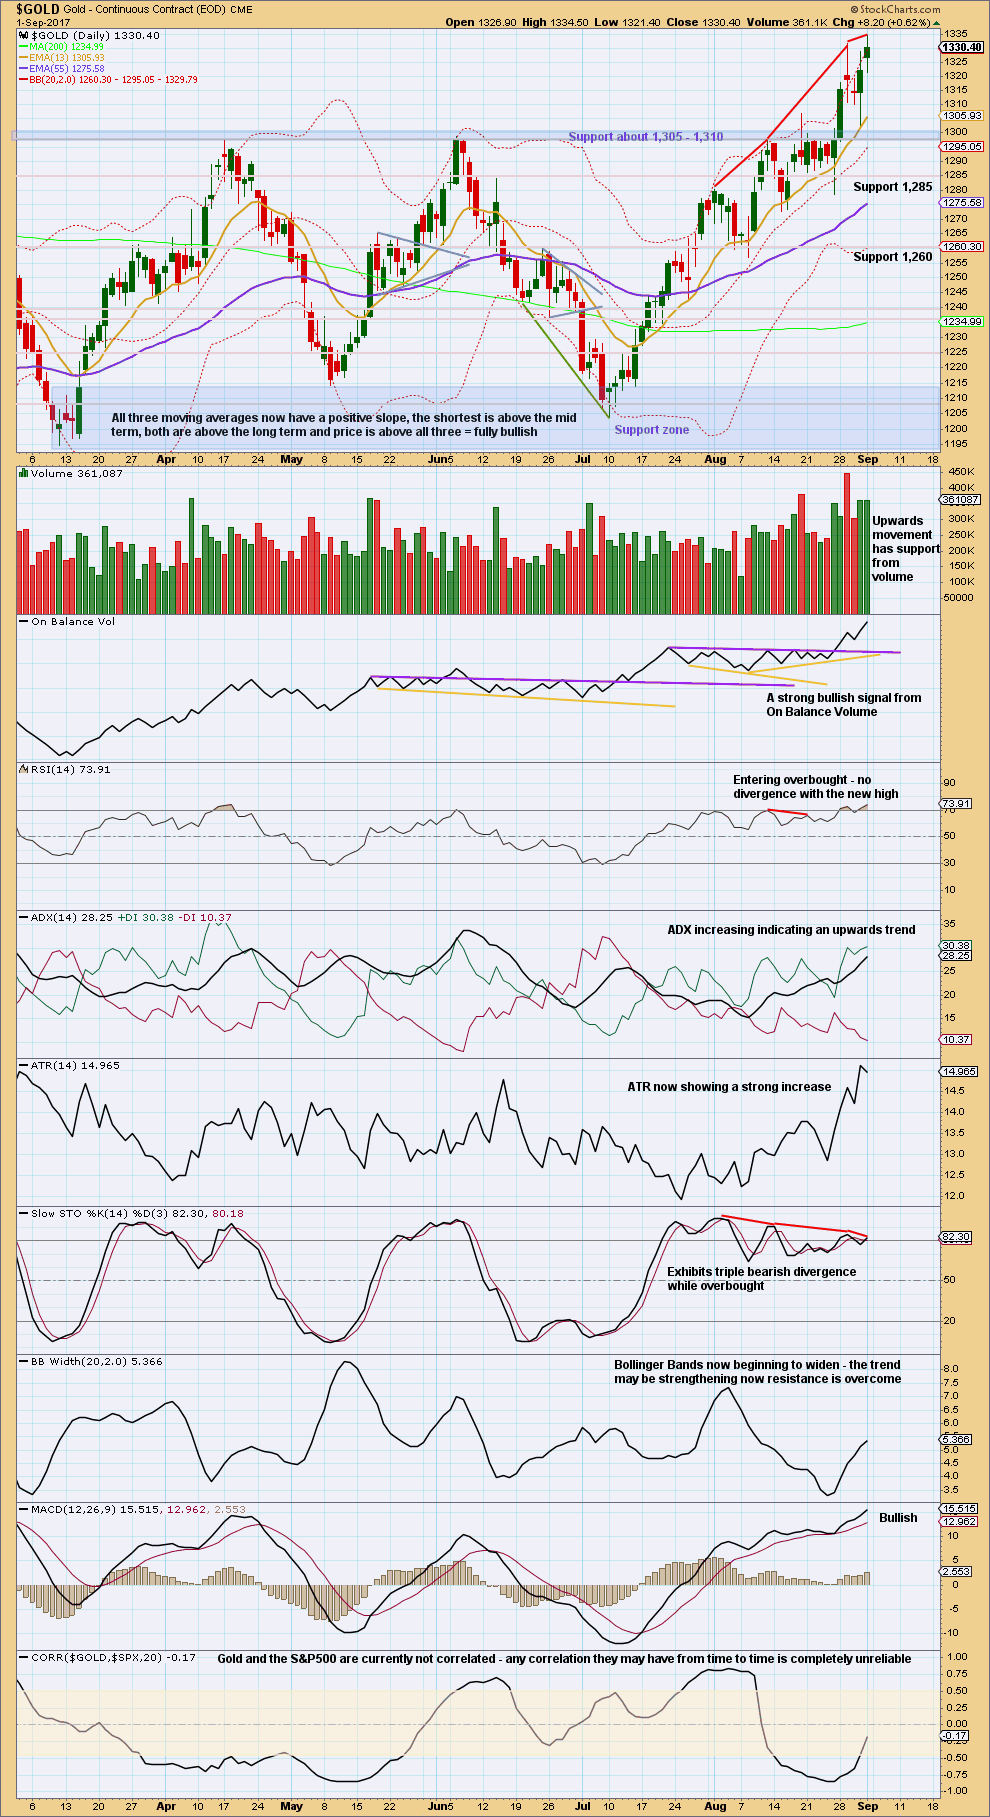
Click chart to enlarge. Chart courtesy of StockCharts.com.
Another upwards day has a slight increase in volume. The upwards breakout has support from volume. On Balance Volume is very bullish.
After the upwards breakout on the 28th of August, a quick back test of support occurred on the 31st of August. While it is still possible that another back test may occur at the weekly chart level, the back test already done on the daily chart level does reduce the probability of another test now.
If the ADX line reaches above both directional lines, it would be indicating an extreme trend. It has not done that yet. There is room for the trend to continue here.
The trend has support from rising ATR and widening Bollinger Bands.
GDX
DAILY CHART
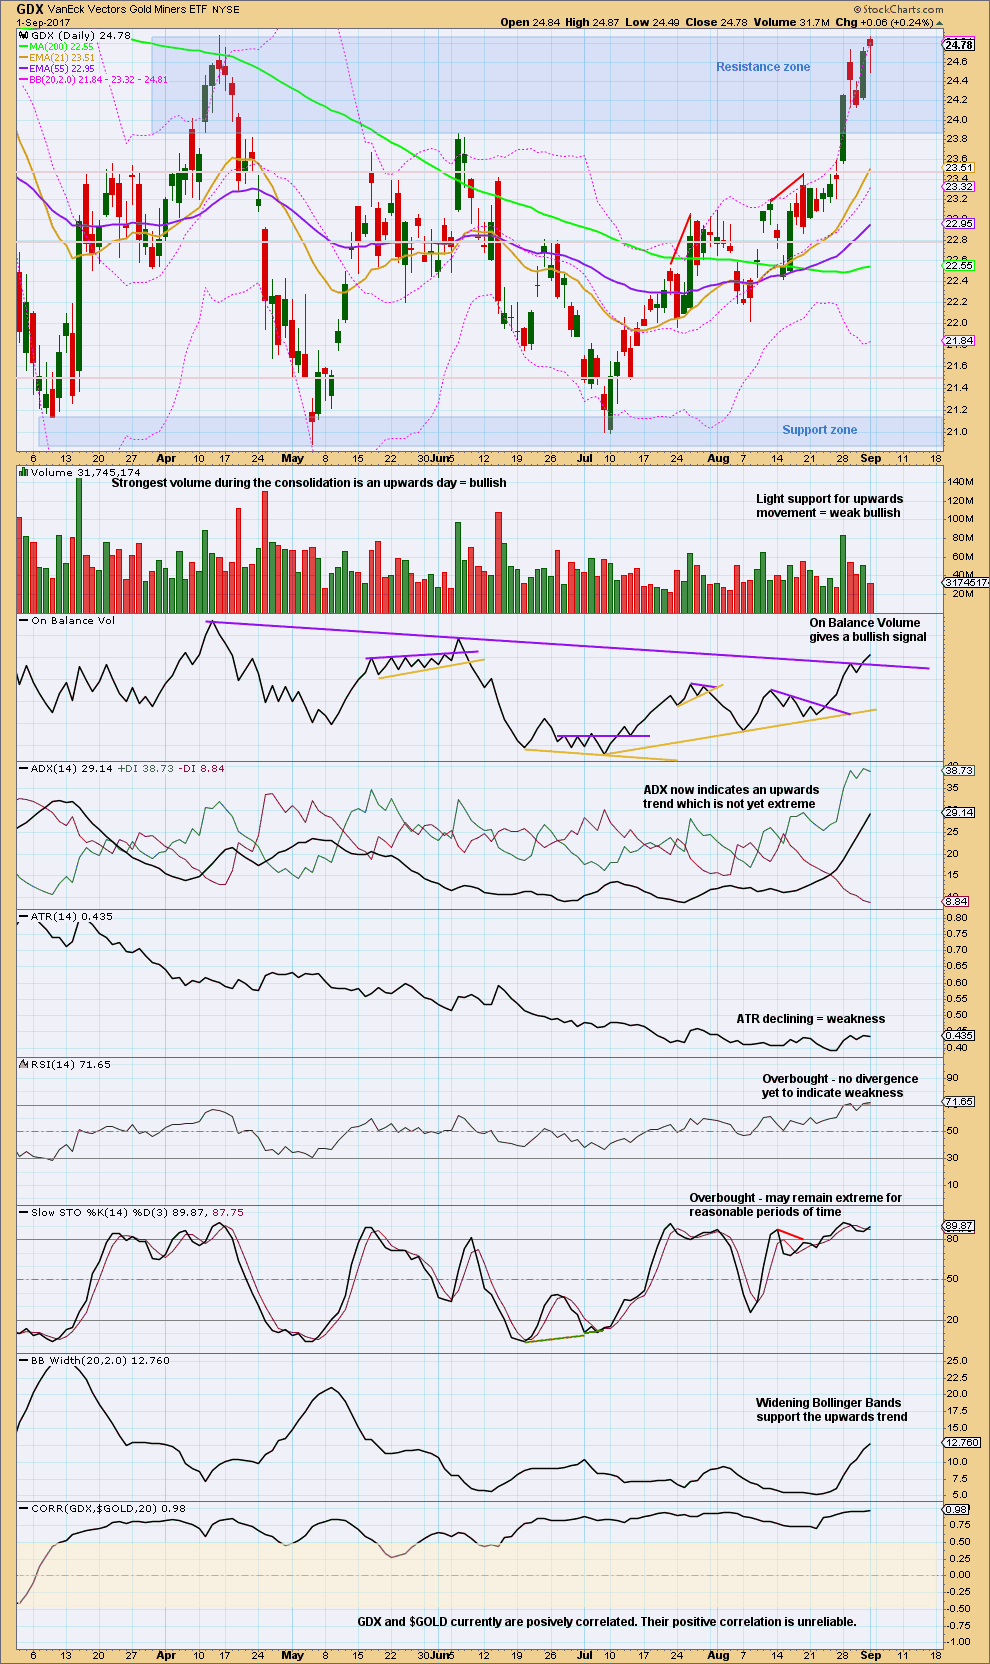
Click chart to enlarge. Chart courtesy of StockCharts.com.
Price is right up at the upper edge of the resistance zone now. The upper edge is delineated by the high on the 13th of April at 24.88. The high for Friday was 24.87.
Friday’s candlestick is a Hanging Man candlestick pattern. The bullishness of the long lower wick on this pattern means that it requires bearish confirmation. If it is followed by a downwards day on Monday, it would signal a trend change from up to either down or sideways.
The signal from On Balance Volume is weak because the line was only tested twice before.
Stochastics and RSI may remain extreme for a reasonable time during a bull trend.
GOLD THIRD WAVE EXAMPLE – DAILY CHART
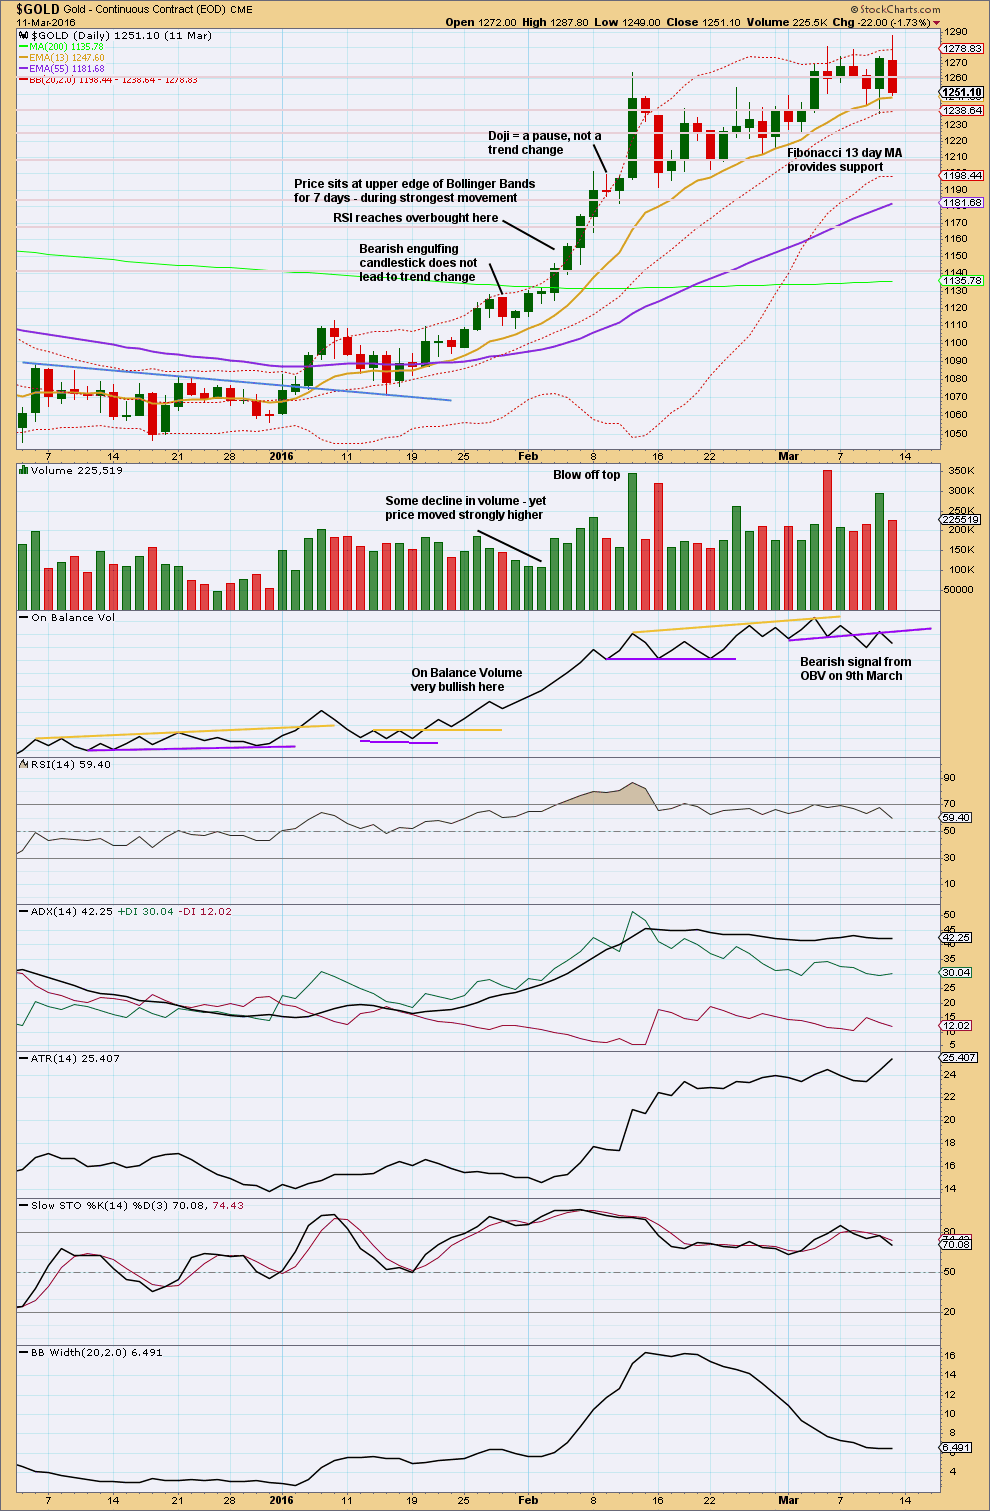
Click chart to enlarge. Chart courtesy of StockCharts.com.
This chart has been published before. It shows the most recent example of a strong third wave in Gold from December 2015 to March 2016.
Note that during this strong upwards trend:
– RSI first reached overbought on the 4th of February and price then continued strongly higher for five more days culminating in a blowoff top on the 11th of February.
– RSI and Stochastics remained extreme for most of the second half of the trend. At the final high, they both exhibited strong divergence with price.
– Price found support at the short term Fibonacci 13 day moving average during the entire trend.
– All signals from On Balance Volume were bullish right up to the end of the trend. The 9th of March shows the first bearish signal, which was an important warning of a trend change.
– The trend begins with choppy overlapping and some hesitancy.
– The 6th of January was an important upwards breakout from resistance, with support from volume. Thereafter, price moved more strongly.
– While overall volume supported the upwards movement in price, this was not linear. Some weaker days occurred yet price continued higher. It is the overall trend of volume which is more important than any one or two days. On Balance Volume remaining bullish was an important guide.
No two waves are the same. So if the current wave count is correct, it may be different from this example. However, there are some important lessons to be learned here:
1. On Balance Volume is an important guide. Bullish signals should be taken seriously, particularly early on in the trend. Later in the trend, with RSI and Stochastics overbought, any bearish signal from On Balance Volume should see long positions closed.
2. RSI and Stochastics can reach extreme overbought. Only when they have been extreme for some time and then exhibit strong divergence should it be taken as a warning of a trend change.
Published @ 08:18 p.m. EST on 2nd September, 2017.
Updated hourly chart:
I’m slightly hesitant in labelling minuette wave (iii) over, if it is then it’s slightly shorter than minuette (i). That means the target at 1,373 is too high, minuette wave (v) would be limited to no longer than minuette (iii). If it begins here the limit is at 1,355.86.
The alternate labelling would be another first wave complete, labelled subminuette i. The invalidation point would then be lower at 1,317.14.
I’ll look at volume when the session is closed to decide how to label this. A third wave should have support from volume, particularly a bullish third wave.
Anyway, another upwards day looks good for the main count. Corrections are an opportunity to join the trend. Look now for support at the upper edge of the base channel.
At only 36%, the miners Bullish % shows that there is plenty of room for a big move up from here. Look at the RSI history. It could continue rising for another month or two easily.
Lara: can you give a target for platinum in this current bullish environment? Charts are not necessary to back up your answer…just an eyeball assessment that corresponds to the wave 3 targets of various degrees in gold and silver…thanks
Sorry Hardy, I can’t give a rough estimate using EW. I’d have to do a wave count, and I don’t have one for Platinum.
I will look at doing an analysis of that one if I have time this week.
Looking at support and resistance I’d expect the next area for price to stop would be about 1,035 – 1,045.
There are a few smaller ares of resistance above that, the next big one would be 1,200.
At the opening gold tested high volume top of $1338 Nov 8 2017 per PMBull data feed.
Sorry date should be: Nov 8 2016.
Thank you for all your charts. The up trend is strong. Imo lucky at this stage if we get a dip below 1331 for 1325 lol… Bad luck for those members who did not get to ride this train earlier.
Last Friday GSR broke down from a top HnS pattern I have been monitoring from May.
When GSR goes up nominal price of metals go down and vice a versa
GSR is heading to 68 apex of the triangle from where it broke above in May.
GSR normal range is around 35 to 45 in recent years since 1970’s. In 1980 briefly it traded at 15 (gold at 830) and in 2011 at 32 (gold at 1923).
If GSR reverts back to normal range gold will continue to go higher. It is very reliable indicator for PM sector.
Papudi, you’ve been bullish for some time now with little support. Congrats on sticking with your convictions!!! Things are starting to look much better now 😀
Thanks Dreamer,
There are several indicators I follow for PM metals. GSR is THE main indicator proven historically.
All other indicators have been flashing bullish stance for the metals.
World market is in bullish K wave to last next 8 years. That means commodities are going much higher.
Thank you Papudi.
I think I should look at adding this to my end of week analysis.
Hi Lara,
I am a bit confused by your comments in the Weekly technical analysis section that a pull back may occur to the 1305 level. I can’t see this happening on the daily chart where possible falls in the minor, minute and minuette degrees look fairly limited i.e. strong falls would invalidate the wave count.
Nick, my 2 cents… At just over 3 minutes into the video, Lara talks about how unusual it is for a Minor degree 2nd wave to be so shallow. There’s a possibility that a deeper correction could occur and then the wavecount would likely be reworked to show Minor wave 2 starting higher up and then correcting deeper as another back test of the breakout around 1,300. This may or may not happen. Lara is just being thorough as usual and laying out another scenario.
Hope this helps
OK, thanks Dreamer – I ought to listen to the video first!
Exactly. Thank you Dreamer for answering 🙂
Lara: Is there a way to zoom in on the chart: “Third wave Example”?
Comments are too small.
Open it in a new tab and enlarge the whole page
If you’re using Windoz machine, hold the control button on your keyboard and scroll with your mouse’s scroller.
To restore, ctrl-0