
Yesterday’s hourly charts for both Elliott wave counts had a target at 1,316 for a bounce to end and then expected downwards movement to show some strength as a third wave began. This is exactly what happened. Upwards movement reached 1,315.81, just 0.19 short of the target, before turning and moving strongly lower.
Summary: Expect downwards movement now to continue at least for the short term. A short term target is at 1,261.
Use the channels drawn on the hourly charts (they are the same). Expect price to keep falling while it remains within the channel. If that channel is breached by upwards movement, expect a big bounce. The upper edge of the channel may be used to place trailing stops for shorts.
This downwards swing may go as low as 1,170 to 1,158.
Always trade with stops and invest only 1-5% of equity on any one trade.
New updates to this analysis are in bold.
Last monthly charts for the main wave count are here, another monthly alternate is here, and video is here.
Grand SuperCycle analysis is here.
The wave counts will be labelled first and second. Classic technical analysis will be used to determine which wave count looks to be more likely.
FIRST ELLIOTT WAVE COUNT
WEEKLY CHART
Click chart to enlarge.
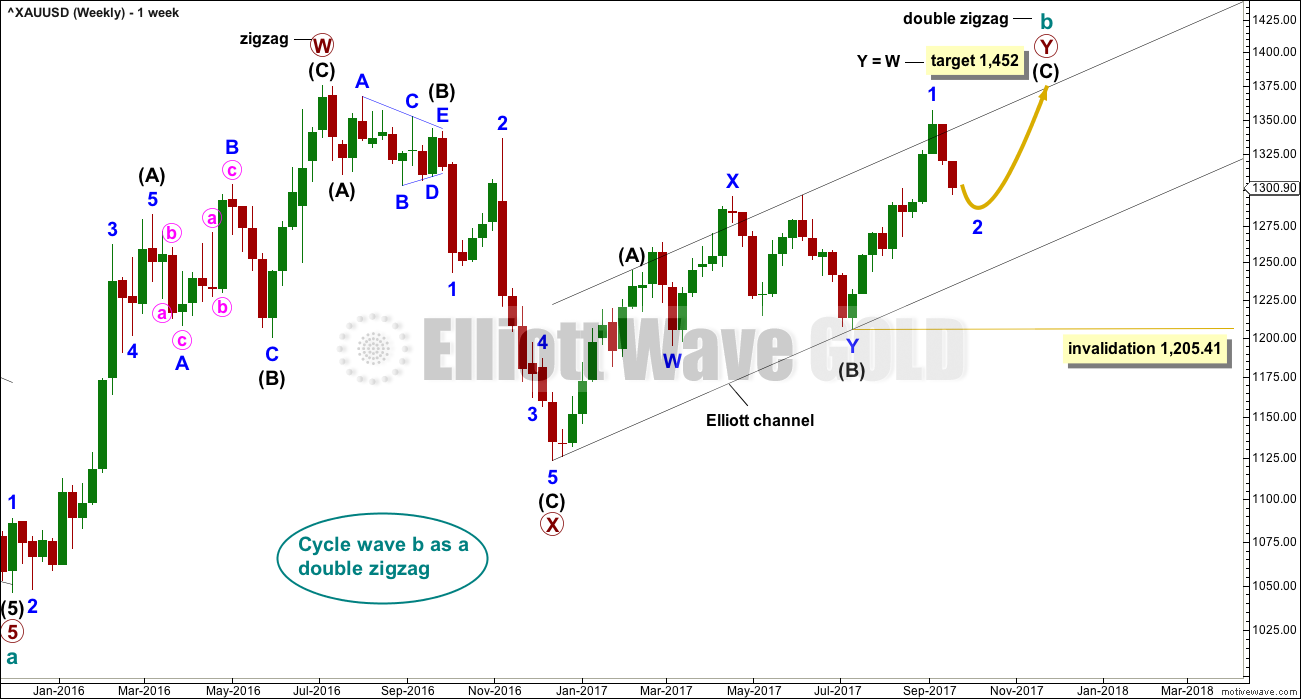
There are more than 23 possible corrective structures that B waves may take, and although cycle wave b still fits well at this stage as a triangle, it may still be another structure. This wave count looks at the possibility that it may be a double zigzag.
If cycle wave b is a double zigzag, then current upwards movement may be part of the second zigzag in the double, labelled primary wave Y.
The target remains the same.
Within intermediate wave (C), no second wave correction may move beyond the start of its first wave below 1,205.41.
There are two problems with this wave count which reduce its probability in terms of Elliott wave:
1. Cycle wave b is a double zigzag, but primary wave X within the double is deep and time consuming. While this is possible, it is much more common for X waves within double zigzags to be brief and shallow.
2. Intermediate wave (B) within the zigzag of primary wave Y is a double flat correction. These are extremely rare, even rarer than running flats. The rarity of this structure must further reduce the probability of this wave count.
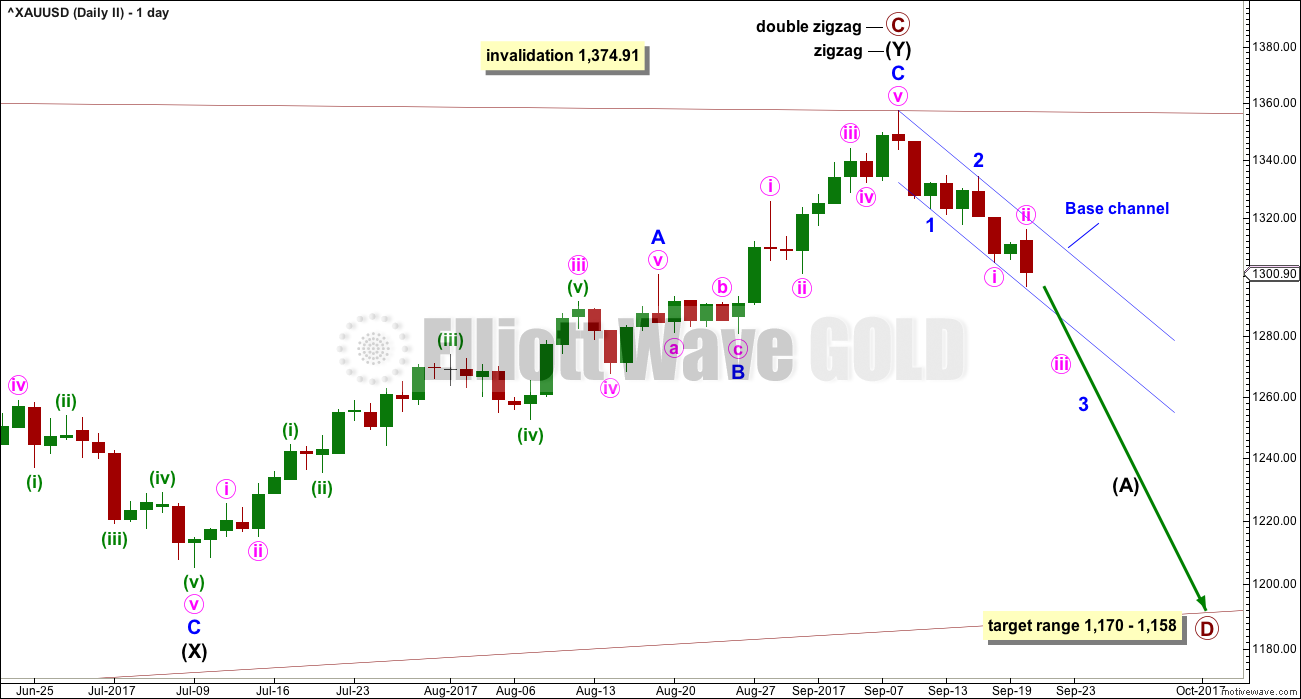
DAILY CHART
Click chart to enlarge.
The analysis will focus on the structure of intermediate wave (C). To see details of all the bull movement for this year see daily charts here.
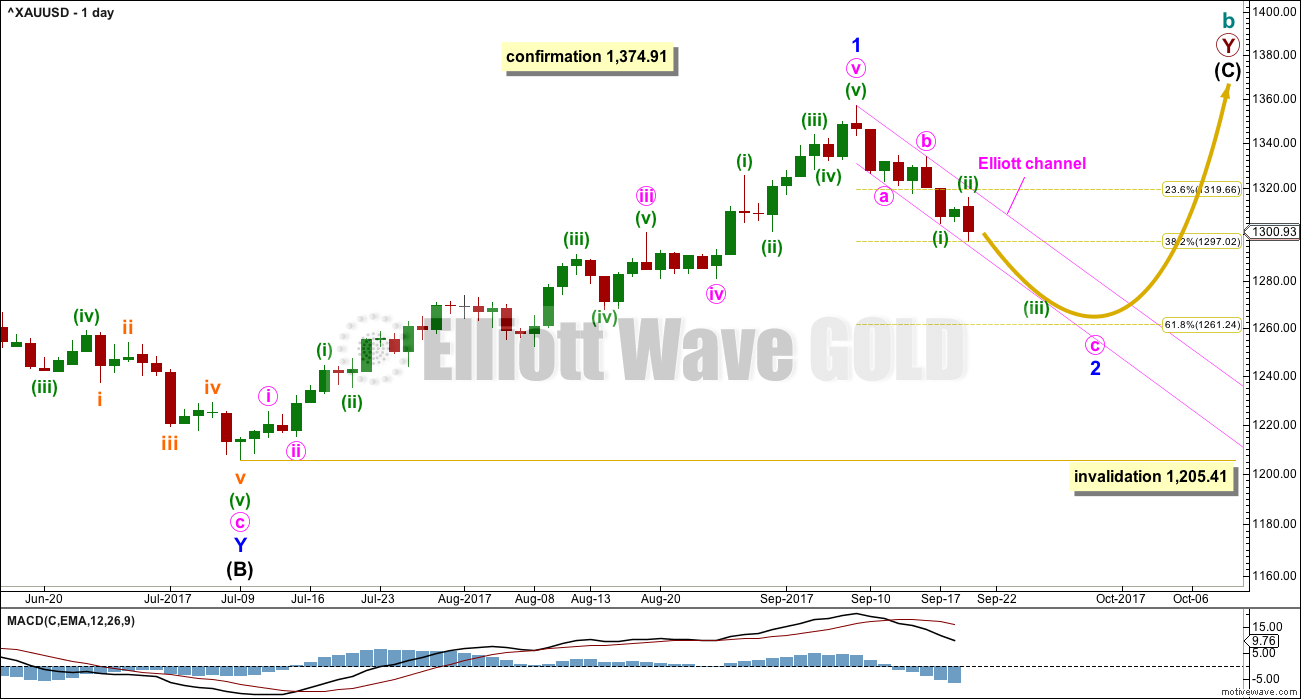
Intermediate wave (C) must be a five wave structure, either an impulse or an ending diagonal. It is unfolding as the more common impulse.
With the current pullback no longer remaining within a channel drawn about the prior upwards wave, this looks like a new wave separate to the last wave up. Labelling the last wave up and now this pullback at the same degree looks more correct.
It is possible that minor wave 1 may have been over at the last high and the current pullback may be minor wave 2. Minor wave 2 may not move beyond the start of minor wave 1 below 1,205.41.
The target for minor wave 2 is at the 0.618 Fibonacci ratio of minor wave 1.
HOURLY CHART
Click chart to enlarge.
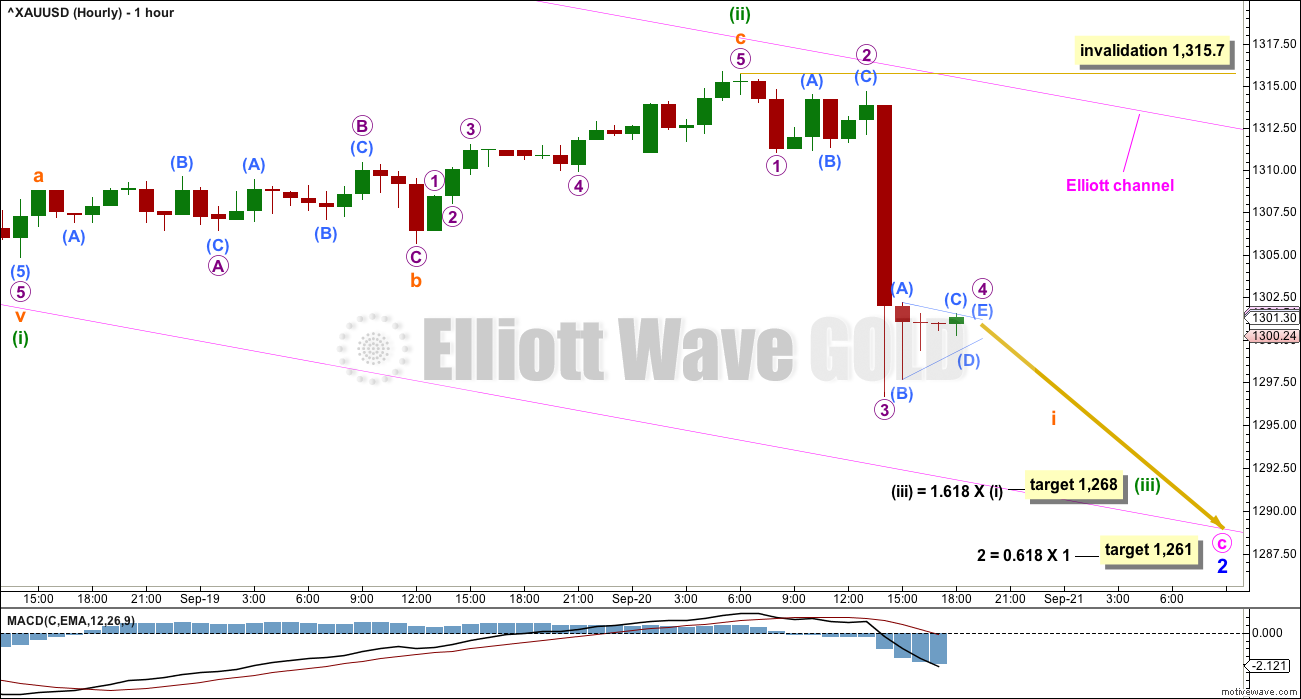
Minor wave 2 may be unfolding as a single zigzag, which is one of the most common structures for a second wave.
Zigzags subdivide 5-3-5. So far minute waves a and b look complete. Minute wave c must subdivide as a five wave structure and at this stage looks to be the more common impulse.
So far, within minute wave c, minuette waves (i) and now (ii) look complete.
Minuette wave (iii) should exhibit an increase in downwards momentum; third waves are usually stronger than first waves. This one has started out strongly, but a further increase in momentum may be expected as MACD has yet to show stronger momentum than the end of minuette wave (i).
Minuette wave (iii) may only subdivide as an impulse. So far subminuette wave i may be close to completion. When micro waves 4 and 5 within it are complete, then subminuette wave ii may bounce and may not move beyond the start of subminuette wave i above 1,315.70.
If subminuette wave ii is deep, then it should find very strong resistance at the upper edge of the pink Elliott channel copied over from the daily chart.
Minor wave 1 lasted 44 days in total. So far minor wave 2 has only lasted 8 days. It should be expected to last longer than this for the wave count to have good proportions. A Fibonacci 13 is now a minimum expectation, which would see minor wave 2 end next Tuesday.
Price should remain with the Elliott channel while minor wave 2 continues. If this channel is breached by upwards movement, that shall be an early indicator that minor wave 2 may be over.
If this wave count is correct, then when this pullback is complete then a third wave up should unfold. That may now begin about the end of next week at the earliest.
SECOND ELLIOTT WAVE COUNT
WEEKLY CHART
Click chart to enlarge.
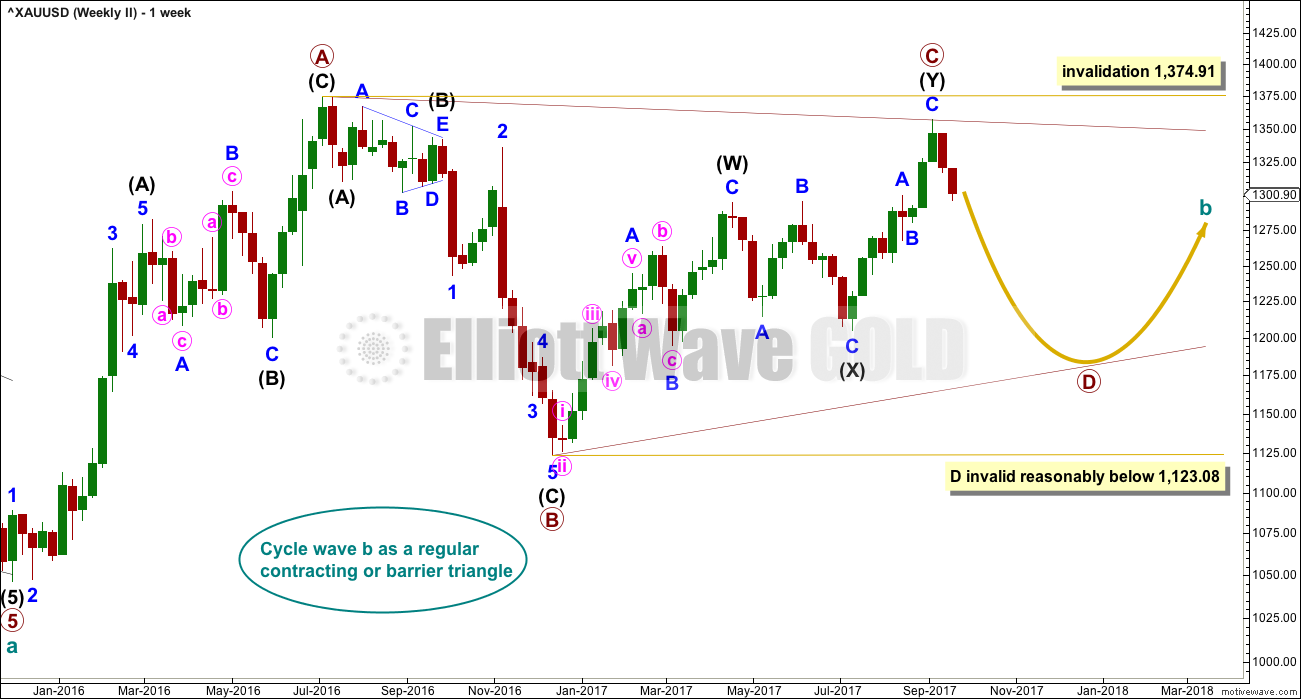
It is still possible that cycle wave b is unfolding as a regular contracting triangle.
Within a triangle, one sub-wave should be a more complicated multiple, which may be primary wave C. This is the most common sub-wave of the triangle to subdivide into a multiple.
Intermediate wave (Y) now looks like a complete zigzag at the weekly chart level.
Primary wave D of a contracting triangle may not move beyond the end of primary wave B below 1,123.08. Contracting triangles are the most common variety.
Primary wave D of a barrier triangle should end about the same level as primary wave B at 1,123.08, so that the B-D trend line remains essentially flat. This involves some subjectivity; price may move slightly below 1,123.08 and the triangle wave count may remain valid. This is the only Elliott wave rule which is not black and white.
Finally, primary wave E of a contracting or barrier triangle may not move beyond the end of primary wave C above 1,295.65. Primary wave E would most likely fall short of the A-C trend line. But if it does not end there, then it can slightly overshoot that trend line.
Primary wave A lasted 31 weeks, primary wave B lasted 23 weeks, and primary wave C lasted 38 weeks.
The A-C trend line now has too weak a slope. At this stage, this is now a problem for this wave count, the upper A-C trend line no longer has such a typical look.
DAILY CHART
Click chart to enlarge.
This second wave count expects the new wave down may be deeper and longer lasting than the first wave count allows for.
The blue base channel on this second wave count is drawn in exactly the same way as the pink Elliott channel on the first daily chart.
A common length for triangle sub-waves is from 0.8 to 0.85 the length of the prior wave. Primary wave D would reach this range from 1,170 to 1,158.
If primary wave C is correctly labelled as a double zigzag, then primary wave D must be a single zigzag.
HOURLY CHART
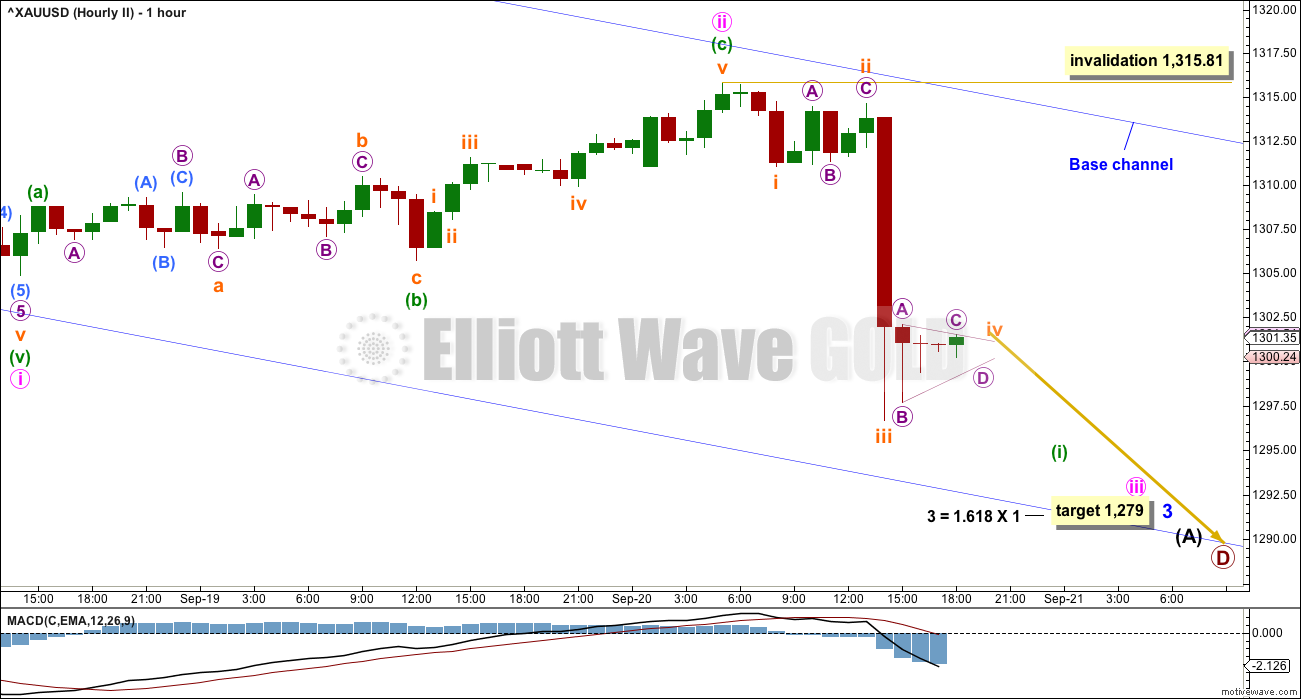
Click chart to enlarge.
1-2-3 of an unfolding impulse and a-b-c of a zigzag have exactly the same subdivisions: 5-3-5. Subdivisions of downwards movement are seen in the same way for both hourly wave counts.
Minor wave 3 may reach a common Fibonacci ratio to minor wave 1.
Minor wave 3 may only subdivide as an impulse. So far minute waves i and ii look complete. Minute wave iii also may only subdivide as an impulse. Within minute wave iii, minuette wave (i) may be close to completion.
When minuette wave (i) is a complete impulse, then a bounce should be expected for minuette wave (ii). Minuette wave (ii) may not move beyond the start of minuette wave (i) above 1,315.81.
When minuette wave (i) may be complete with another low below the low so far today, and price then looks like it has bottomed, draw a Fibonacci retracement along the length of minuette wave (i). Use the 0.382 Fibonacci ratio as a preferred target for minuette wave (ii). At this stage, within a third wave, corrections may begin to be more brief and shallow.
The base channel is exactly the same as the Elliott channel on the first wave count. If this second wave count is correct, then along the way down corrections should find resistance about the upper edge of the base channel.
A third wave should have the power to break below a base channel. If price does break below the lower trend line, that shall offer a little confidence in this wave count.
TECHNICAL ANALYSIS
WEEKLY CHART
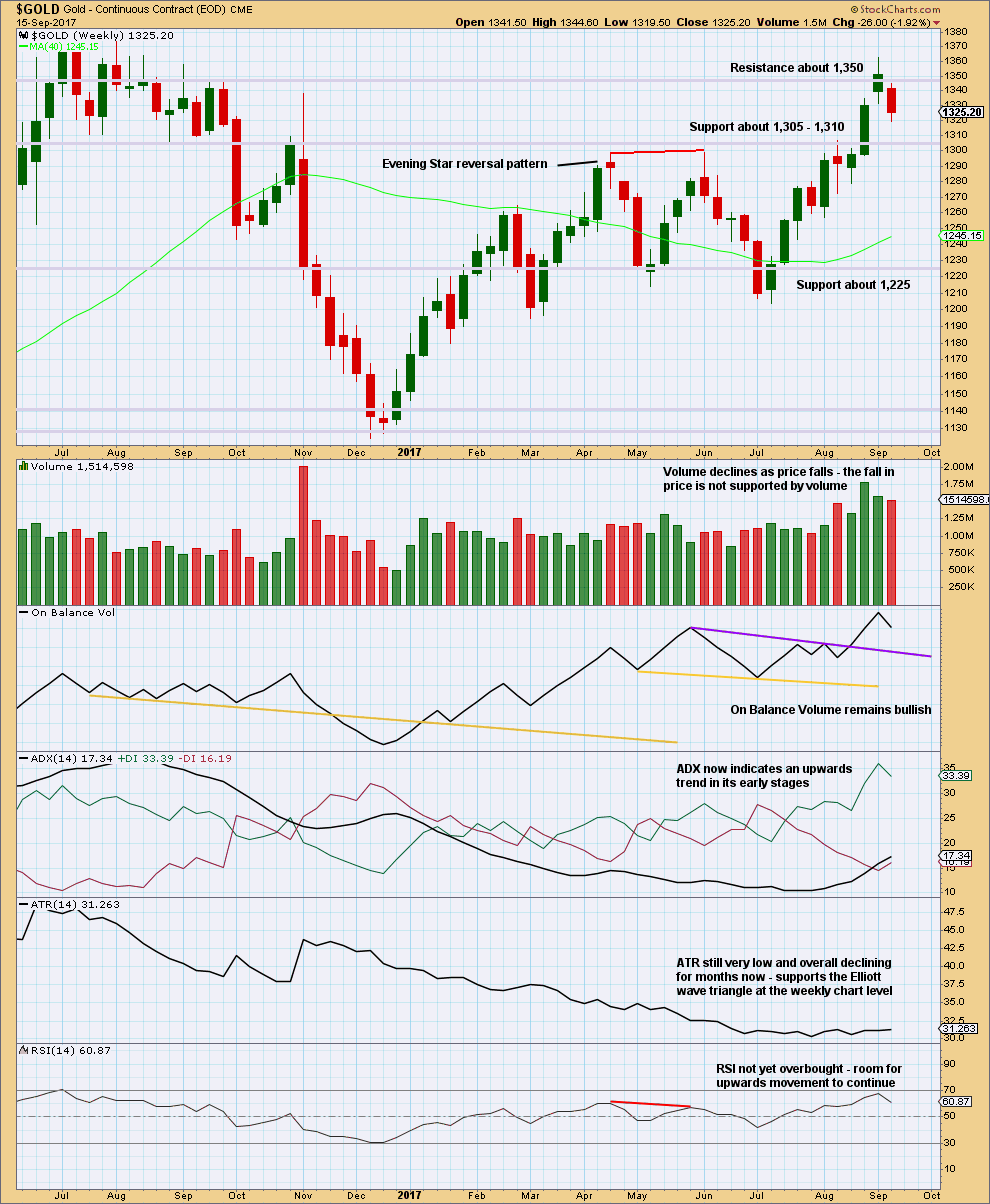
Click chart to enlarge. Chart courtesy of StockCharts.com.
Last weekly candlestick completes as very bearish. It is not engulfing the prior weekly candlestick, but it is even more bearish than that. The week gaps open lower and then closes well below the prior weekly candlestick. Bears dominated last week. They managed to pull price down to new lows substantially below the prior week, closing below the lower wick of the week before.
This candlestick supports the second Elliott wave count.
ADX and On Balance Volume however remain very bullish.
DAILY CHART
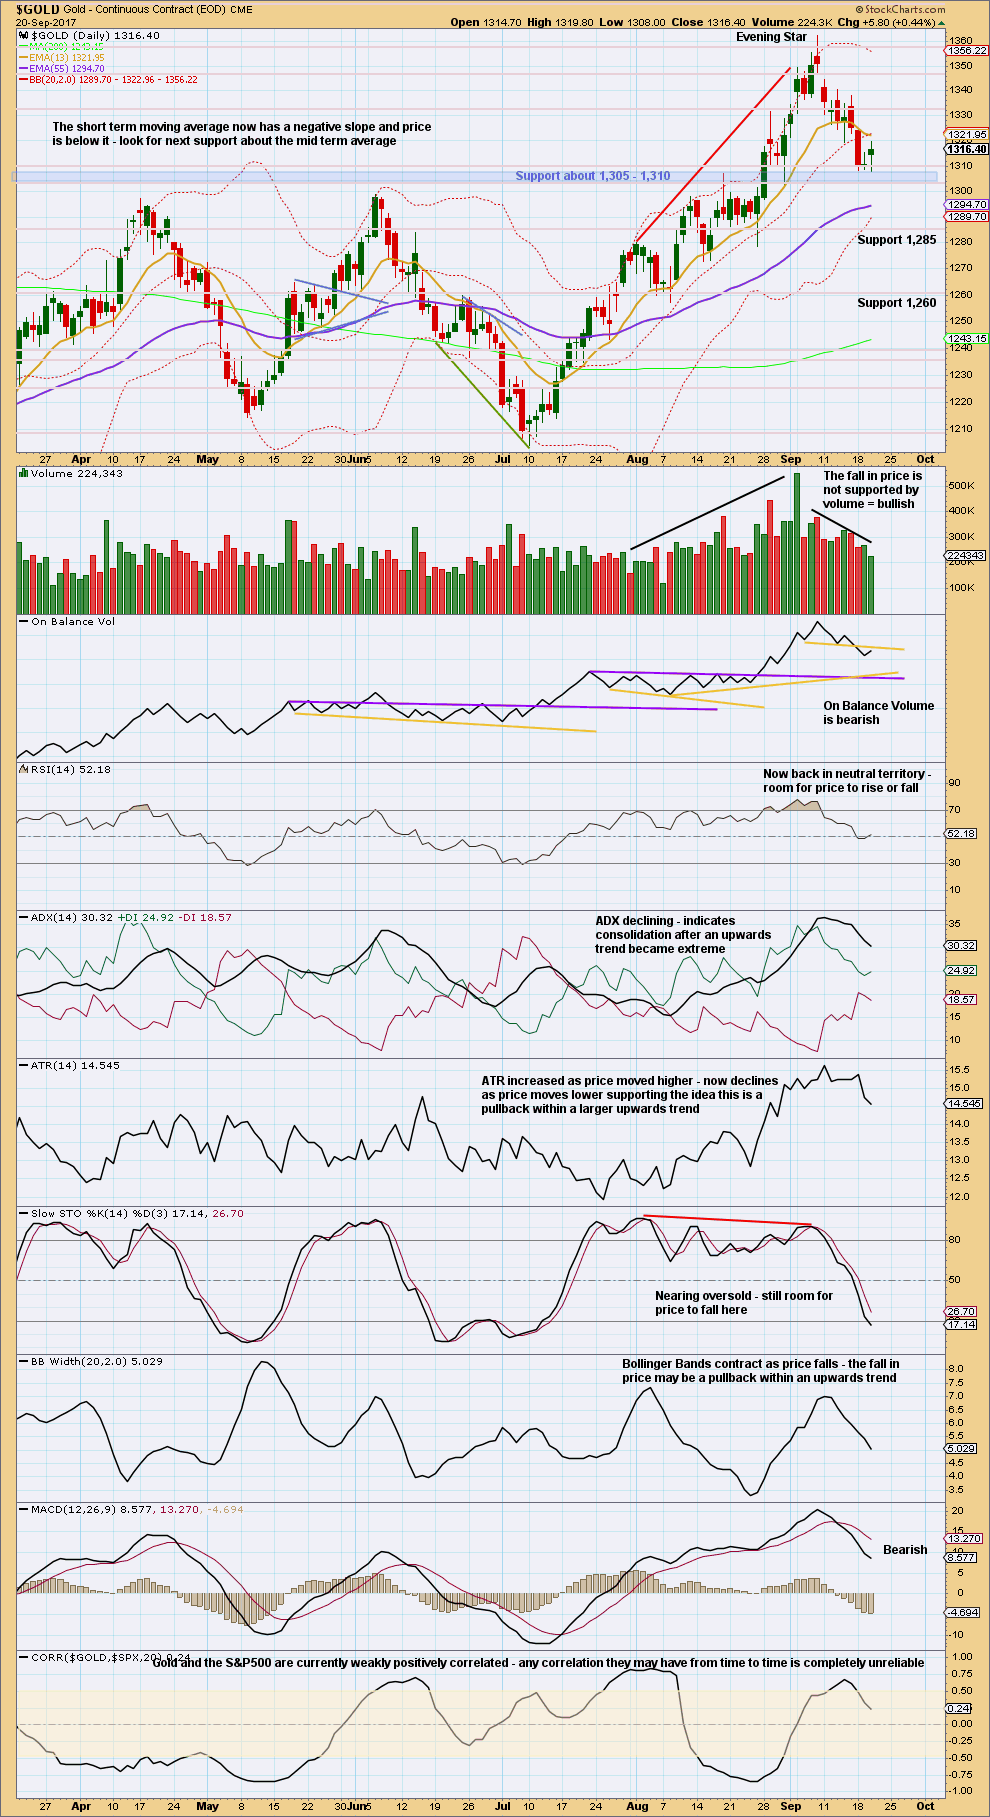
Click chart to enlarge. Chart courtesy of StockCharts.com.
Today’s data from StockCharts does not include the strong fall in price at the end of this session.
While the longer wick on today’s candlestick looks slightly bullish, the decline in volume for a day with the balance of volume upwards is bearish. And we know that price has fallen strongly to new lows.
Support about 1,305 to 1,310 is giving way, so it may now become resistance.
Resistance on price and resistance on On Balance Volume may serve to force any corrections now to be relatively shallow. Next support is about 1,285. Stochastics is not yet oversold and exhibits no divergence with price, so expect price to keep falling.
GDX
DAILY CHART

Click chart to enlarge. Chart courtesy of StockCharts.com.
With the gap now closed, it cannot be labelled a measuring gap and must be labelled an exhaustion gap. GDX may be nearing a low but not quite there yet.
Stochastics is only just entering oversold. Do not expect a low to be in place until it is fully oversold and then exhibits some divergence with price.
Next support for price is about 22.75.
Strong volume and a strong bearish signal from On Balance Volume both suggest more downside here.
Published @ 07:48 p.m. EST.
Nested on GLD?
Thoughts
Updated first hourly chart:
If minute b took a bit longer and was a combination, then minute c isn’t done yet.
It may be just getting ready to wind up for the middle of a strong third wave down.
Here the proportions of minute a, b and c look better. But the current overlapping is a problem.
If price falls below the lower edge of the channel and accelerates, use this wave count for sure.
Targets remain the same. Please note, my invalidation point was slightly wrong. It should be 1,315.81, not 1,315.70.
As per Dreamer’s idea below, it’s possible the correction is closer to completion than the target at 1,261.
If minute b was quicker and just a single zigzag and not a combination. Then minute c could be in it’s final fifth wave now.
And again as Dreamer notes an ending expanding diagonal may be unfolding right now.
will add more detail and publish this in todays analysis
1290
B of ii?
tempting to go long for the 50% ~1301 in C=ii
Another update. At minimum, a tradable bottom is likely. At best, Minor 2 may be complete as shown. Good luck
https://www.tradingview.com/x/f5Hle7NQ/
I’m having trouble labelling the action btw 7pm and 7am
is wave i down done at ~1292?
weird overlap here at the tail end, not sure what to make of it or already
in iii?
Thoughts?
Thanks
Patrick, I’m looking at a possible ending expanding diagonal to end the correction very soon. I know this goes against Lara’s deeper correction count, so it may not pan out. That said, I think it’s worth watching.
Gold needs to make one more low below 1,290.59 for the 5th wave of the diagonal to be longer than the 3rd. If it makes the new low, then moves up strong, this may work. Good luck.
https://www.tradingview.com/x/0PXQKiV9/
Gold made the new low that I needed to see for this idea @ 1,287.84. It could still go a little lower, but if this idea is correct, it should reverse up pretty soon.
The channel and diagonal trendline overthrow looks pretty good at this point. Possibly a classic “false” breakdown.
If it continues down, then this idea is wrong and look for the downtrend to continue.
im saying sell gold from1350 ounce to im started sell sell
im still saying with out graph gold still good down its my view so every rise sell gold
my idea n lara both idea same great lara
Second hourly chart update:
Gold often exhibits very short fifth waves out of it’s fourth wave triangles. It looks like that’s what may have happened today.
I’d now expect minuette (ii) to be relatively shallow so the first expectation would be the 0.382 Fibonacci ratio about 1,304, which is also now strong resistance in the zone of 1,305 – 1,310.
Lara, curious how this is counted as an impulse? Is it ever OK to just “ignore” a section that doesn’t seem to make sense when the bigger picture appears to be correct?
I actually videoed how I figured that out. Will upload it. Let me go get a wave first….
Yeah, a real wave 🏄♀️
Yep. I did get a few nice little ones. Trying out Cesar’s new board. His latest trick is switch foot, but then he’s a fish.
Lara, any chance of a more shallow correction? Something like this?
https://www.tradingview.com/x/1NqrpEQq/
Yes indeed. Looks like an excellent alternate idea here.
If my wave count is invalidated with a new high now above 1,315.81 this is the best idea I would be able to see.
Thanks. Just want to look at options around the .382 fib. A lot of support around 1,295 – 1,300.
GDX appears to have support near these levels also.
Something like this could work?