
Last analysis (which was just a few hours ago) expected a short term bounce. So far price has moved sideways and very slightly higher.
Summary: The bigger picture sees a pullback continue here to about 1,261. It may be as low as 1,170 – 1,158.
Look out for a short term bounce. It may find resistance about the upper edge of the pink channel on the first hourly chart. If that trend line is breached, then look for it to end about 1,330.
Watch On Balance Volume carefully for a signal. It will come after the next session.
Always trade with stops and invest only 1-5% of equity on any one trade.
New updates to this analysis are in bold.
Last monthly charts for the main wave count are here, another monthly alternate is here, and video is here.
Grand SuperCycle analysis is here.
The wave counts will be labelled first and second. Classic technical analysis will be used to determine which wave count looks to be more likely.
FIRST ELLIOTT WAVE COUNT
WEEKLY CHART
Click chart to enlarge.
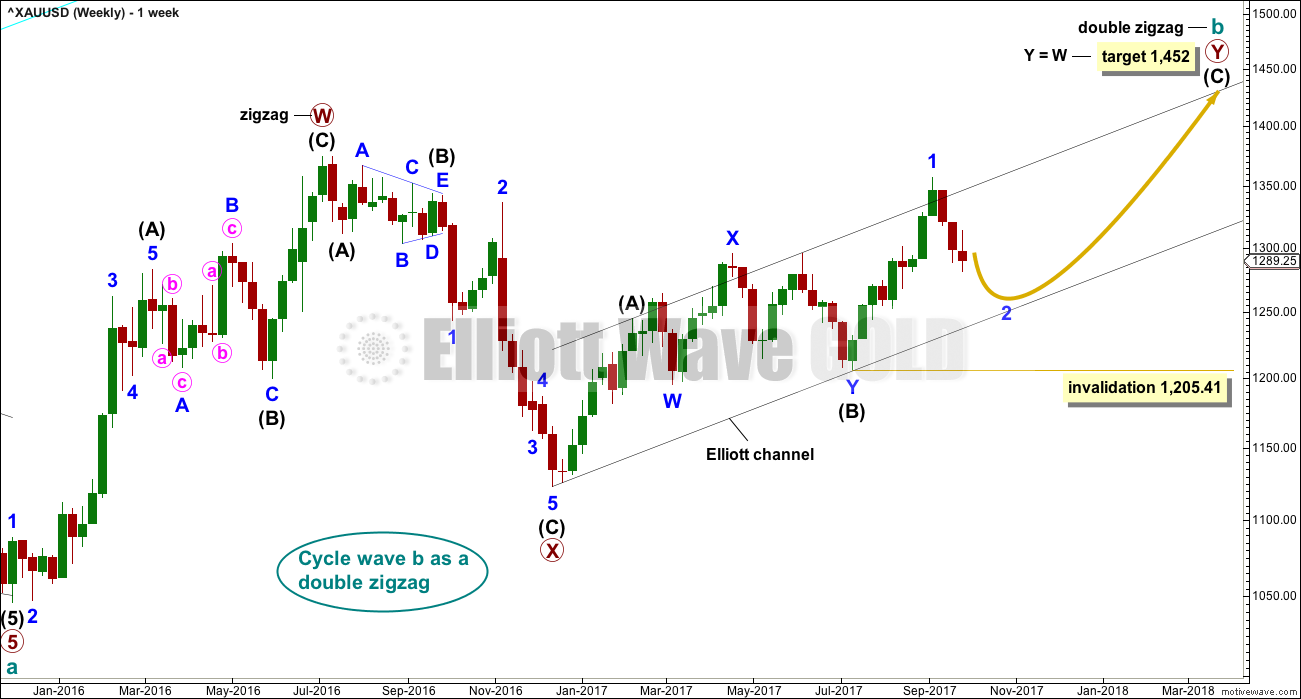
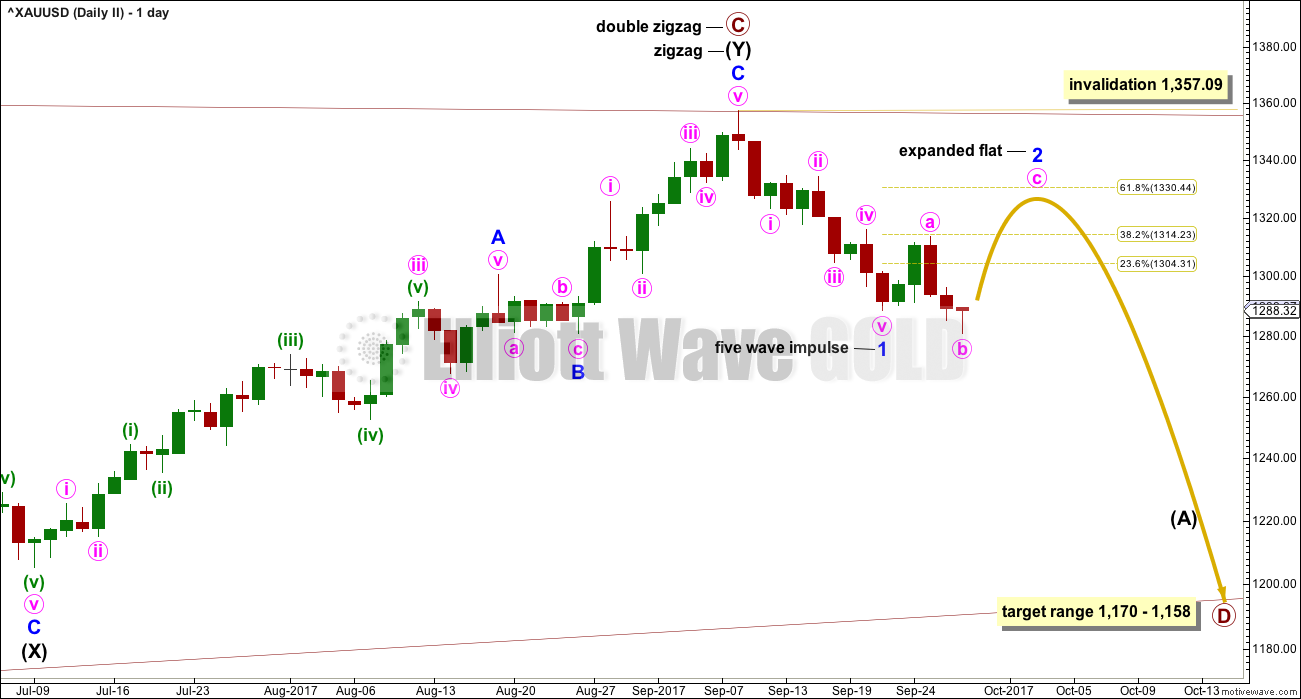
There are more than 23 possible corrective structures that B waves may take, and although cycle wave b still fits well at this stage as a triangle, it may still be another structure. This wave count looks at the possibility that it may be a double zigzag.
If cycle wave b is a double zigzag, then current upwards movement may be part of the second zigzag in the double, labelled primary wave Y.
The target remains the same.
Within intermediate wave (C), no second wave correction may move beyond the start of its first wave below 1,205.41. However, prior to invalidation, this wave count may be discarded if price breaks below the lower edge of the black Elliott channel. If this wave count is correct, then intermediate wave (C) should not break below the Elliott channel which contains the zigzag of primary wave Y upwards.
There are two problems with this wave count which reduce its probability in terms of Elliott wave:
1. Cycle wave b is a double zigzag, but primary wave X within the double is deep and time consuming. While this is possible, it is much more common for X waves within double zigzags to be brief and shallow.
2. Intermediate wave (B) within the zigzag of primary wave Y is a double flat correction. These are extremely rare, even rarer than running flats. The rarity of this structure must further reduce the probability of this wave count.
DAILY CHART
Click chart to enlarge.
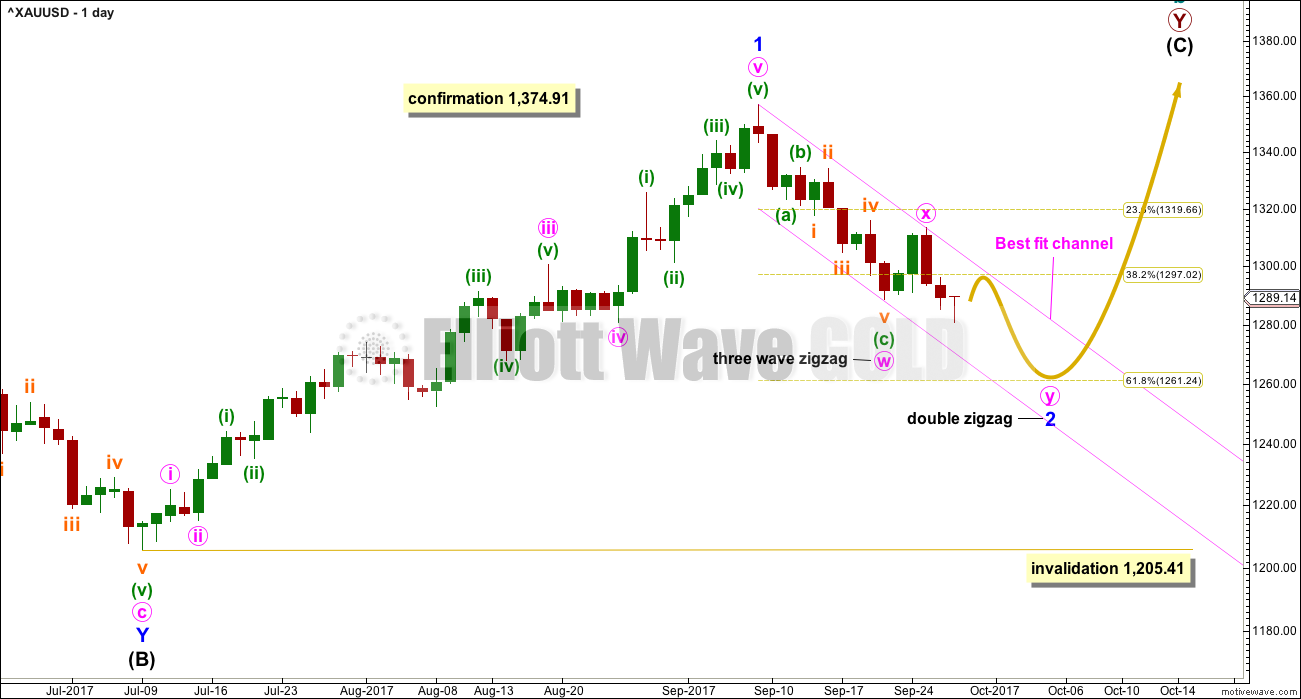
The analysis will focus on the structure of intermediate wave (C). To see details of all the bull movement for this year see daily charts here.
Intermediate wave (C) must be a five wave structure, either an impulse or an ending diagonal. It is unfolding as the more common impulse.
It is possible that minor wave 1 may have been over at the last high and the current pullback may be minor wave 2. Minor wave 2 may not move beyond the start of minor wave 1 below 1,205.41.
Minor wave 2 is not over and may continue lower to reach a more normal depth of about 0.618 the length of minor wave 1, about 1,261. This would also see minor wave 2 have a better proportion to minor wave 1 in terms of duration; minor wave 1 lasted 44 days and so far minor wave 2 has lasted only 14 days. If it continues now for another 7 days, it may total a Fibonacci 21.
HOURLY CHART
Click chart to enlarge.
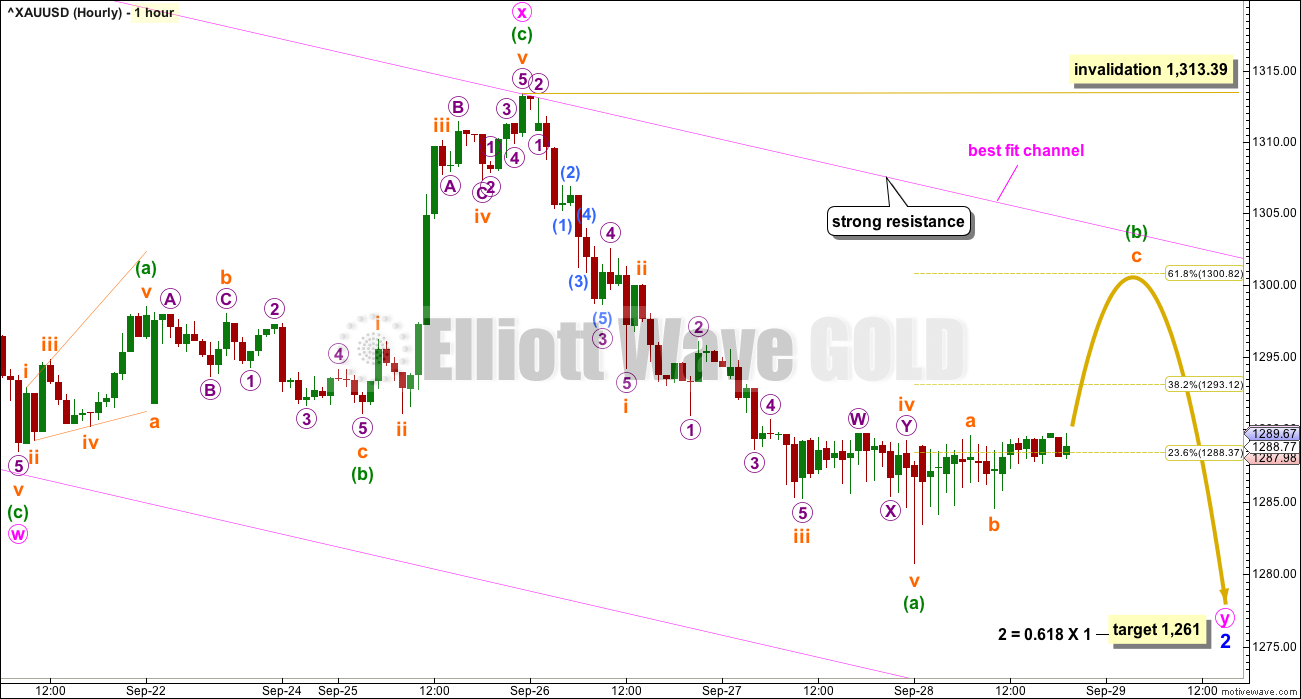
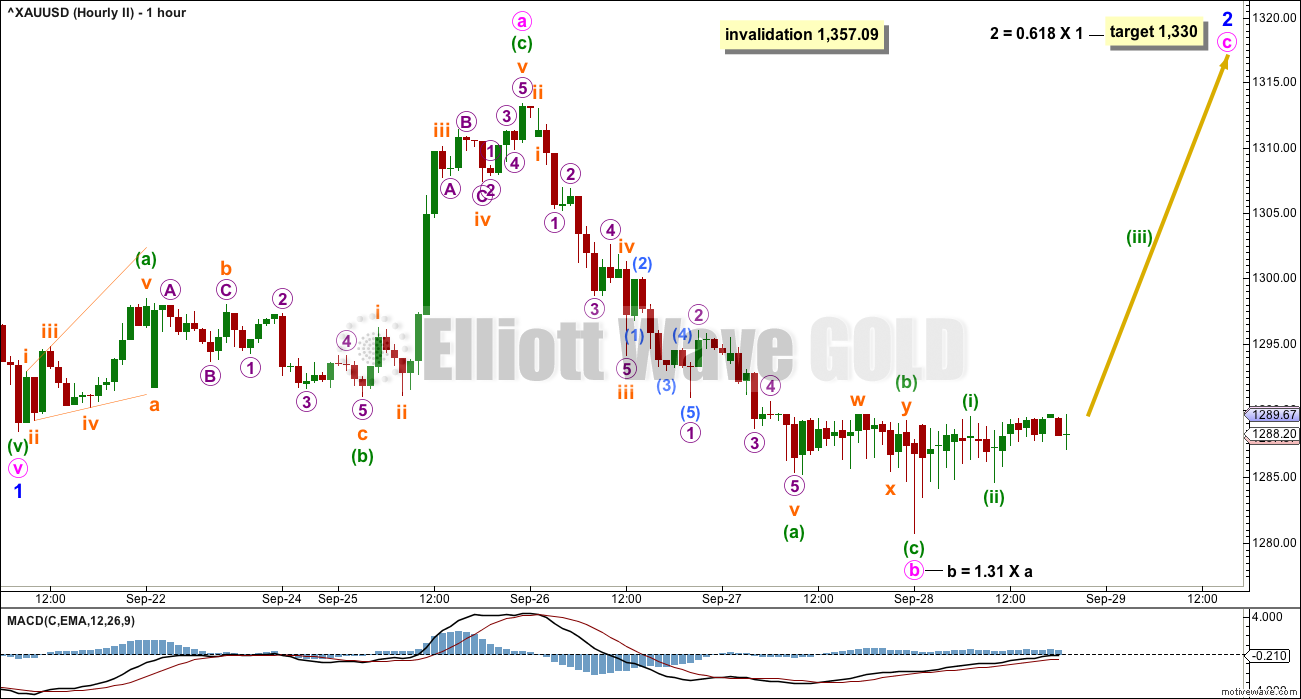
This wave count would expect minor wave 2 to now continue for another 7 days, if it exhibits a Fibonacci duration of a total 21 days.
When the first zigzag in a correction has not moved price deep enough, then a second zigzag should be considered. Here, the first zigzag of minute wave w is only a 0.45 length of minor wave 1. Second wave corrections are usually deeper than this.
X waves within double zigzags are commonly brief and shallow. Minute wave x fits this definition here.
If this correction for minor wave 2 is correctly identified as a double zigzag, then minute wave y must subdivide 5-3-5. Within the zigzag of minute wave y, minuette wave (b) may not move beyond the start of minuette wave (a) above 1,313.39.
Minuette wave (b) for this wave count looks likely now to have begun. The multiple long lower wicks on hourly candlesticks is bullish, as is a signal today from On Balance Volume. If this idea of minor wave 2 as a double zigzag is correct, then the bounce should find very strong resistance at the upper edge of the pink best fit channel.
If price breaks above that pink trend line, then minor wave 2 would be relabelled as a single zigzag in the same way as the second wave count labels this downwards movement.
Note: The labelling on the alternate chart for this downwards movement works in the same way for this main wave count. Minor wave 2 may also be a single zigzag. The low of the 21st of September may be minute wave a. Minute wave b may be continuing sideways as an expanded flat. An explanation of how this works was given in the video published in last analysis. Members are encouraged to watch the video if they are having any confusion here about short term possibilities.
SECOND ELLIOTT WAVE COUNT
WEEKLY CHART
Click chart to enlarge.
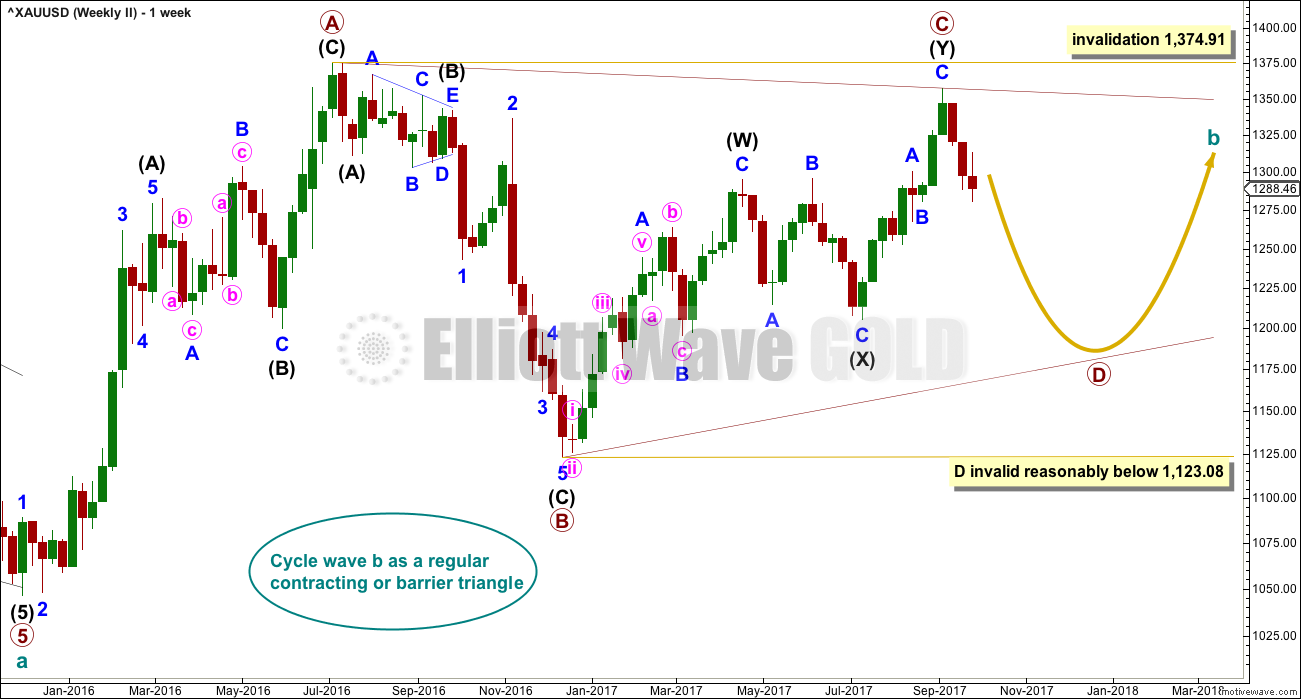
It is still possible that cycle wave b is unfolding as a regular contracting triangle.
Within a triangle, one sub-wave should be a more complicated multiple, which may be primary wave C. This is the most common sub-wave of the triangle to subdivide into a multiple.
Intermediate wave (Y) now looks like a complete zigzag at the weekly chart level.
Primary wave D of a contracting triangle may not move beyond the end of primary wave B below 1,123.08. Contracting triangles are the most common variety.
Primary wave D of a barrier triangle should end about the same level as primary wave B at 1,123.08, so that the B-D trend line remains essentially flat. This involves some subjectivity; price may move slightly below 1,123.08 and the triangle wave count may remain valid. This is the only Elliott wave rule which is not black and white.
Finally, primary wave E of a contracting or barrier triangle may not move beyond the end of primary wave C above 1,295.65. Primary wave E would most likely fall short of the A-C trend line. But if it does not end there, then it can slightly overshoot that trend line.
Primary wave A lasted 31 weeks, primary wave B lasted 23 weeks, and primary wave C lasted 38 weeks.
The A-C trend line now has too weak a slope. At this stage, this is now a problem for this wave count, the upper A-C trend line no longer has such a typical look.
DAILY CHART
Click chart to enlarge.
This second wave count expects the new wave down may be deeper and longer lasting than the first wave count allows for.
A common length for triangle sub-waves is from 0.8 to 0.85 the length of the prior wave. Primary wave D would reach this range from 1,170 to 1,158.
If primary wave C is correctly labelled as a double zigzag, then primary wave D must be a single zigzag.
HOURLY CHART
Click chart to enlarge.
1-2-3 of an unfolding impulse subdivides 5-3-5, exactly the same as a zigzag. This second wave count sees an unfolding impulse at minor degree (the first wave count may see subdivisions in the same way for a zigzag downwards for minor wave 2).
Downwards movement to the last low so far has a slightly neater fit as a zigzag than it does as an impulse.
An expanded flat correction may be unfolding. These are very common structures. Here, minute wave b is within the most common range of up to 1.38 times the length of minute wave a.
The long lower candlestick wicks of the last few hours strongly suggest more upwards movement here. This wave count today still has reasonable support from classic technical analysis.
The target remains the same. Minor wave 2 would most likely end close to the 0.618 Fibonacci ratio of minor wave 1 about 1,330.
TECHNICAL ANALYSIS
WEEKLY CHART
Click chart to enlarge. Chart courtesy of StockCharts.com.
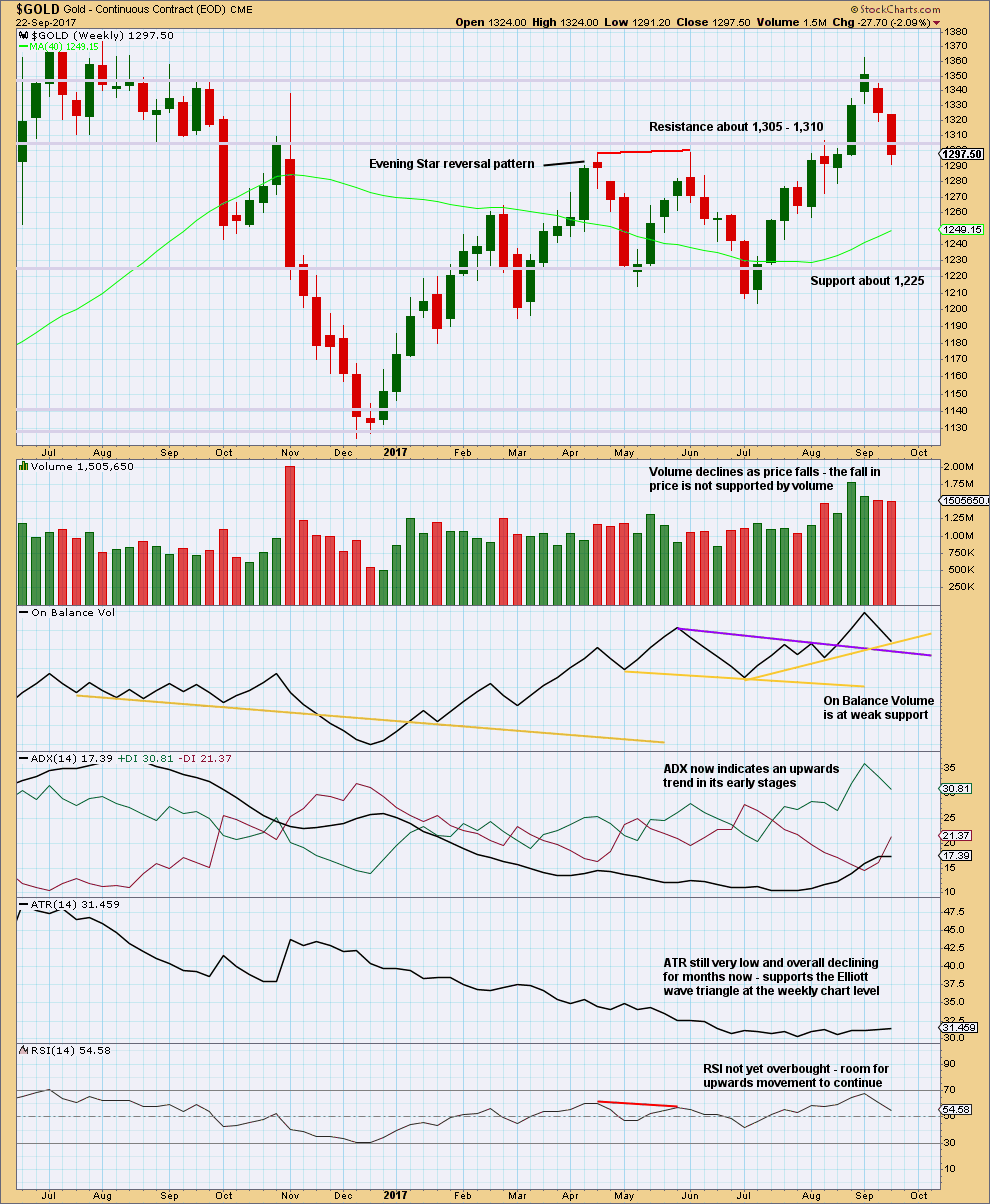
Weak support here from On Balance Volume may halt the fall in price or initiate a small bounce. If On Balance Volume breaks below the support line thisweek, that would be a weak bullish signal.
Overall, this chart remains mostly bullish. At this stage, with downwards movement not being well supported by volume, it should be assumed to be a pullback within a larger trend until shown otherwise.
DAILY CHART
Click chart to enlarge. Chart courtesy of StockCharts.com.
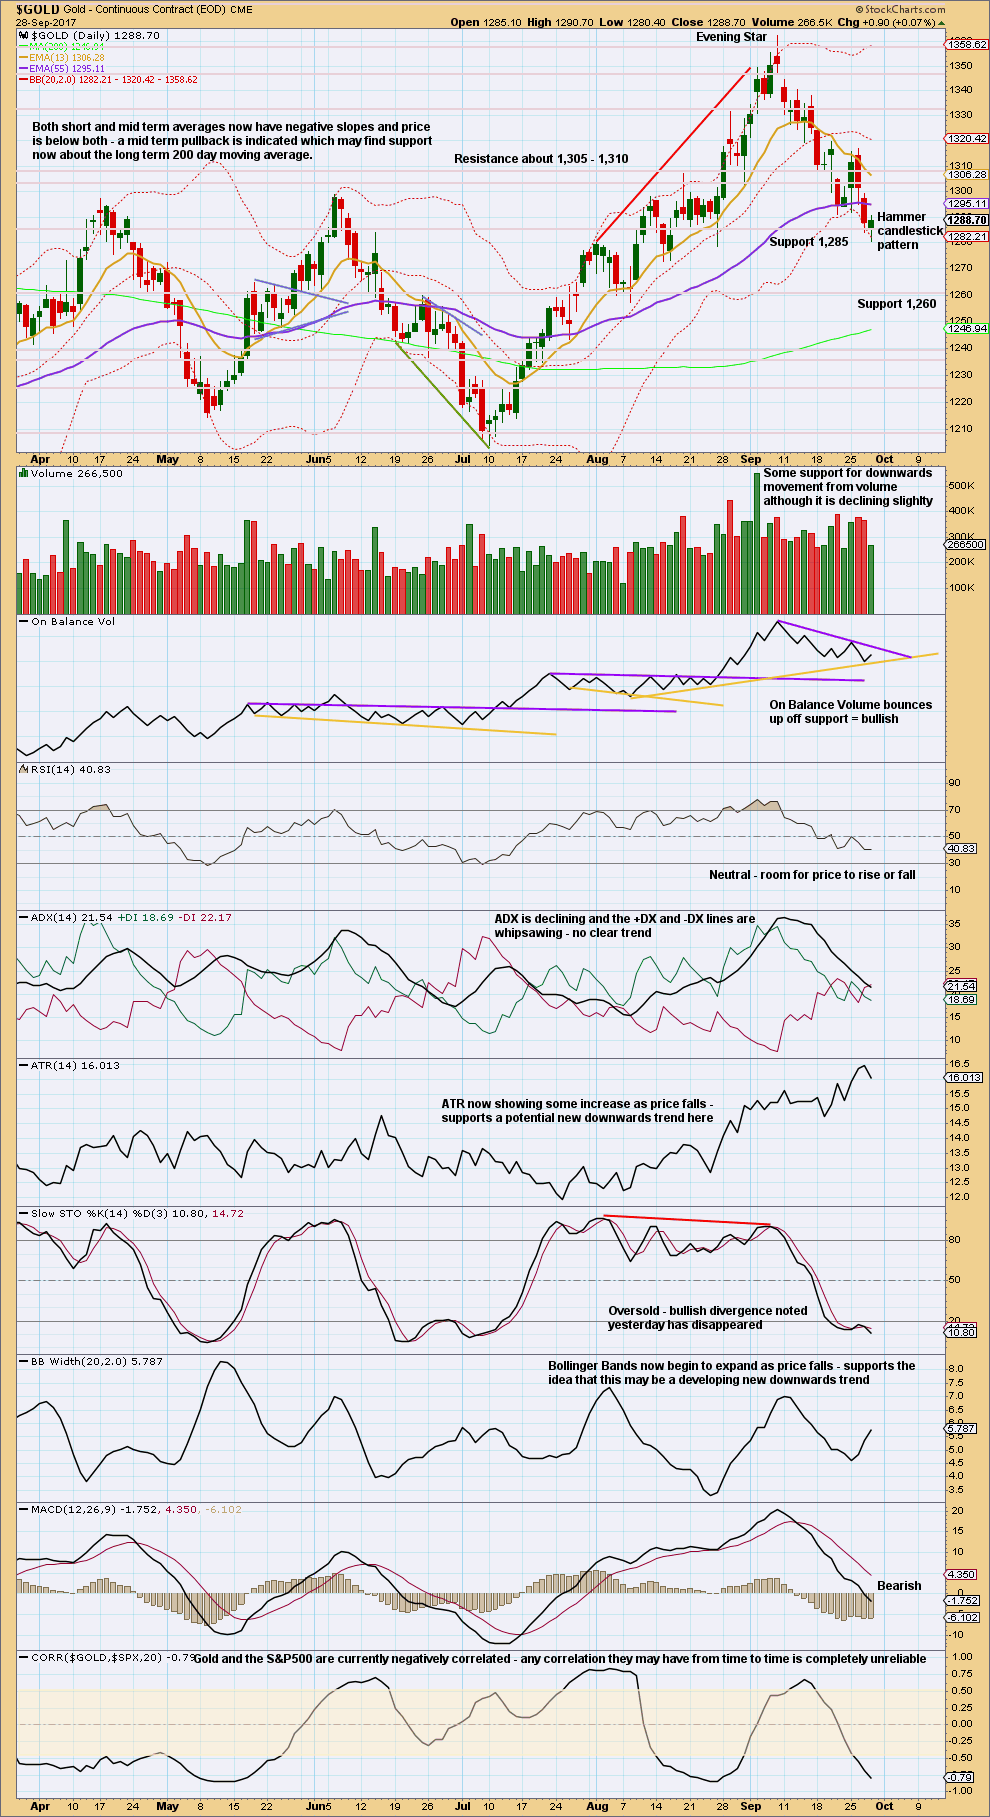
Two pieces of evidence on this chart suggest a bounce up from here: the Hammer candlestick pattern coming after a downwards trend and a bullish signal from On Balance Volume
The purple resistance line on On Balance Volume is close by and may serve to force a bounce to be relatively shallow. However, the purple resistance line does not have good technical significance as it is only tested twice before. A breach above it would be only a weak bullish signal.
GDX
DAILY CHART
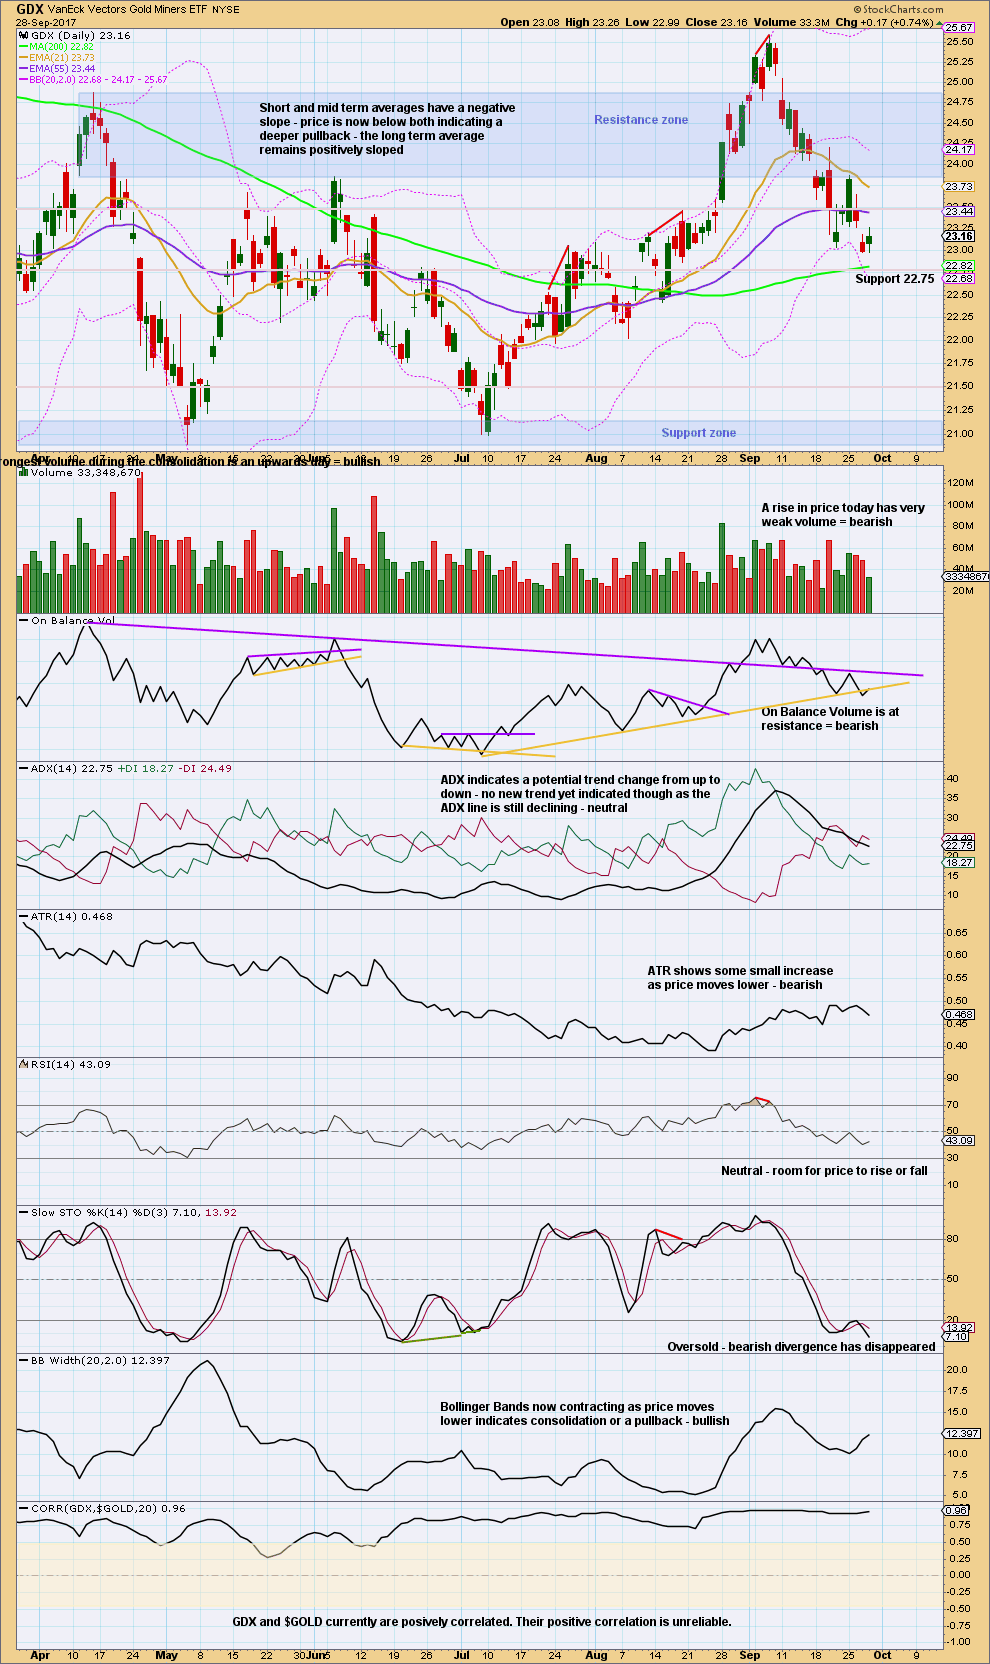
Click chart to enlarge. Chart courtesy of StockCharts.com.
The Spinning Top candlestick today represents indecision, a balance between bulls and bears with the bulls slightly winning today. However, volume is very light.
The bounce may be over now for GDX. On Balance Volume may halt the rise in price here.
Published @ 09:03 p.m. EST.
I will be emailing our members in Hong Kong later today, but in case the email we have on our files for you are not ones you use regularly, I would also like to use our comments to contact you.
We have a few members in Hong Kong, some have been with us now for years. I would like to know if you would like to meet up while I am here. I am in Causeway Bay, and I’ll be here for another week.
If you would like to meet up then please email me admin@elliottwavegold.com
That’s really generous of you to meet with members! HK is a bit far from California, but maybe sometime in the future….
I will certainly be visiting California again in the future, with Cesar’s family living in the USA. And when I do I would love to meet you in person Dreamer!
And a fair few other members over in the States too 🙂
At the hourly level, the picture is optimistic.
Prices have re-entered the (red) cloud. Tenkan-sen resides above the kijun-sen, barely just, and prices sit on top of both. It does look like a recipe for a breakout try of the top cloud boundary in the low 1290s. I’ll expect the going to be slow today. The Bollinger bands are pretty thin for a decent period since yesterday, and unless there is some sign of widening, it’s going to be a very slumberous session.
My guess is that most traders are looking for some sign of action lately. The recent drop has been instigated by a hawkish Yellen, meaning that a December hike is a strong likelihood. Also, Trump has been sending signals bearish to gold with his tax reform proposals. There appears to be some sort of recess from the Dotard-Rocketman Show, and until the drama resumes, gold is just floating around. Perhaps over the weekend?
Friends, I’ll have more time at hand after next Tuesday. This past month, I have volunteered to help our country’s needy students prepare in English, Maths and Science for their national grading exam, in progressing from primary to secondary school (i.e. from Grade 6 to Grade 7 in American parlance). I do so online, so I’m “on call” 24/7. That is why I have been visibly absent most of the time on this forum. Please accept my apologies for this. For now, just a short update.
Gold is still in consolidation mode.
The daily chart shows that prices found support at the top cloud boundary yesterday, and is now bouncing back.
If prices do respect the top cloud boundary, then this bounce can go as high as the peak of 1325 on Oct 23. But, noting that the tenkan-sen is now quite a distance below the kijun-sen, it is very likely that prices could breach the cloud. Anyway, BarChart data appears strange, as Dreamer had pointed out. Almost all candles show long wicks both above and below the candlesticks. This is noticeably absent in other feeds; they appear quite “normal” there.
Oh wow Alan, that’s a wonderful thing you’re doing. And I imagine it would be so very satisfying too.
No need to apologies, but I must admit I am pleased to hear the reason is positive and that you are all okay 🙂
And thank you as always for sharing your valuable analysis with us all.
Alan, they are fortunate to have such a smart and thoughtful mentor. Good for you!
Thank you Lara and Dreamer for your kind thoughts. I do feel immense satisfaction from being a resource person for those kids whose family could not afford private tuition. It is fortunate that our Education Ministry has ensured that each child owns a computer. Hefty subsidies are the norm, and a few local companies are given the contract to provide the computers and Internet services via a block sale. That way, the kids can become computer savvy at the same time.
Education here is highly competitive. This is more so as we had in the past decade welcomed foreign professionals with open arms. Those families of mainland China, Japanese, Taiwanese and Korean origin raise children who are particularly strong in the maths and sciences. Your friends in Hong Kong may have told you this, that the Hong Kong school entrance maths tests, at Grade 1 level, are extremely difficult. Some of the questions are of Mensa standard. I have a friend in the computer industry in the US who said he took more than one hour to solve a pattern recognition problem. If anyone is keen, I can post some of those questions. No maths skill is needed other than basic numeracy and pattern recognition. Luckily, Singapore school entrance at Grade 1 has not approached that level. We make a level playing field for everyone as far as is possible. This is not so at the Secondary level. The national entrance exam is really tough. For English, they are expected to know their tenses and prepositions well. As we all know, prepositions are the hardest part of the English language. They are also expected to write narrative essays using hooks and flashback techniques. In maths, I have come across simultaneous and quadratic equations, things I only learnt at Secondary level during my time. Science questions focus on applications, not a mere regurgitation of facts. One interesting question in the physical sciences asks the students to draw the magnetic field in a quadrupole. Now you can see why it is so difficult nowadays to be an Asian kid.
Sounds pretty intense. Go ahead and post a pattern recognition problem if you like. Might be fun (and relative) for some EWG members.
Wow! Yeah, that is intense!
My friend here in Hong Kong had all her schooling in New Zealand. Which is very relaxed in comparison.
For sure do post a question for us all Alan. Lets see if together we can figure it out, that would be fun 🙂
Here’s PM Bull
Thank you Dreamer. Evidence that there really is something wrong with the BarChart data 🙁
And my BarChart data is still looking wrong and weird this morning (my HK time) as I wake up. I had hoped that they’d fix it.
This is really going to make end of week analysis incredibly difficult 🙁
And there’s nothing I can do about it! I have contacted them, but they’ve all gone home for the weekend now.
Lara, just an observation… Barchart price data seems abnormal the last couple of days. Lots of dojis.
Take a look at PM Bull data compared to BarChart. Maybe it has something to do with futures expiration, but I don’t think I have seen this before.
Glad I’m not the only one thinking this is really weird. I’ve cleared history and reloaded data a few times… and it’s still the same.
Pretty poor form from BarChart I think.
I expect they’ll fix it soon…. but anyway, it’s sideways for both BarChart and PM Bull.