
A short term bounce was expected to continue for Friday. Price made a higher high and a higher low fitting the definition of upwards movement. The Elliott wave counts for this week nicely predicted price action.
Summary: The bigger picture sees a pullback continue here to about 1,261. It may be as low as 1,170 – 1,158.
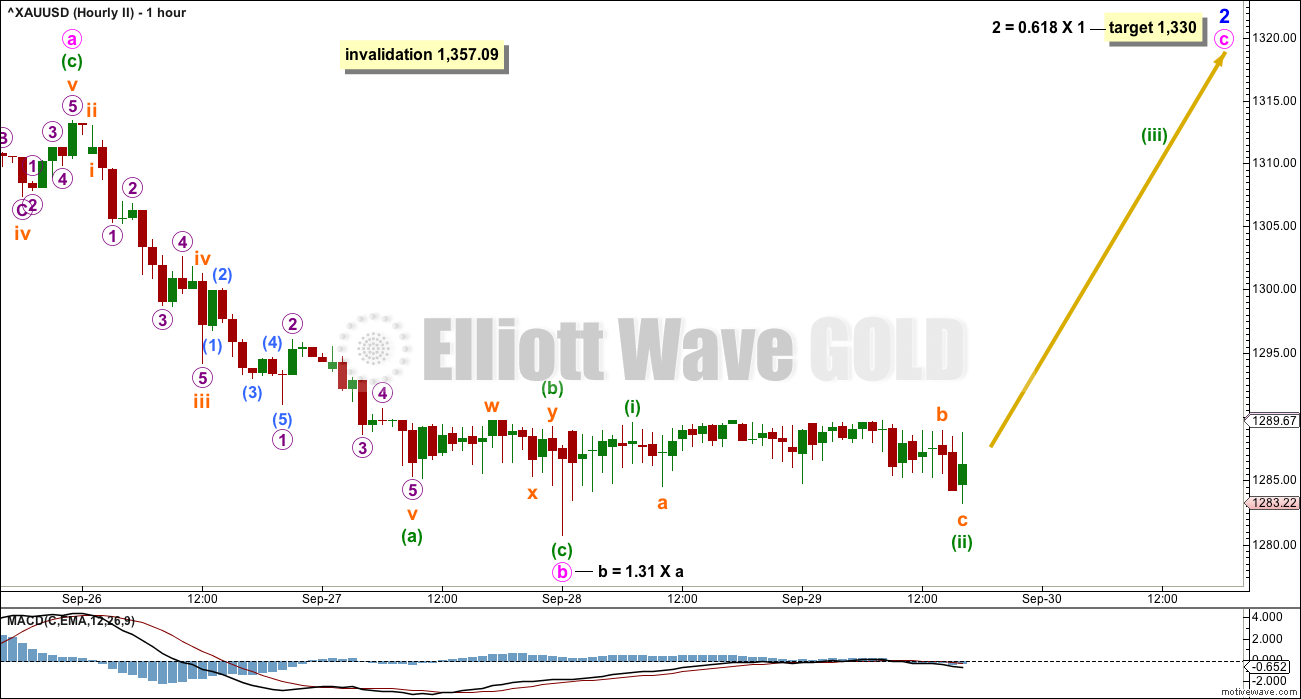
Look out for a short term bounce. It may find resistance about the upper edge of the pink channel on the first hourly chart, which would see the bounce very shallow, maybe only as high as about 1,293. If the pink trend line is breached, then look for the bounce to end about 1,330.
The signal which was expected from On Balance Volume has not come. The signal must come early next week because the trend lines are quickly contracting.
Always trade with stops and invest only 1-5% of equity on any one trade.
New updates to this analysis are in bold.
Last monthly charts for the main wave count are here, another monthly alternate is here, and video is here.
Grand SuperCycle analysis is here.
The wave counts will be labelled first and second. Classic technical analysis will be used to determine which wave count looks to be more likely.
FIRST ELLIOTT WAVE COUNT
WEEKLY CHART
Click chart to enlarge.
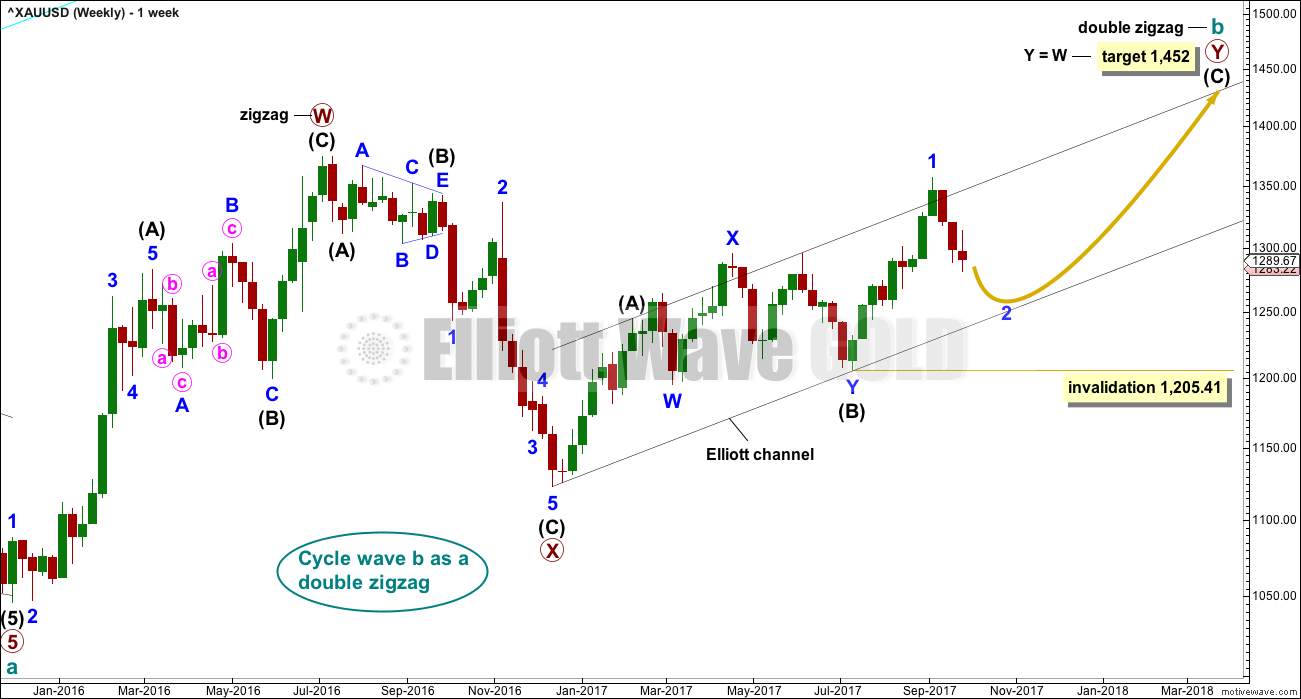
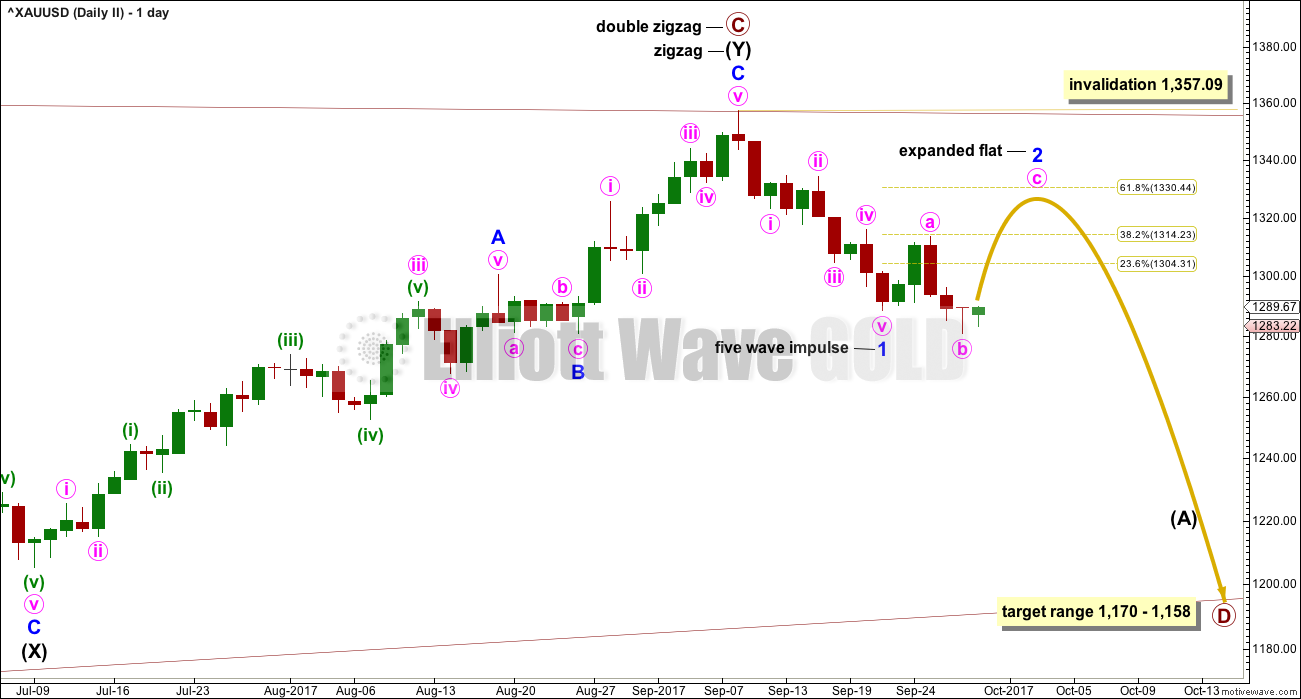
There are more than 23 possible corrective structures that B waves may take, and although cycle wave b still fits well at this stage as a triangle, it may still be another structure. This wave count looks at the possibility that it may be a double zigzag.
If cycle wave b is a double zigzag, then current upwards movement may be part of the second zigzag in the double, labelled primary wave Y.
The target remains the same.
Within intermediate wave (C), no second wave correction may move beyond the start of its first wave below 1,205.41. However, prior to invalidation, this wave count may be discarded if price breaks below the lower edge of the black Elliott channel. If this wave count is correct, then intermediate wave (C) should not break below the Elliott channel which contains the zigzag of primary wave Y upwards.
There are two problems with this wave count which reduce its probability in terms of Elliott wave:
1. Cycle wave b is a double zigzag, but primary wave X within the double is deep and time consuming. While this is possible, it is much more common for X waves within double zigzags to be brief and shallow.
2. Intermediate wave (B) within the zigzag of primary wave Y is a double flat correction. These are extremely rare, even rarer than running flats. The rarity of this structure must further reduce the probability of this wave count.
DAILY CHART
Click chart to enlarge.
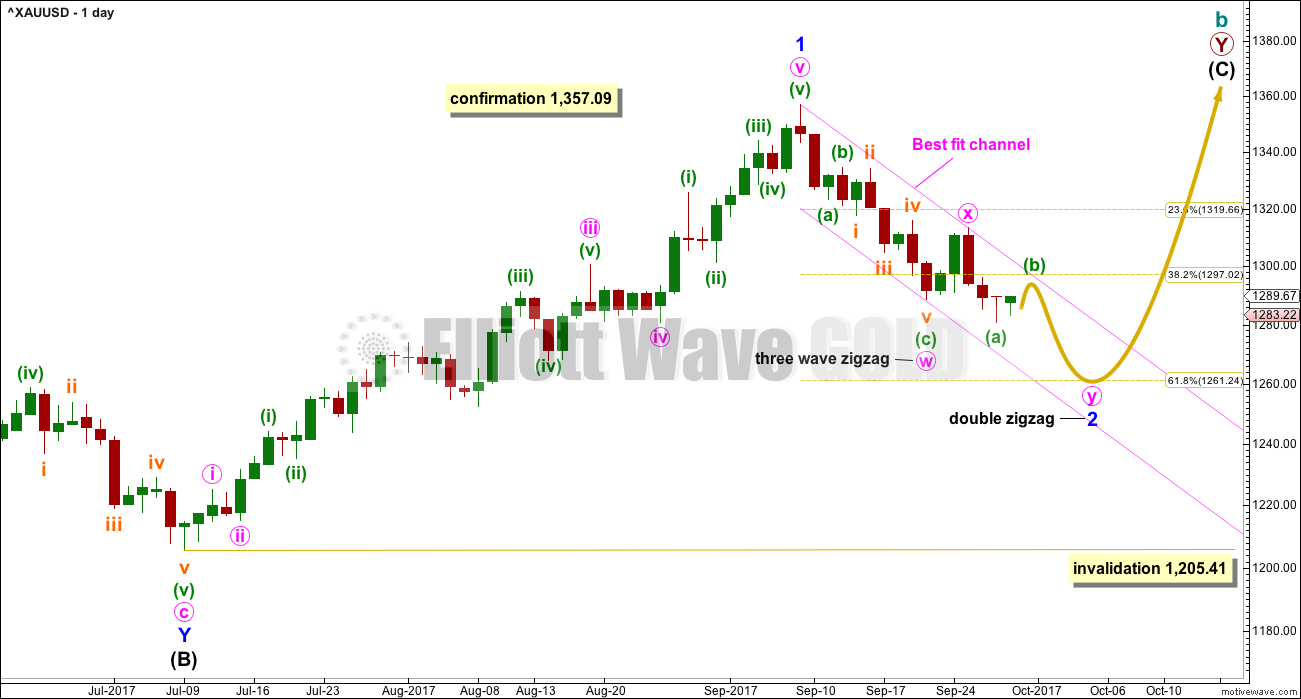
The analysis will focus on the structure of intermediate wave (C). To see details of all the bull movement for this year see daily charts here.
Intermediate wave (C) must be a five wave structure, either an impulse or an ending diagonal. It is unfolding as the more common impulse.
It is possible that minor wave 1 may have been over at the last high and the current pullback may be minor wave 2. Minor wave 2 may not move beyond the start of minor wave 1 below 1,205.41.
Minor wave 2 is not over and may continue lower to reach a more normal depth of about 0.618 the length of minor wave 1, about 1,261. This would also see minor wave 2 have a better proportion to minor wave 1 in terms of duration; minor wave 1 lasted 44 days and so far minor wave 2 has lasted only 15 days. If it continues now for another 6 days, it may total a Fibonacci 21.
The confidence point can now be moved lower to match the new invalidation point for the second wave count.
HOURLY CHART
Click chart to enlarge.
Note: I am aware that currently BarChart data for Gold is inaccurate. It looks very strange and wrong on the five minute chart. I have contacted BarChart, but I do not expect to get a response now until next week. I will supplement my consideration of hourly price movement with StockCharts data for the session.
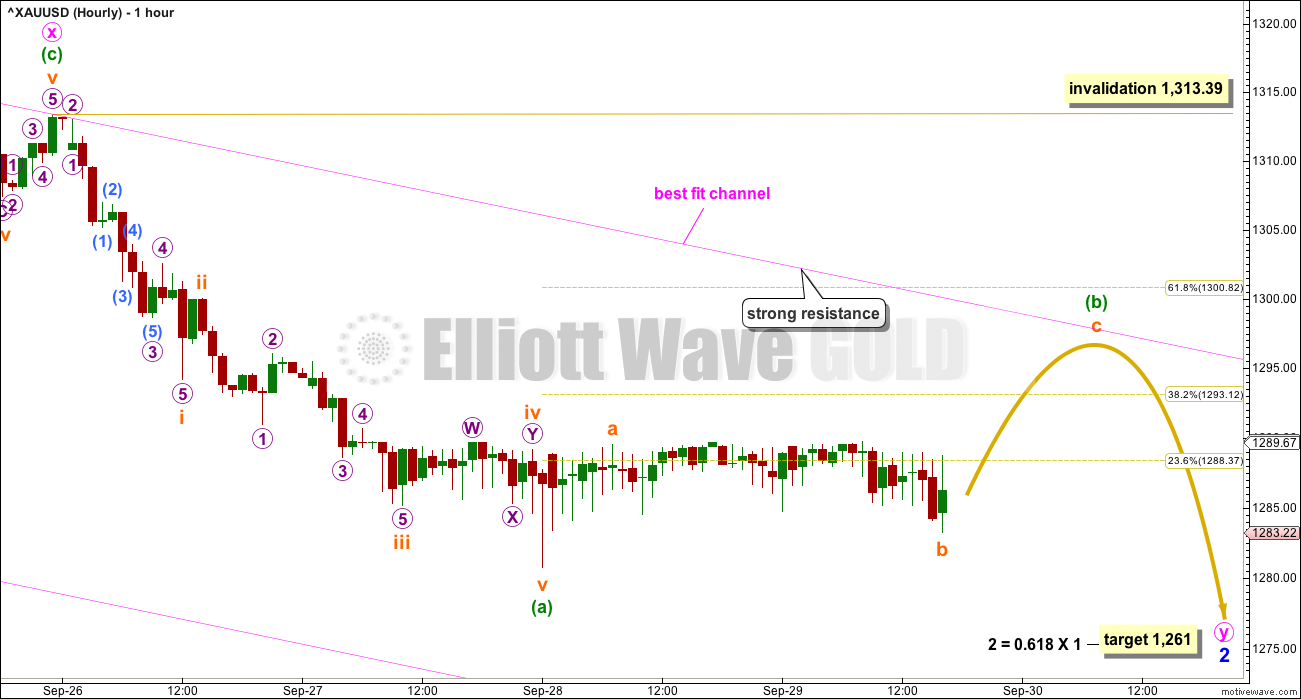
This wave count would expect minor wave 2 to now continue for another 6 days, if it exhibits a Fibonacci duration of a total 21 days.
When the first zigzag in a correction has not moved price deep enough, then a second zigzag should be considered. Here, the first zigzag of minute wave w is only a 0.45 length of minor wave 1. Second wave corrections are usually deeper than this.
X waves within double zigzags are commonly brief and shallow. Minute wave x fits this definition here.
If this correction for minor wave 2 is correctly identified as a double zigzag, then minute wave y must subdivide 5-3-5. Within the zigzag of minute wave y, minuette wave (b) may not move beyond the start of minuette wave (a) above 1,313.39.
Minuette wave (b) for this wave count looks likely now to have begun. Overall, the last two sessions have moved price sideways. While subdivisions of this movement cannot be properly analysed due to the inaccuracy of BarChart data at this time, it can be accepted this sideways movement would easily fit as minuette wave (b).
If price breaks above that pink trend line, then minor wave 2 would be relabelled as a single zigzag in the same way as the second wave count labels this downwards movement.
The labelling on the alternate chart for this downwards movement works in the same way for this main wave count. Minor wave 2 may also be a single zigzag. The low of the 21st of September may be minute wave a. Minute wave b may be continuing sideways as an expanded flat. An explanation of how this works will again be given in the end of week video. Members are encouraged to watch the video if they are having any confusion here about short term possibilities.
SECOND ELLIOTT WAVE COUNT
WEEKLY CHART
Click chart to enlarge.
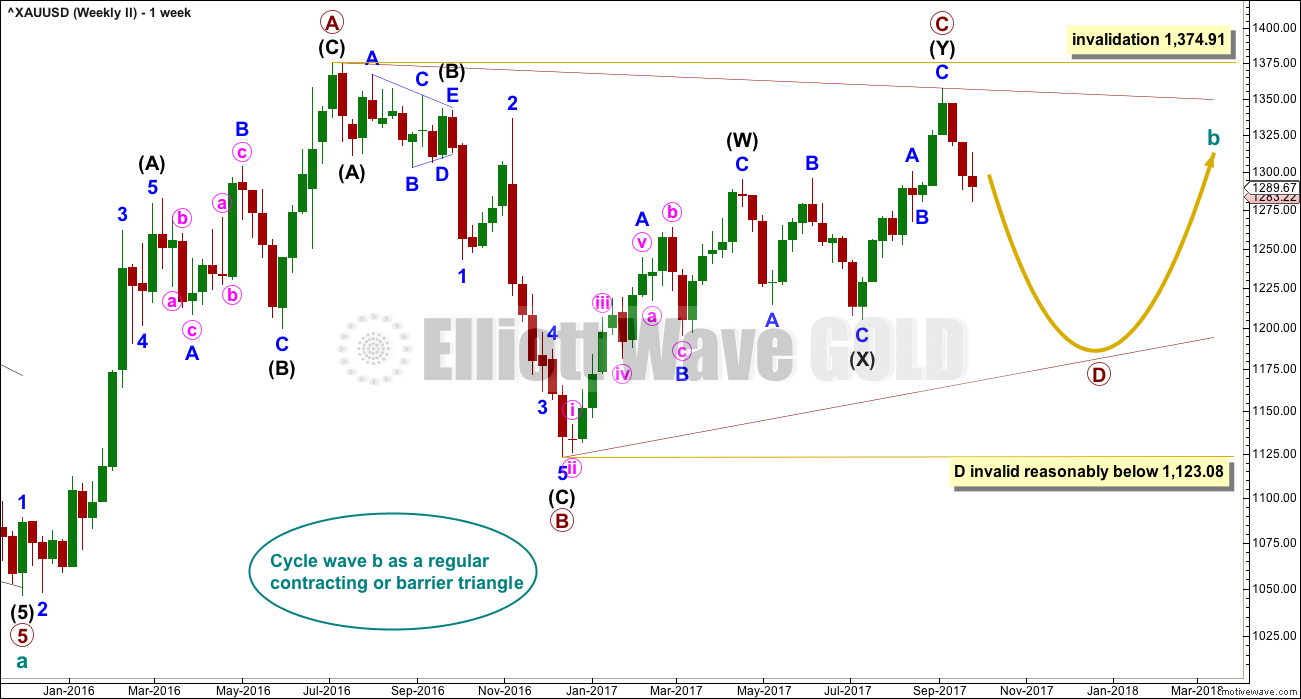
It is still possible that cycle wave b is unfolding as a regular contracting triangle.
Within a triangle, one sub-wave should be a more complicated multiple, which may be primary wave C. This is the most common sub-wave of the triangle to subdivide into a multiple.
Intermediate wave (Y) now looks like a complete zigzag at the weekly chart level.
Primary wave D of a contracting triangle may not move beyond the end of primary wave B below 1,123.08. Contracting triangles are the most common variety.
Primary wave D of a barrier triangle should end about the same level as primary wave B at 1,123.08, so that the B-D trend line remains essentially flat. This involves some subjectivity; price may move slightly below 1,123.08 and the triangle wave count may remain valid. This is the only Elliott wave rule which is not black and white.
Finally, primary wave E of a contracting or barrier triangle may not move beyond the end of primary wave C above 1,295.65. Primary wave E would most likely fall short of the A-C trend line. But if it does not end there, then it can slightly overshoot that trend line.
Primary wave A lasted 31 weeks, primary wave B lasted 23 weeks, and primary wave C lasted 38 weeks.
The A-C trend line now has too weak a slope. At this stage, this is now a problem for this wave count, the upper A-C trend line no longer has such a typical look.
Within primary wave D, no part of the zigzag may move beyond its start above 1,357.09.
DAILY CHART
Click chart to enlarge.
This second wave count expects the new wave down may be deeper and longer lasting than the first wave count allows for.
A common length for triangle sub-waves is from 0.8 to 0.85 the length of the prior wave. Primary wave D would reach this range from 1,170 to 1,158.
If primary wave C is correctly labelled as a double zigzag, then primary wave D must be a single zigzag.
HOURLY CHART
Click chart to enlarge.
1-2-3 of an unfolding impulse subdivides 5-3-5, exactly the same as a zigzag. This second wave count sees an unfolding impulse at minor degree (the first wave count may see subdivisions in the same way for a zigzag downwards for minor wave 2).
Downwards movement to the last low so far has a slightly neater fit as a zigzag than it does as an impulse.
An expanded flat correction may be unfolding. These are very common structures. Here, minute wave b is within the most common range of up to 1.38 times the length of minute wave a.
This wave count today still has reasonable support from classic technical analysis.
The target remains the same. Minor wave 2 would most likely end close to the 0.618 Fibonacci ratio of minor wave 1 about 1,330.
TECHNICAL ANALYSIS
WEEKLY CHART
Click chart to enlarge. Chart courtesy of StockCharts.com.
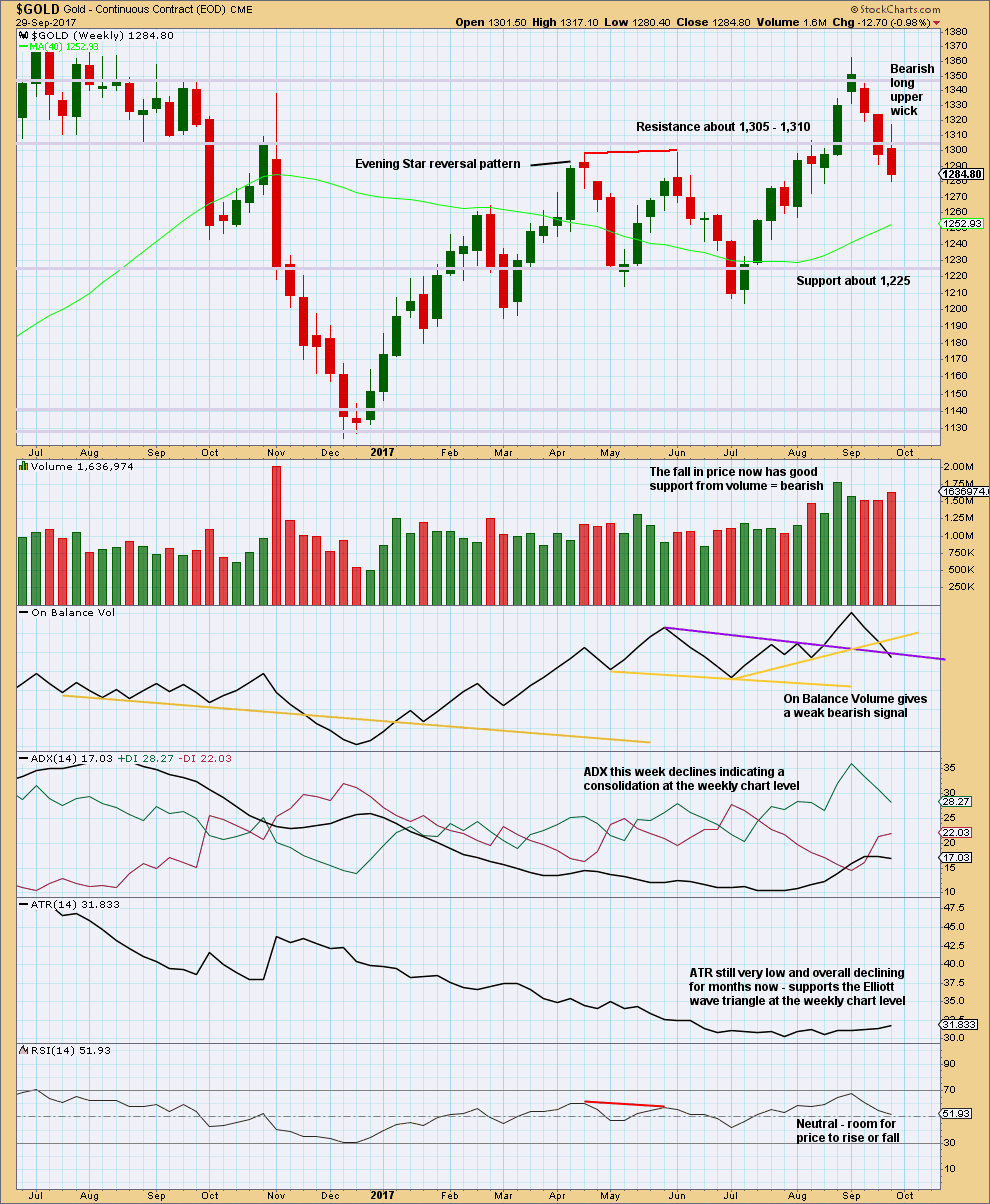
Support of the Elliott wave counts which expect overall more downwards movement next week comes from an increase in volume this week for downwards movement, a bearish upper candlestick wick, and a weak bearish signal now from On Balance Volume.
These signals cannot tell us how far price may fall though. Support and resistance may be used as a guide for this. Next strong support for price is about 1,225.
DAILY CHART
Click chart to enlarge. Chart courtesy of StockCharts.com.
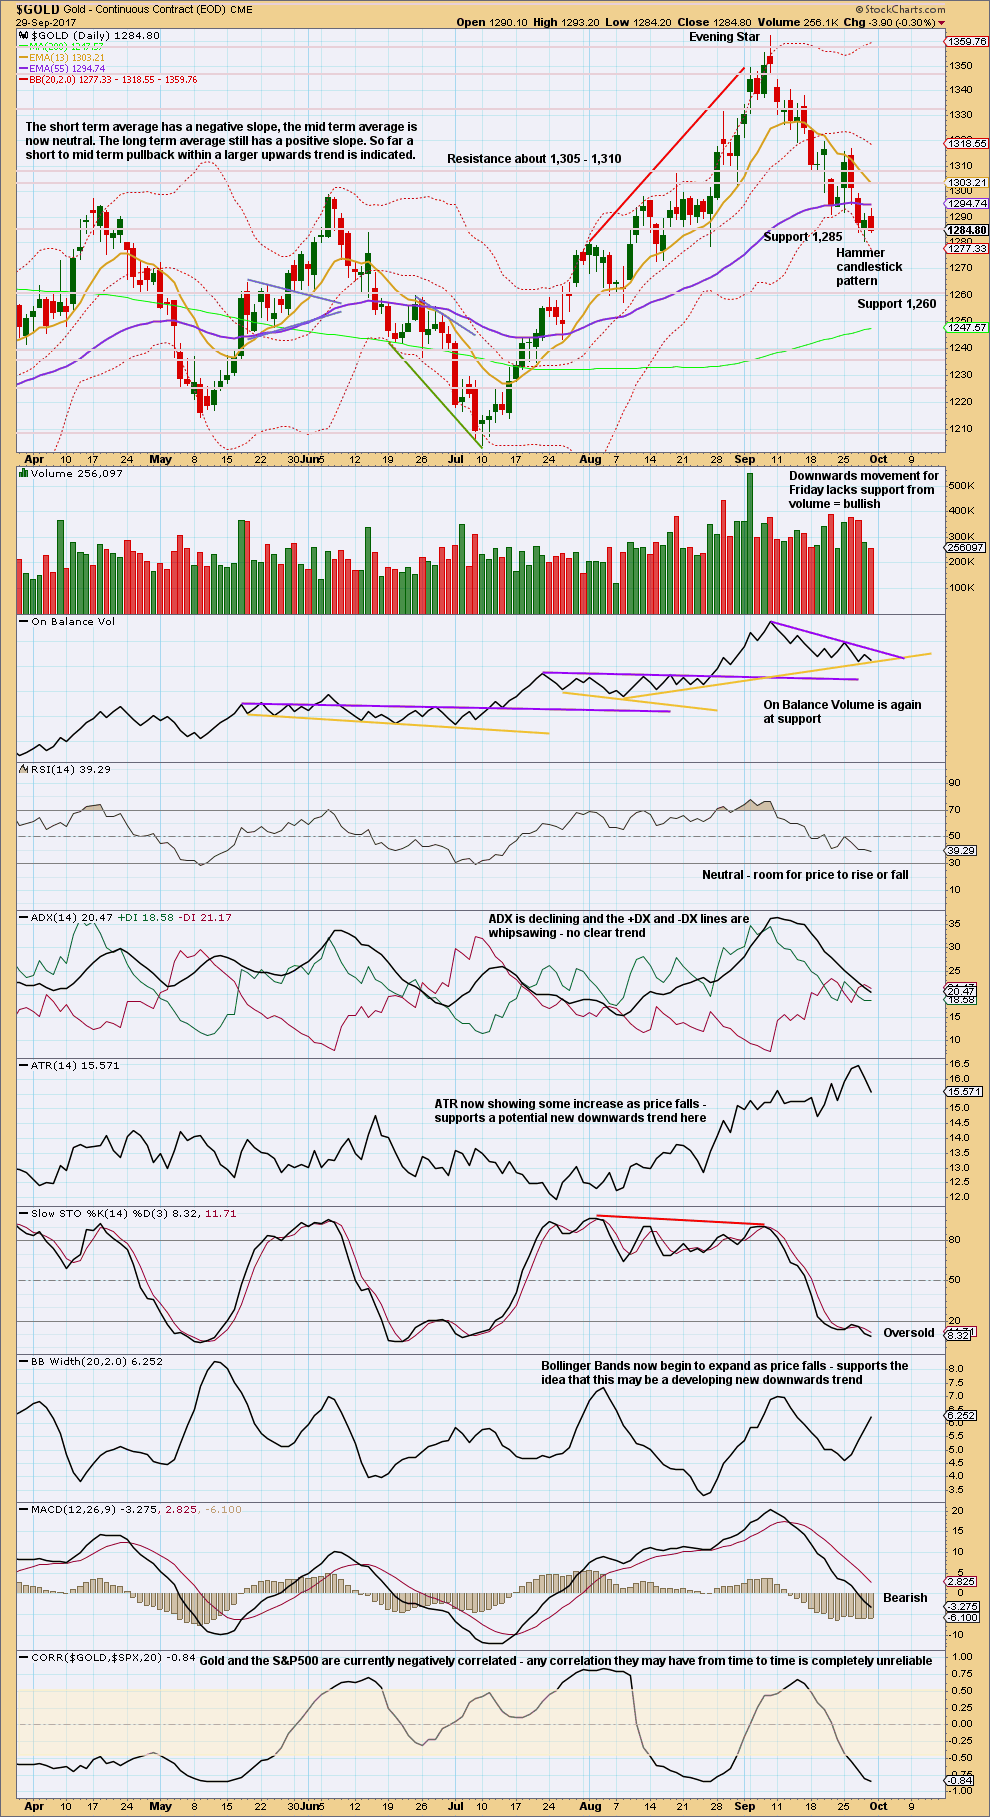
Price moved slightly higher but the candlestick closed red. The balance of volume was downwards, and lighter volume did not support downwards movement during Friday’s session. This supports the hourly Elliott wave counts which expect a bounce to continue a little higher early next week.
Look out for strong resistance above about 1,305 – 1,310.
GDX
DAILY CHART
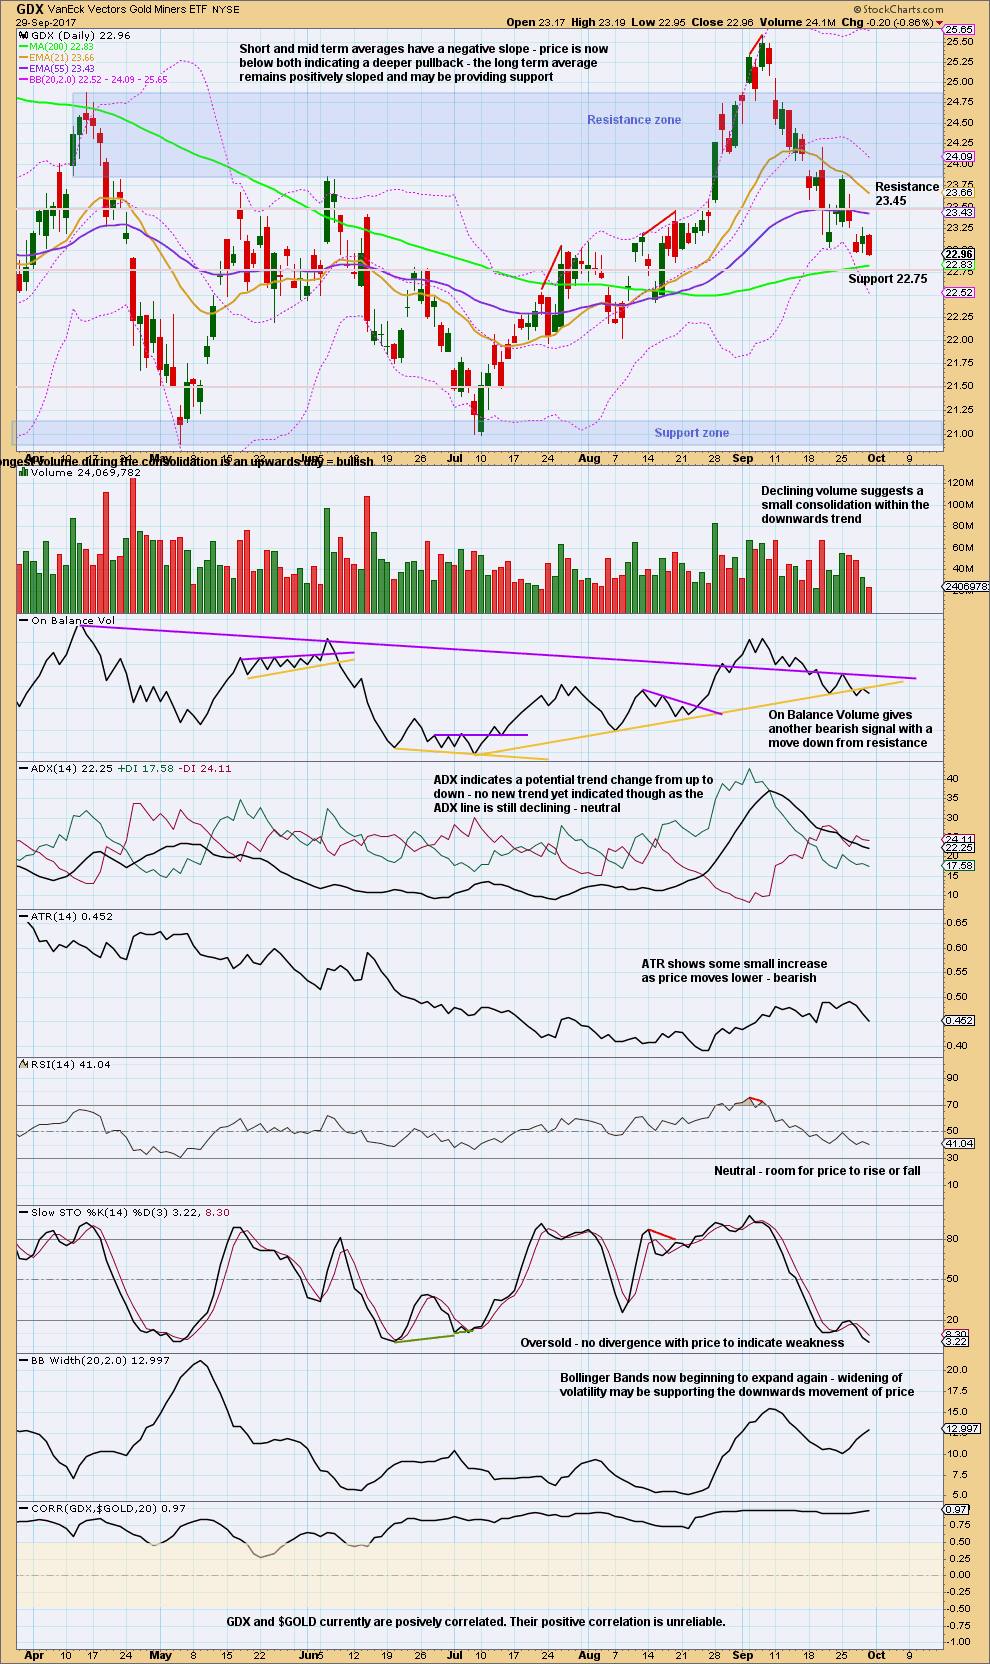
Click chart to enlarge. Chart courtesy of StockCharts.com.
Give reasonable weight to the bearish signal from On Balance Volume. It looks like GDX has completed a small consolidation within a downwards trend.
Expect downwards movement as most likely now from GDX. Next support is about 22.75, and below that about 21.50.
Stochastics can remain extreme for longer than this. Wait for RSI to reach oversold and then exhibit some divergence with price before expecting a low as most likely in place.
Published @ 11:44 p.m. EST.
Lara, I’m looking at a possible ending expanding diagonal to end Minor 2 down. Thoughts?
P.S. Trying to help since your data is bad.
https://www.tradingview.com/x/LB9k4uv4/
Lara, got this response from Barchart today. At least they are working on it. Looks like price did spike down to the current price level although the last couple of days hourly is still wrong.
“Hello,
Thanks for letting us know. I awaiting word on the display of ^XAUUSD from the programmers at this time. When I hear any updates on this I will let you know. Thanks again.
Regards,
Brendan
Barchart.com – Premier Technology, Market Data and Trading Solutions.”
VIEW: Gold price may be in tad oversold territory but there is nothing much happening on the economic calendar during the week to spur Gold price up before the NFP on Friday Oct 06. Imo Gold price remains toppy under 1287 currently facing resistance under 1278 targets 1261/60. Expecting a pullback during the week and wouldn’t be surprised to see Gold price break below 1261/60 for 1252 as Alan mentioned. Gingerly as it goes lol…. Tough to try and pick the bottom on this. At this stage looks unlikely to see anything more than a docile upturn in Gold price to get to or past 1278 for 1283/85 before facing rejection for a swing low unless Gold price goes in for sideways consolidation with 1270/69 holding. CCI is not in good shape on the weekly and heading to cross below zero (0). Remaining short seems to be the right thing to do. Let’s see.
I’m waiting for a rise to 1278.24 (current hourly kijun-sen) and, if it rises above that, 1283.92 (current hourly cloud resistance ) before shorting for the drop. Patience is the word. BarCharts people are still asleep. They haven’t fixed their charts yet. The data I am using are TradingView’s.
The PMI numbers and FED speak on Wednesday Oct 04 could likely set the stage for a knockout blow to Gold price…..
A zoomed-in look at my refined gold target of 1,265.35. Let’s see how it goes
https://www.tradingview.com/x/5XvaI4qT/
Just a quick update on the expected gold direction today.
From the daily Ichimoku chart, prices have fallen below the tenkan-sen and the kijun-sen. The tenkan-sen is well below the kijun-sen, and its slope is steeper thus portending an imminnent larger drop. Prices have broken cloud cover, being now inside the cloud. This means that prices are longer term bullish, but in the short term, it is very bearish.
I expect prices to continue to drop in the near future. The 61.8% Fib at 1263.35 is the nearest target, followed by daily cloud support at 1252.93. If there is any pullback from the drop, resistances are: 1274.35 (hourly tenkan-sen), 1280.57 (hourly kijun-sen) and 1284.37 (hourly cloud resistance ).
From Elliott Wave, the horrendous BarChart data notwithstanding, I think Minuette B is already over at the high of 1289.71 reached on last Friday, and we are in a decent decline in Minuette C (and hence Minute Y and Minor 2) since.
Good luck, all.
Dreamer, what’s going on here? How can I face Monday AM without a GDX chart?
Hey Davey,
As you can see from my Gold chart below, I see the bottom coming very soon, probably on Monday or Tuesday.
For GDX, I think we are on the last little 5 wave down toward a target somewhere between 22.80 and 22.22.
Don’t worry about the invalidation point that this chart shows at 22.53 as I have another count that shows this move down as a 2nd wave with an invalidation point of 20.99. Good luck.
https://www.tradingview.com/x/chuVJfPi/
When the reddish channel is broken to the upside, the bottom is likely in.
Thanks Dreamer.
Lara,
Using Tradingview data, I’m looking at the possibility for a brief DZZ up for Minuette b. Minuette b was very brief with Minute w, so maybe that repeats. Alternately, it could morph into an expanded flat since a new low has already been made.
Either way, for your first EW count, the bottom of Minor 2 is getting close. Likely within the 6 days you state, but could be sooner if Minuette b is already complete.
The downtrend line from the July 2016 high comes in around 1,270 which should also offer support.
https://www.tradingview.com/x/DdBhEu0v/
Thank you very much for posting Dreamer.
We could have a small target zone here about 1,270 to 1,268 which would see minor 2 fall a little short of the 0.618 Fibonacci ratio.
Checked BarChart data again this morning. Still the same 🙁