
Again, upwards movement continued exactly as expected.
A combination of candlestick analysis, volume analysis, RSI, and ADX will be used to identify when the trend is over or a consolidation within it may begin.
Summary: The trend remains upwards, but now expect a consolidation for minor wave 4 to probably last all of next week. It may take price down to about 1,335 and should be very choppy and overlapping.
Corrections are an opportunity to join the trend. Stops should always be used; set now just below 1,325.67. Manage risk by investing only 1-5% of equity on any one trade.
New updates to this analysis are in bold.
Last monthly charts for the main wave count are here, another monthly alternate is here, and video is here.
Grand SuperCycle analysis is here.
MAIN ELLIOTT WAVE COUNT
WEEKLY CHART
Click chart to enlarge.
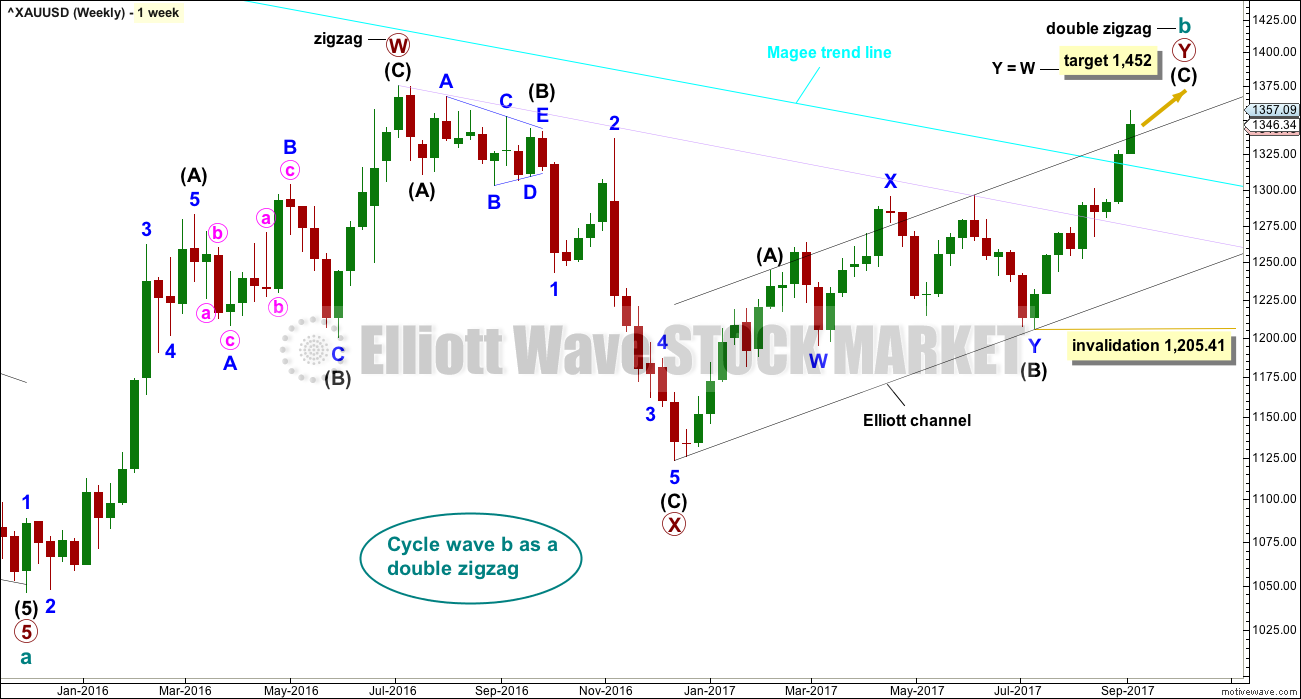
There is strong support from classic technical analysis for this wave count. Now that price has fully broken above the Magee trend line and has broken out above a consolidation zone, with support from volume, this wave count will now be the main wave count.
There are more than 23 possible corrective structures that B waves may take, and although cycle wave b still fits best at this stage as a triangle, it may still be another structure. This wave count looks at the possibility that it may be a double zigzag.
If cycle wave b is a double zigzag, then current upwards movement may be part of the second zigzag in the double, labelled primary wave Y.
The target remains the same.
Within intermediate wave (C), no second wave correction may move beyond the start of its first wave below 1,205.41.
There are two problems with this wave count which reduce its probability in terms of Elliott wave:
1. Cycle wave b is a double zigzag, but primary wave X within the double is deep and time consuming. While this is possible, it is much more common for X waves within double zigzags to be brief and shallow.
2. Intermediate wave (B) within the zigzag of primary wave Y is a double flat correction. These are extremely rare, even rarer than running flats. The rarity of this structure must further reduce the probability of this wave count.
Although this wave count still has these problems, technical analysis now points to it being more likely. The alternate will continue to be considered until price invalidates it.
DAILY CHART
Click chart to enlarge.
The analysis today will focus on the structure of intermediate wave (C). To see details of all the bull movement for this year see last analysis daily charts here.
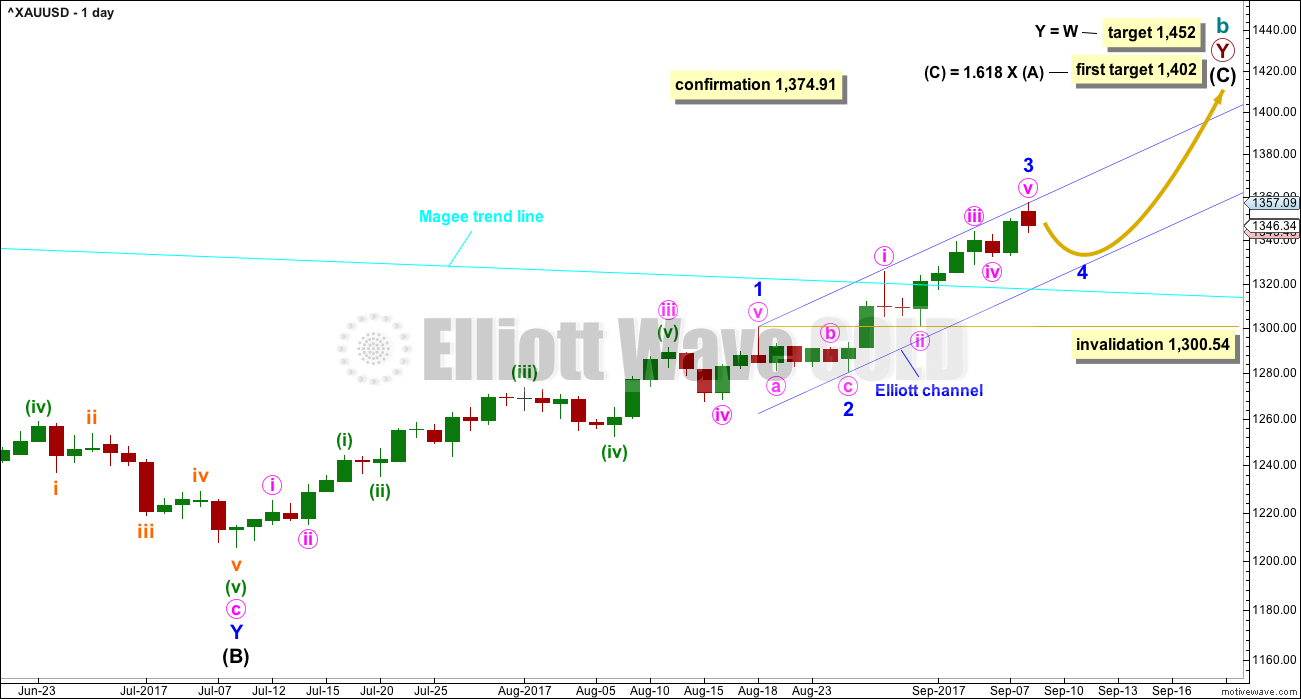
Intermediate wave (C) may be unfolding as an impulse.
Within the impulse, minor waves 1 and 2 would now be complete.
Minor wave 2 may have ended as a relatively brief shallow second wave. It is unusual for second wave corrections to be this shallow. If my analysis of intermediate wave (C) is wrong, it may be in labelling minor waves 1 and 2 already over. It is possible that only minor wave 1 was over at today’s high. If price moves below 1,300.54 at this stage, then I would expect a deeper more time consuming correction which would be labeled minor wave 2.
Minor wave 3 may only subdivide as an impulse. So far the corrections of minute waves ii and iv show up evenly on the daily chart giving this portion of the wave count the right look. Now with a red daily candlestick for Friday’s session, it looks like minor wave 3 could be over.
With minor wave 1 a very long extension, minor wave 3 may not be extended. If this labelling is correct, then there is no Fibonacci ratio between minor waves 1 and 3, and minor wave 3 is shorter than minor wave 1 by 18.80. This limits minor wave 5 to no longer than equality with minor wave 3 at 76.33, so that minor wave 3 is not the shortest and the core Elliott wave rule is met.
Minor wave 2 was a shallow 0.21 zigzag lasting five days. Given the guideline of alternation, minor wave 4 may be most likely a flat, triangle or combination. It may most likely last a Fibonacci five or eight days. Within all of flats, triangles and combinations, a new high above 1,357.09 may be included.
Minor wave 4 may not move into minor wave 1 price territory below 1,300.54.
HOURLY CHART
Click chart to enlarge.
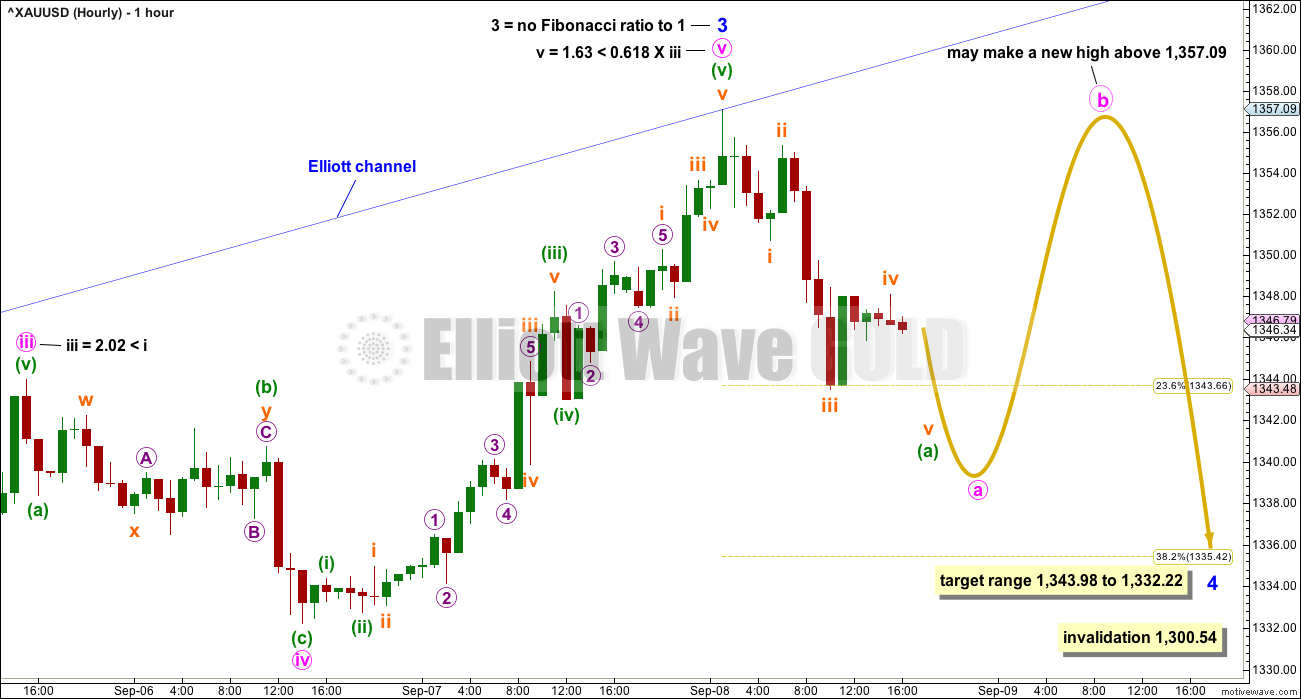
If minor wave 4 unfolds as either a flat, combination or triangle, then within it minute wave a would most likely be a three wave structure. When A waves subdivide as threes, they are almost always zigzags and occasionally flat corrections. A waves may not subdivide as triangles.
When minute wave a is a complete three wave structure, then minute wave b upwards must also be a three and is very likely to be very deep.
If minor wave 4 is the most common flat correction, then within it minute wave b must retrace a minimum 0.9 length of minute wave a. Minute wave b of an expanded flat (the most common type and a very common structure) must be a minimum 1.05 length of minute wave a, so it must move above the start of minute wave a at 1,357.09.
If minor wave 4 is the next very common structure of a combination, then it would be labelled minute waves w, x and z. Doubles are common and triples are very rare, so triples will not be considered unless price proves it correct. Double combinations are most commonly a zigzag and a flat correction joined by a three for minute wave x in the opposite direction. Minute wave x may make a new high above 1,357.09.
If minor wave 4 is a triangle, then within it minute wave b may make a new high above 1,357.09 if the triangle is a running variety.
Minor wave 4 would be fairly likely to end somewhere within the price territory of the fourth wave of one lesser degree. Minute wave iv has its range from 1,343.98 to 1,332.22. Within this range lies the 0.382 Fibonacci ratio of minor wave 3 at 1,335, so this is a reasonable target for minor wave 4 to end.
This wave count over the next week expects choppy overlapping sideways movement for a small consolidation within the upwards trend.
The labelling within minor wave 4 will change as more structure unfolds. At this stage, it is impossible for me to tell you with any confidence which of the multiple options outlined above minor wave 4 will be.
ALTERNATE ELLIOTT WAVE COUNT
WEEKLY CHART
Click chart to enlarge.
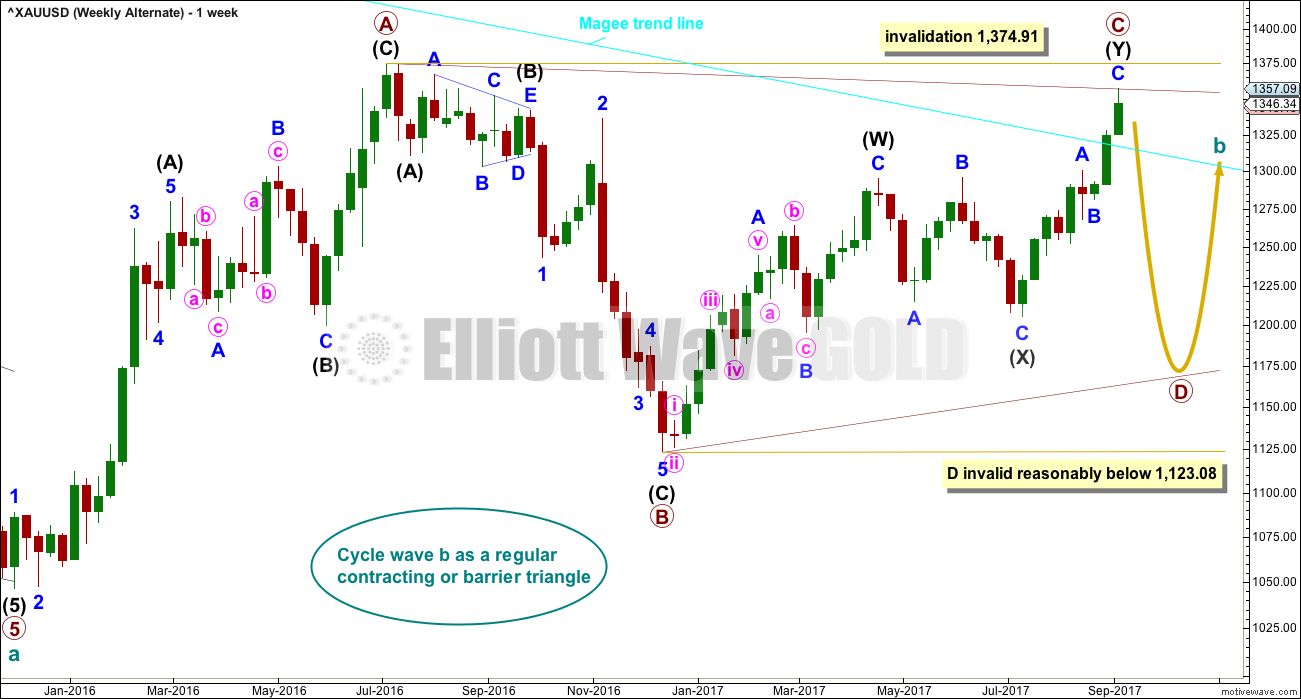
The Magee trend line is now breached by a full weekly candlestick above and not touching the line. This substantially reduces the probability of this wave count at the end of this week.
The Magee bear market trend line is drawn from the all time high for Gold on the 6th of September, 2011, to the first major swing high within the following bear market on the 5th of October, 2012.
To use this trend line in the way Magee describes, we should assume that price will find resistance at the line if it gets back up there. Now that the line is breached, it is signalling a major trend change from bear to bull.
Within a triangle, one sub-wave should be a more complicated multiple, which may be primary wave C. This is the most common sub-wave of the triangle to subdivide into a multiple.
Intermediate wave (Y) now looks like a developing zigzag at the weekly chart level, and minor wave B within it shows up with one red weekly candlestick.
Primary wave D of a contracting triangle may not move beyond the end of primary wave B below 1,123.08. Contracting triangles are the most common variety.
Primary wave D of a barrier triangle should end about the same level as primary wave B at 1,123.08, so that the B-D trend line remains essentially flat. This involves some subjectivity; price may move slightly below 1,123.08 and the triangle wave count may remain valid. This is the only Elliott wave rule which is not black and white.
Finally, primary wave E of a contracting or barrier triangle may not move beyond the end of primary wave C above 1,295.65. Primary wave E would most likely fall short of the A-C trend line. But if it does not end there, then it can slightly overshoot that trend line.
Primary wave A lasted 31 weeks, primary wave B lasted 23 weeks, and primary wave C started its 38th week. A double zigzag may be expected to be longer lasting than single zigzags within a triangle, and so this continuation of primary wave C is entirely acceptable and leaves the wave count with the right look at this time frame.
With upwards movement continuing, the A-C trend line now has too weak a slope. At this stage, this wave count now looks less likely.
DAILY CHART
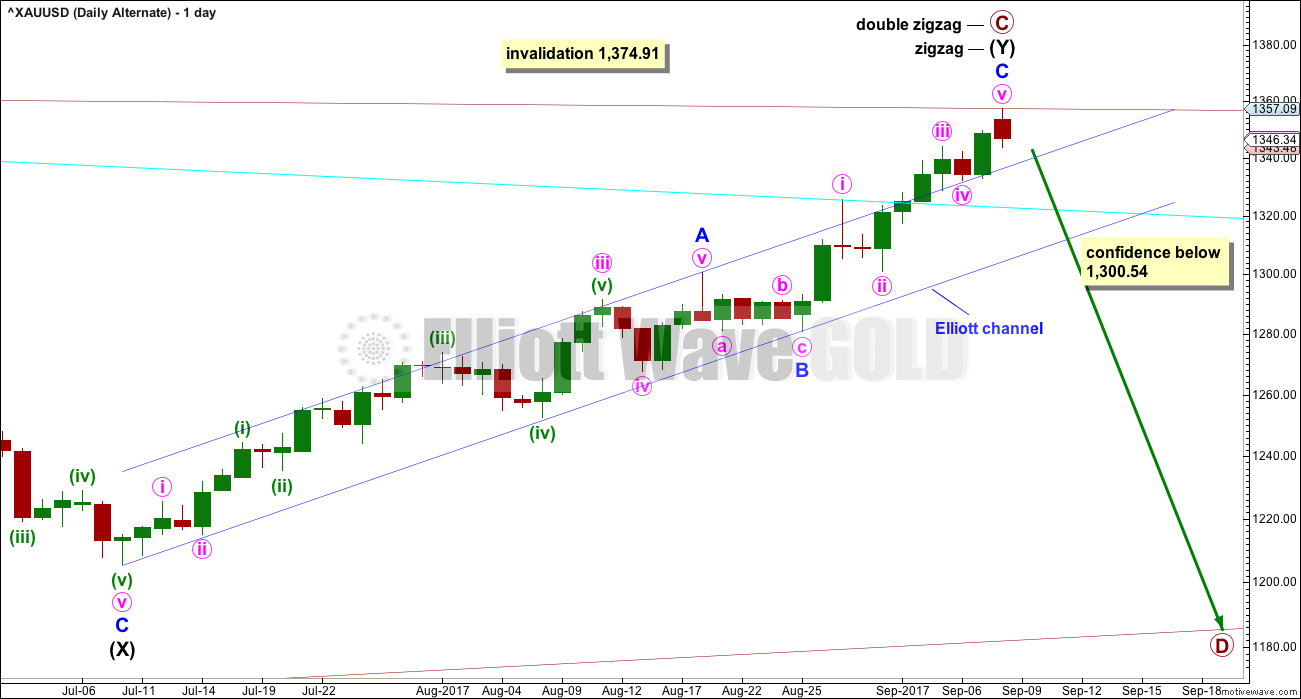
Click chart to enlarge.
The cyan Magee trend line has now been breached. This must reduce the probability of this wave count.
A breach of the blue Elliott channel by downwards movement would indicate a trend change.
The structure of minor wave C may now be complete. It may also continue a little higher.
TECHNICAL ANALYSIS
WEEKLY CHART
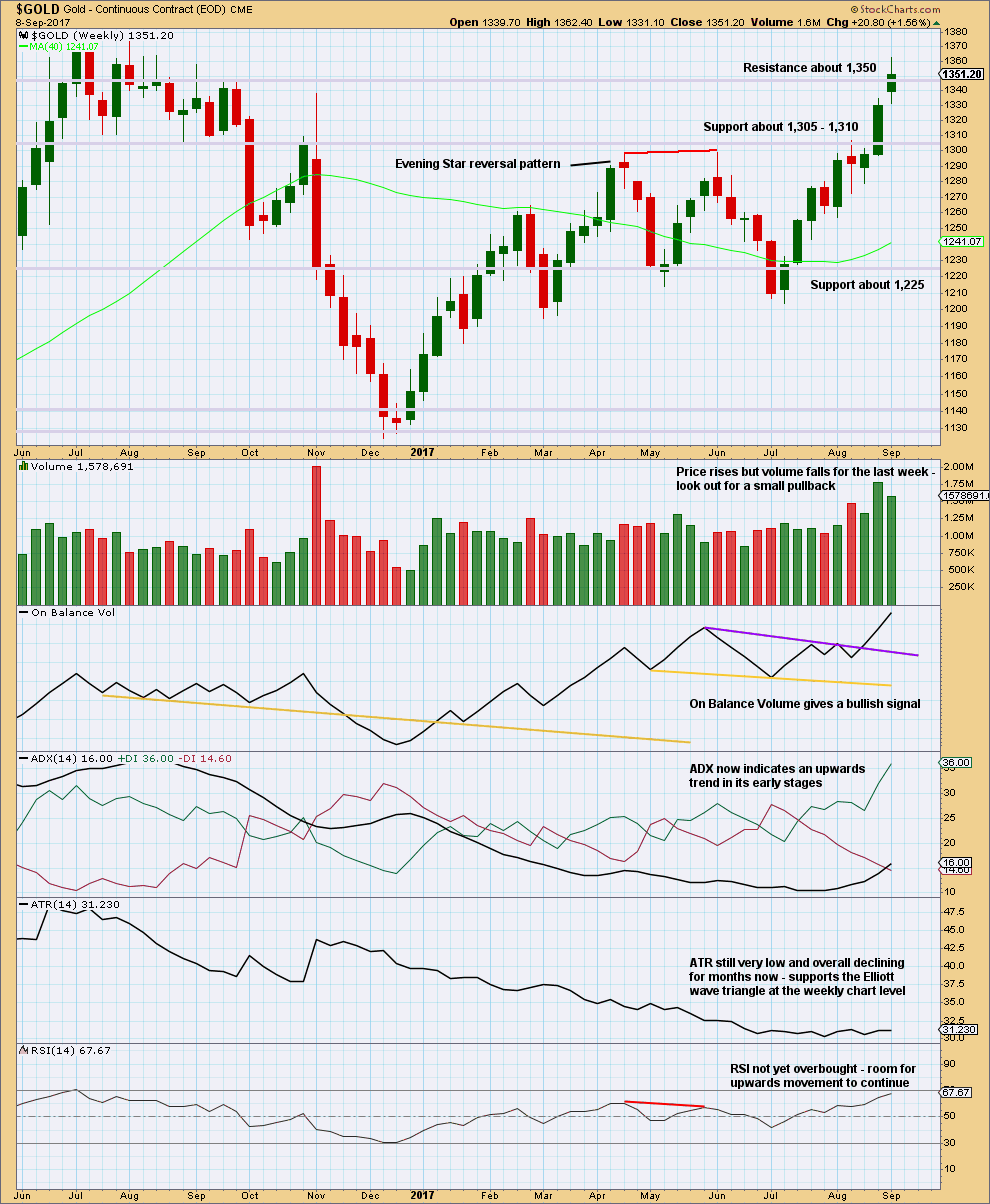
Click chart to enlarge. Chart courtesy of StockCharts.com.
Overall, this chart is bullish. This trend may be expected to continue at least until weekly RSI reaches overbought.
DAILY CHART
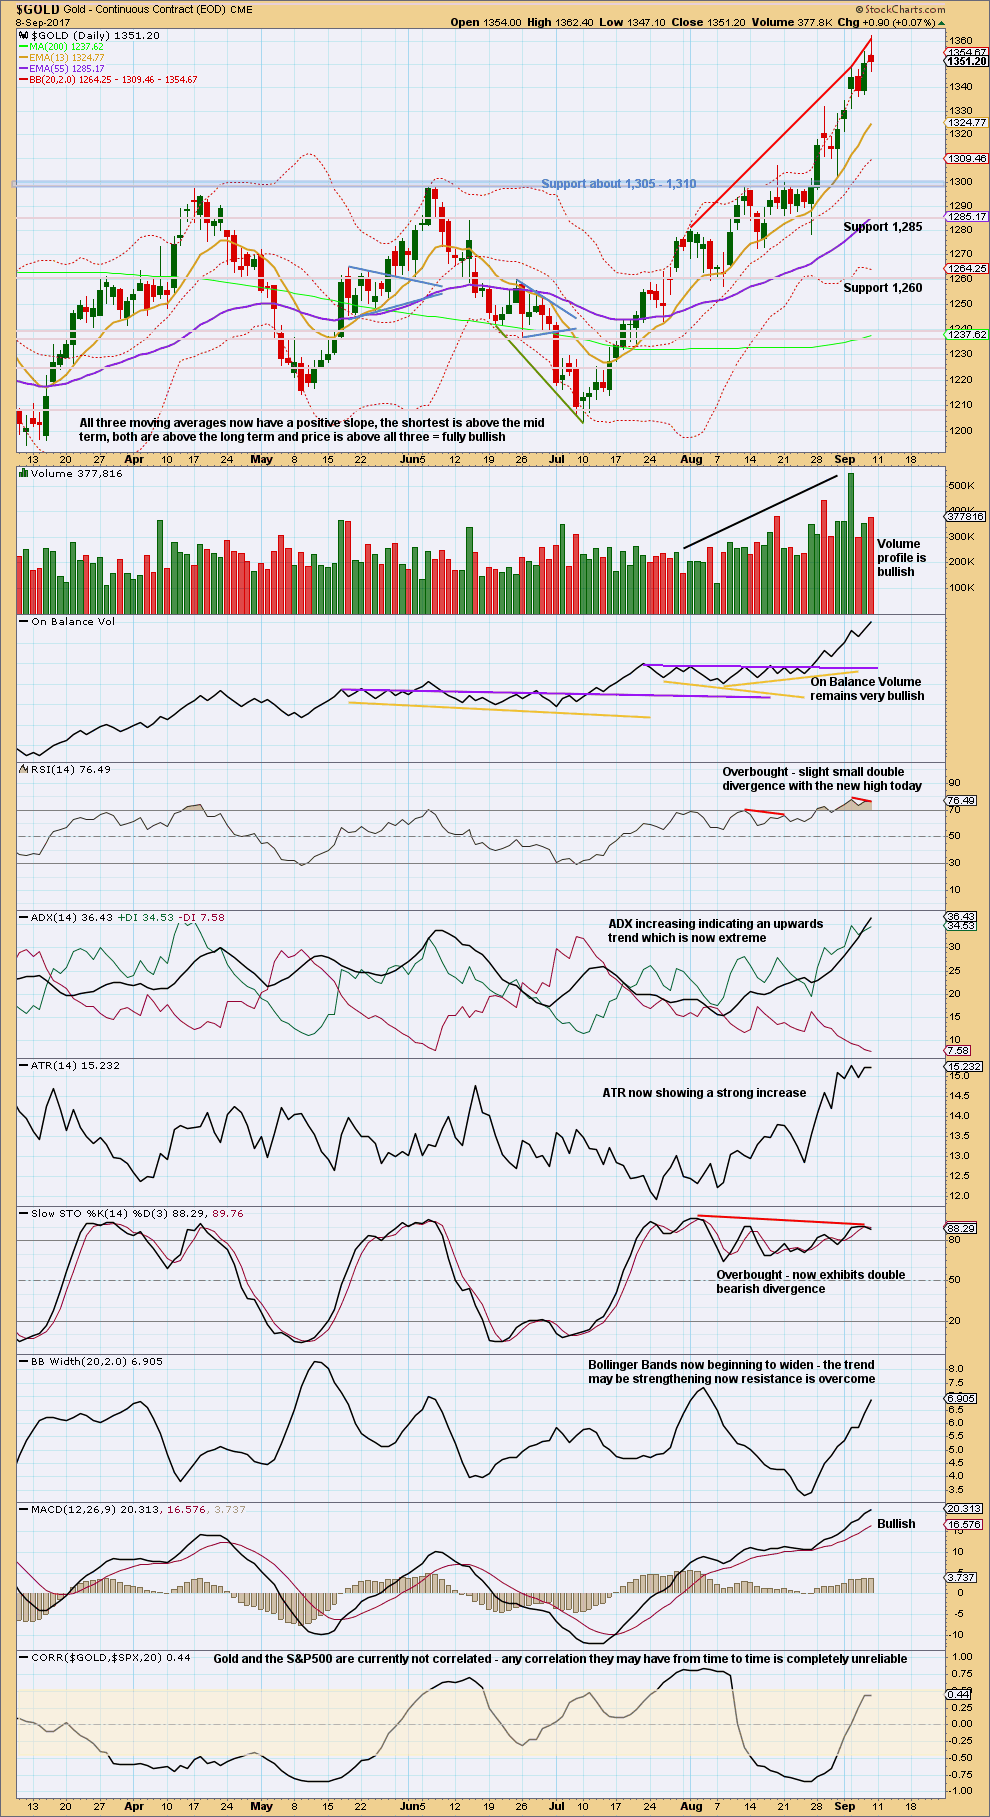
Click chart to enlarge. Chart courtesy of StockCharts.com.
The long upper wick and red close on Friday’s candlestick is slightly bearish.
Expect a pullback or consolidation as quite likely here. ADX is now above 35 and the black ADX line is above both directional lines. RSI and Stochastics are extreme and both exhibit double divergence with price, although it is weak.
These extreme readings are not enough to expect an end to the trend, only a pause within it.
GDX
DAILY CHART
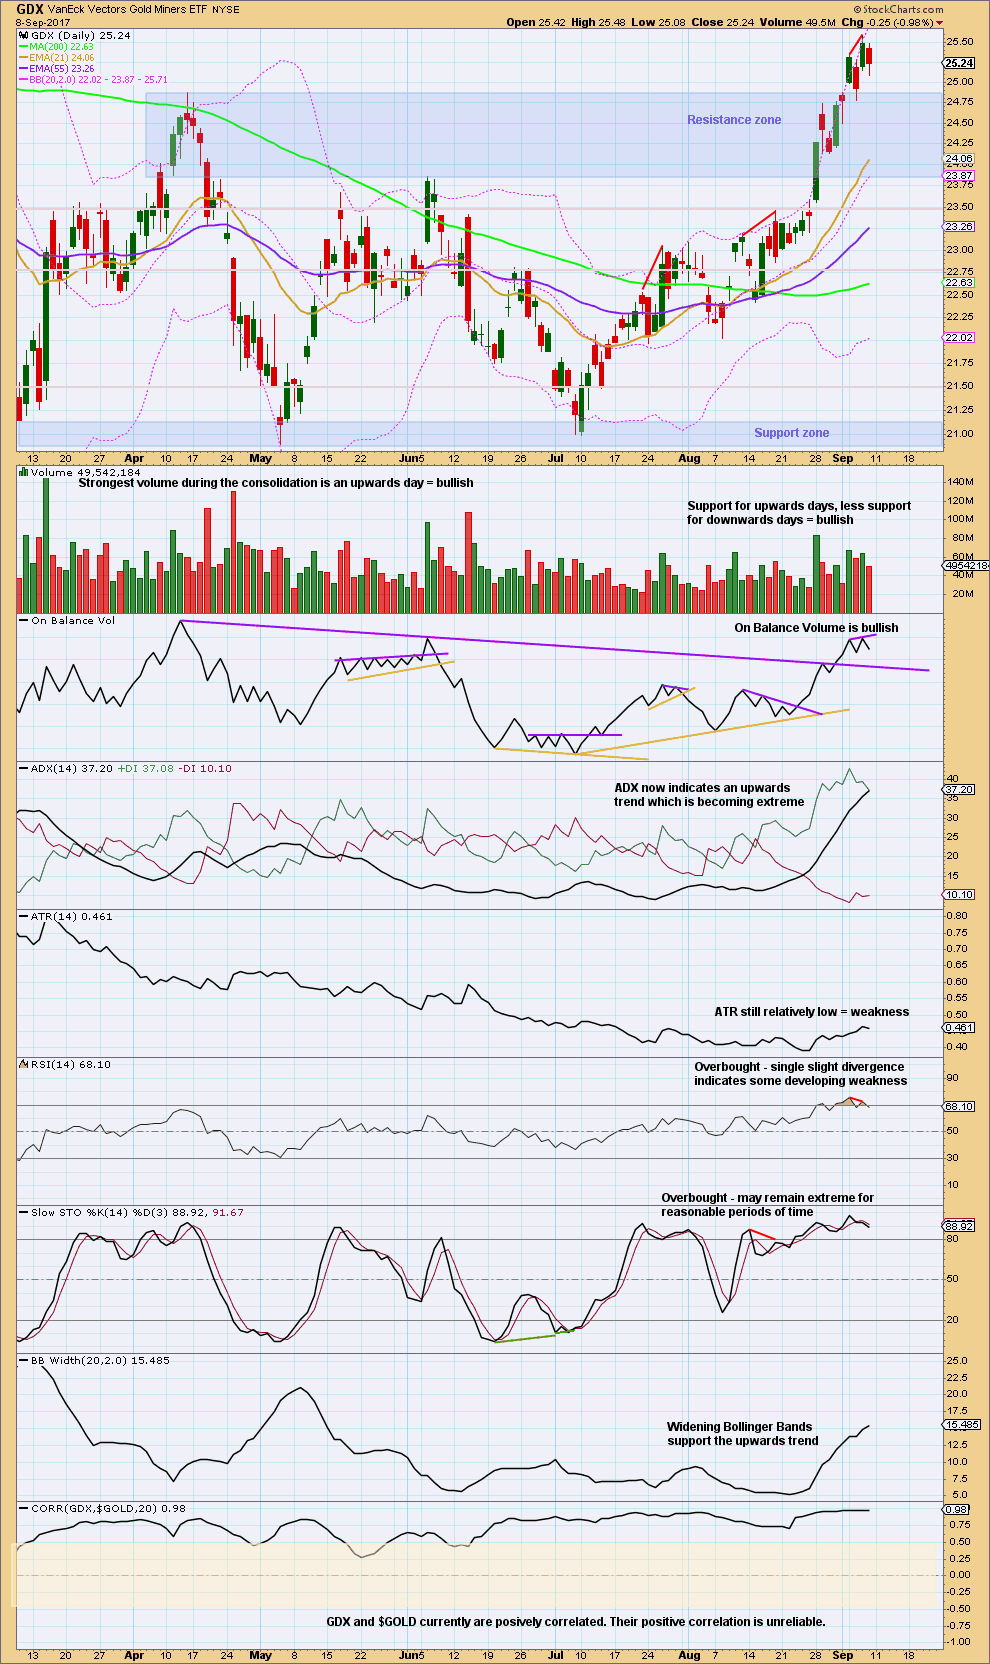
Click chart to enlarge. Chart courtesy of StockCharts.com.
Volume remains bullish. Expect any downwards days here for GDX to be pullbacks or consolidations within the trend, not yet an end to the trend.
GOLD THIRD WAVE EXAMPLE – DAILY CHART
Click chart to enlarge. Chart courtesy of StockCharts.com.
This section will be left at the end of analysis until either the current wave count is proven wrong, or the third wave we are expecting has completed.
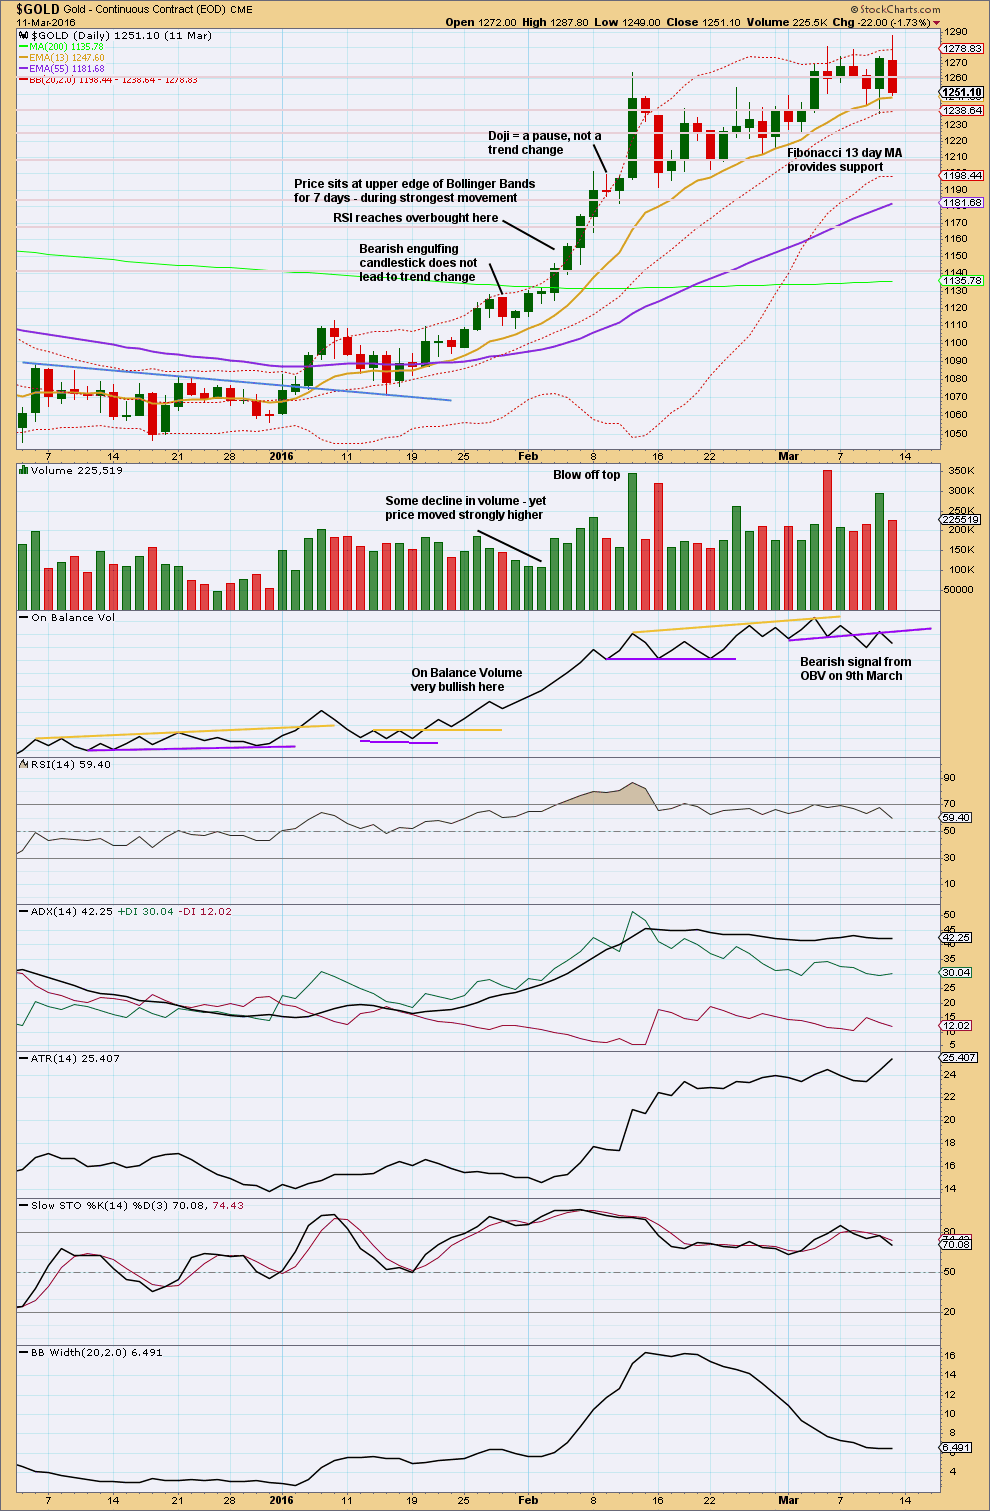
This chart has been published before. It shows the most recent example of a strong third wave in Gold from December 2015 to March 2016.
Note that during this strong upwards trend:
– RSI first reached overbought on the 4th of February and price then continued strongly higher for five more days culminating in a blowoff top on the 11th of February.
– RSI and Stochastics remained extreme for most of the second half of the trend. At the final high, they both exhibited strong divergence with price.
– Price found support at the short term Fibonacci 13 day moving average during the entire trend.
– All signals from On Balance Volume were bullish right up to the end of the trend. The 9th of March shows the first bearish signal, which was an important warning of a trend change.
– The trend begins with choppy overlapping and some hesitancy.
– The 6th of January was an important upwards breakout from resistance, with support from volume. Thereafter, price moved more strongly.
– While overall volume supported the upwards movement in price, this was not linear. Some weaker days occurred yet price continued higher. It is the overall trend of volume which is more important than any one or two days. On Balance Volume remaining bullish was an important guide.
No two waves are the same. So if the current wave count is correct, it may be different from this example. However, there are some important lessons to be learned here:
1. On Balance Volume is an important guide. Bullish signals should be taken seriously, particularly early on in the trend. Later in the trend, with RSI and Stochastics overbought, any bearish signal from On Balance Volume should see long positions closed.
2. RSI and Stochastics can reach extreme overbought. Only when they have been extreme for some time and then exhibit strong divergence should it be taken as a warning of a trend change.
Published @ 12:10 a.m. EST on 10th September, 2017.
A strong decline in volume today does not support falling price. Price is falling of its own weight. This supports the Elliott wave count which sees this as a pullback, not a trend change.
Updated hourly chart:
I’m going to tentatively label minor 4 as a possible unfolding zigzag today. However, this labelling may very well change as the structure continues.
At the daily chart level it looks like minor 4 may not end at the Elliott channel, it may move a bit lower overshooting that channel to find support at the cyan line. It may do so as a zigzag, or it may still turn out to be a flat, combination or triangle.
It’s still impossible for me to tell you with any level of confidence what structure is unfolding here. Only that it looks incomplete.
Minor 4 is deeper than originally expected. That’s just fine. At the daily chart level this now looks like a typical curve back down to test support at prior resistance at the cyan Magee trend line.
This is typical price behaviour. When it does that it offers a good entry to join an established trend.
Minor 4 may bring indicators down from extreme allowing more upwards movement.
So far this looks like a typical pullback within an upwards trend.
If price breaks back down below the cyan trend line that view may have to change, but first expect support there as very likely.
Thank you to all EWG members for their participation; for those who share charts, and comments, and also for those who only read and “lurk”.
I would like to extend my heartfelt best wishes for those members in the pathway of recent tropical cyclones in the Caribbean, USA, and also the flooding in Bangladesh, Pakistan and Nepal. May you all be safe and well.
Charting some possible ideas for the hourly gold count. The correction could be over as a brief Double ZigZag or it could continue as a Flat or Triangle as Lara suggests.
The Elliott wave labels on this chart are based on the possible idea that the recent top was only Minute 1 of Minor 3.
Whatever happens, expect a gap fill up to at least 1,346 today.
https://www.tradingview.com/x/q2Rzusvy/
Or… the move down to the low (which happened after your chart, a slight new low) could be seen as the end of a zigzag
Instead of seeing w-x-y, try 1-2-3-4-5 to your low.
However.. yes. A totally viable wave count, and could still fit for wave A.
Gold price will likely now remain capped under 1339 for next downside 1323 before making traction for the upside? I wonder.
If youndraw a trendline from top of minor 1 to minor 3 and draw parallel trendline from ninor 2 I get about 1330.
If you draw a trendline from top of minor 1 to minor 3 and draw parallel trendline from minor 2, I get about 1330.
Thank you Daniel. Am really looking for Gold price to show some elasticity all the way down to 1316-1312 before making a run for 1368 (wish list? One never knows). On the other hand if current levels hold (1332), then Gold price price could be up & running very quickly! Happy trading to all.
End of Week Analysis
Data as at the market close of September 8
====================================
It’s been quite a while since I last posted in this forum. Apart from being busy at other matters my plan for gold had worked very well, reaching my first target of 1350, and for a bonus, slightly beyond. There was not much I had to offer; it was just plain sailing most of the time, just happily banking the profits. Now, we are at a crossroads. I expect prices to fall back at least a little to ease the upward pressure for a next rally.
At this point in time, I tend to agree with Dreamer that we have not yet passed the third of a third in Minor 3. From a charting point of view, Ichimoku still shows a very healthy picture. Price is way above the tenkan-sen which in turn lies a distance above the kijun-sen. The kumo is about to turn green, and strongly so at least until mid-October. This is textbook Ichimoku for a strong bullish trend. Using moving averages, the 50-day is about $75 below the closing price on Friday, with the 200-day a distance below. MACD (not shown) remains in a healthy accelerating uptrend. The 5-day RSI (not shown) is overbought, which signifies a pullback is in order.
So, how far will this pullback be? The first possibility will be a test of the red trend line, around 1320 -1330, at most the tenkan-sen currently at 1329.70. If this fails to hold, then the longer-term orange trend line would be tested next. This would be pretty close to the kijun-sen currently at 1309.75. If the trend lines hold and we are continuing, after the pullback, in Minute 3 of Minor 3, then the strongest move yet should unfold. But, if the orange trend line fails to contain the pullback, then I believe Lara’s Minor 4 in progress becomes more likely.
Fundamentally, the dollar being in the doldrums, together with Harvey and the impending Irma would mean no rate hike this year, encouraging a slide in stock prices, with the benefits moving towards gold. The volatile North Korean situation remains a constant reminder of the fragile geopolitical situation. Another missile or some other provocative initiative on the part of Kim would undoubtedly send gold off in another wild rally up. My personal opinion is that the US is in no position to launch an offensive, but with the capricious Trump, who knows?
Thanks Alan. Good to see a strong Ichimoku!
Alan, welcome back and thank you again so very much for sharing.
hello dreamer sir say ckearly we cant understand
Viky. What is meant is that the current count indicates that Minor 3 is shorter than Minor 1. As the third wave cannot be the shortest of the three impulse waves, it means that Minor 5 cannot be longer than Minor 3, giving a final target of around 1400. So, unless Primary Y is in 5 waves instead of three, then 1400 means the end of the uptrend, and a very big drop in Cycle C will then follow. This scenario runs counter to the current bullish sentiment of many traders.
Makes sense?
Good explanation. Thanks Alan.
Lara, as you know, your current count will limit the length of Minor wave 5. What about a count like this with the current top just the end of Minute wave 1 within Minor wave 3? This would allow for much higher targets as suggested in my charts below.
Limiting the length of Minor 5 seems contrary to the idea of a parabolic blow off top, no?
Worth considering?
https://www.tradingview.com/x/qv1eR489/
Most certainly that is worth considering.
My labelling ATM has minor 3 as over mostly because of the blowoff top we saw this week. It is so typical of the end of a third wave within a third wave to do that.
But certainly moving the degree of labelling within minor 3 all down one degree, only minute i within it over, is a very good alternate.
Thanks Dreamer
This was the point I was trying to make on my aug 7 post but your version is much clearer.
I’m expecting somewhere in the range of 1480
Lara thanks for the consideration
🙂 You’re welcome both. A chart is always so much clearer, especially for those of us like myself who are very visual.
This chart shows the very thinly traded, low volume zone in better detail. Should act as a “magnet” for price to return to.
Lara, what do you make of this channel that started in the early 2000’s and appears to have become relevant again in the last couple of years?
I think there’s a good chance that the top of the channel gets tested again. This could come in around 1,550 or so which is quite a bit higher than your current target. This also corresponds with the top of a very thinly traded, low volume zone which may also act as a target.
Thoughts?
https://www.tradingview.com/x/RoaxwVIa/
I’m having great difficulty replicating that channel.
Can you please tell me the months it’s drawn on? On a semi-log scale?
Lara,
Yes, semi-log scale. I know TradingView data varies some from BarChart, but I would think you could replicate with some accuracy. I added dates in MM-YYYY format for the monthly channel touches that appear to be exact using TradingView.
Even if you can’t replicate the channel, I would love to hear your technical thoughts on the “Thin Trading Range with Very Low Volume” concept as a Target. Thanks,
https://www.tradingview.com/x/0Y4AtGN0/
Hi Dreamer, I’ve taken some time to look through Magee and take a look at the chart including volume. Thank you for the updated chart, I’m able to replicate the trend channel.
There’s nothing specific about low volume and thin trading range I can find in Magee nor do I recall from any other text.
What I do recall is to look at volume trends as price bottoms and curves up. If volume is higher on the RHS than the LHS of a bottom curve, then have confidence it will break out upwards. That it is a bottoming pattern.
In the case of Gold, the whole of the bottoming pattern has very low volume. Volume does not begin to increase until after price has broken above resistance. And even then it takes years to be stronger than the first upwards month off the low.
I have noticed for Gold that the first movement in a new trend is often very strong. That is the case off this low. The first month of September 1999 had a wide range and very strong volume. Subsequent months did not make a new low and essentially moved price sideways.
Lara, thanks for taking the time to replicate the channel and do the research. I think the top of the channel will get another retest, which may or may not actually touch the channel. Time will tell…