
A new high above 49.42 has invalidated last week’s Elliott wave analysis.
Two new Elliott wave counts are considered this week.
Summary: Oil may continue to rise for the short to mid term. The target is now, at minimum, above 52.37. 53.20 is also possible.
Use the blue channel on the main daily Elliott wave chart. Expect upwards movement while price remains within it. If that channel is breached by downwards movement, then expect a deeper pullback.
New updates to this analysis are in bold.
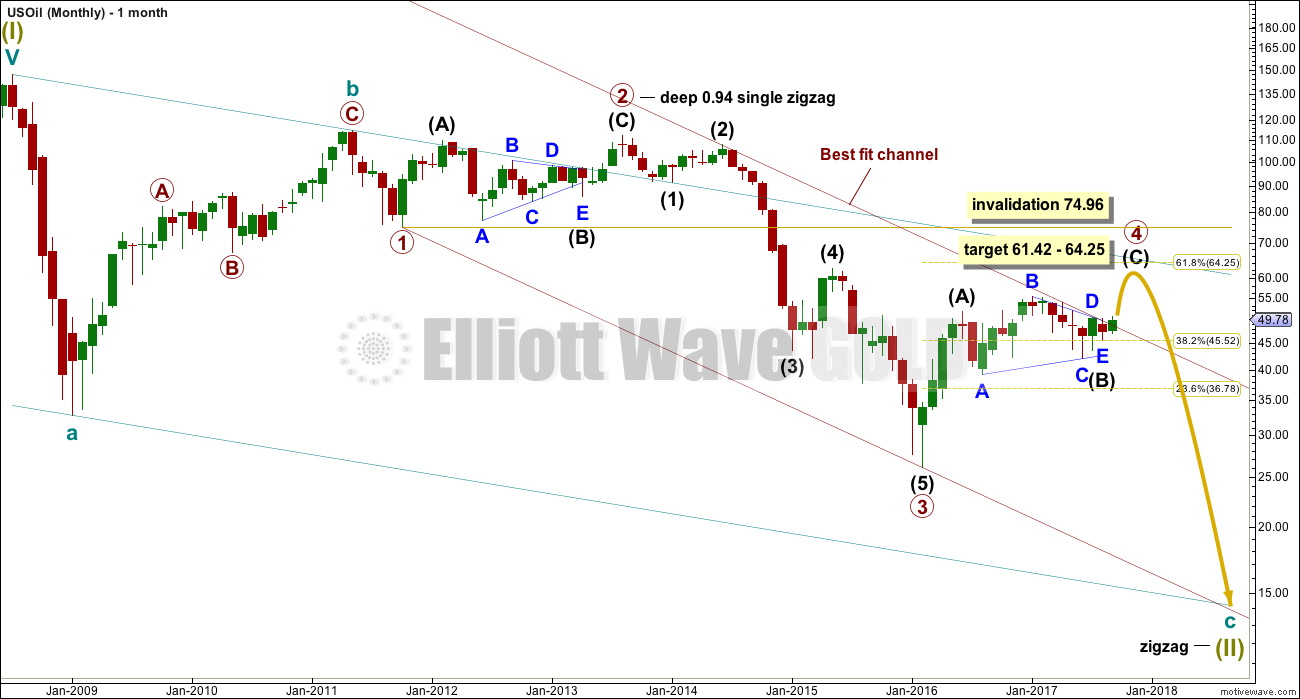
MONTHLY ELLIOTT WAVE COUNT
Click chart to enlarge.
Within the bear market, cycle wave b is seen as ending in May 2011. Thereafter, a five wave structure downwards for cycle wave c begins.
Primary wave 1 is a short impulse lasting five months. Primary wave 2 is a very deep 0.94 zigzag lasting 22 months. Primary wave 3 is a complete impulse with no Fibonacci ratio to primary wave 1. It lasted 30 months.
There is alternation in depth with primary wave 2 very deep and primary wave 4 relatively shallow. There is inadequate alternation in structure, both are zigzags.
Primary wave 4 may not move into primary wave 1 price territory above 74.96.
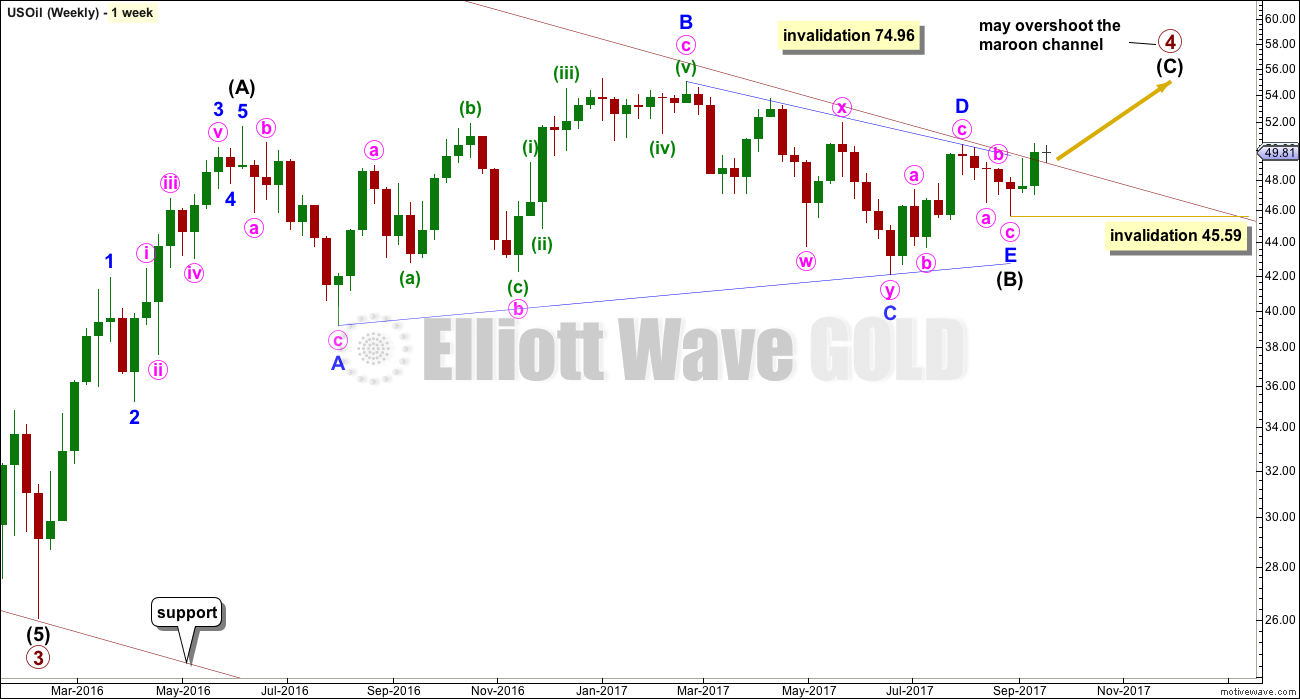
WEEKLY ELLIOTT WAVE COUNT
Click chart to enlarge.
This wave count now sees primary wave 4 incomplete as a relatively shallow zigzag.
Fourth waves are not always contained within channels. This one has now breached the channel. When it is complete, a channel may then be redrawn.
Intermediate wave (A) will subdivide as a five wave impulse. Intermediate wave (B) fits as a running contracting triangle. Intermediate wave (C) would be likely to move above the end of intermediate wave (A) at 51.67 to avoid a truncation.
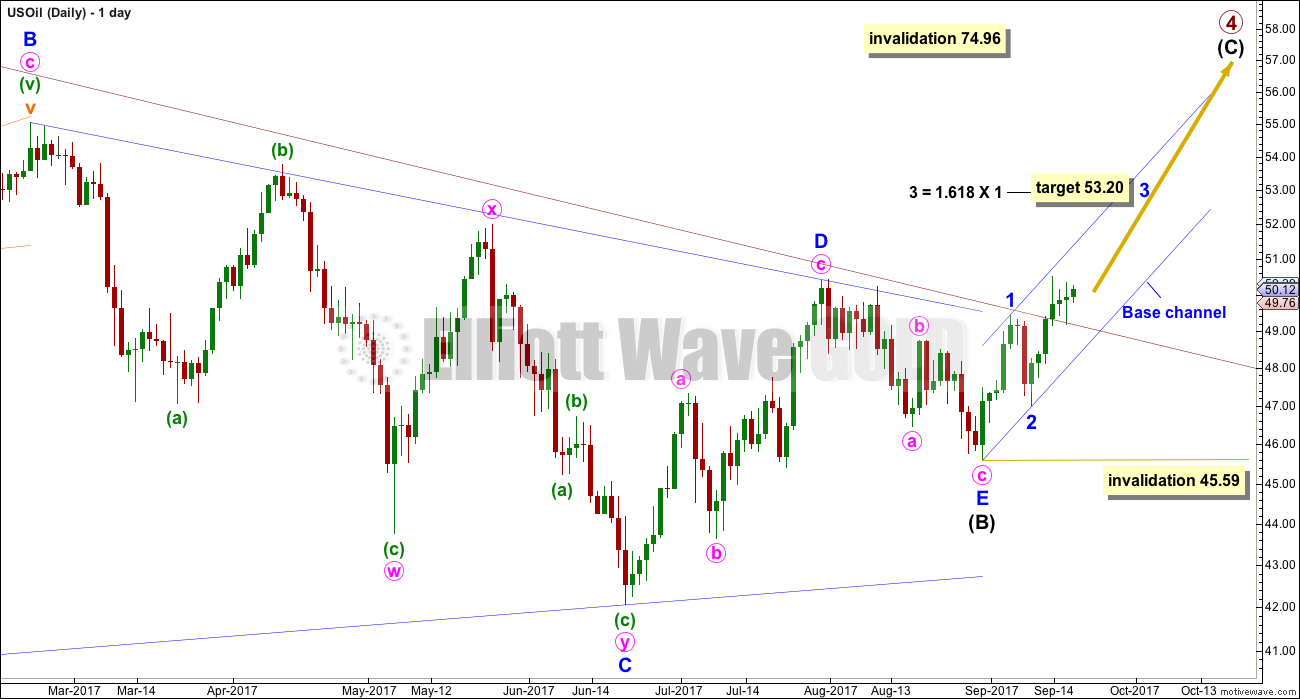
DAILY ELLIOTT WAVE COUNT
Click chart to enlarge.
The maroon trend line is now fully breached, and the low for yesterday was a throwback to find support at the line. If this line behaves as trend lines most often do (but not always), then price may now move up and away from it.
A short term target is given for minor wave 3.
If minor wave 2 continues lower as an expanded flat correction, then it may not move beyond the start of minor wave 1 below 45.59.
Minor wave 3 should exhibit an increase in upwards momentum and should have support from volume.
Any corrections along the way up should find support at the lower edge of the base channel. If price breaks below the lower edge of this channel at this stage, then minor wave 2 may be moving lower.
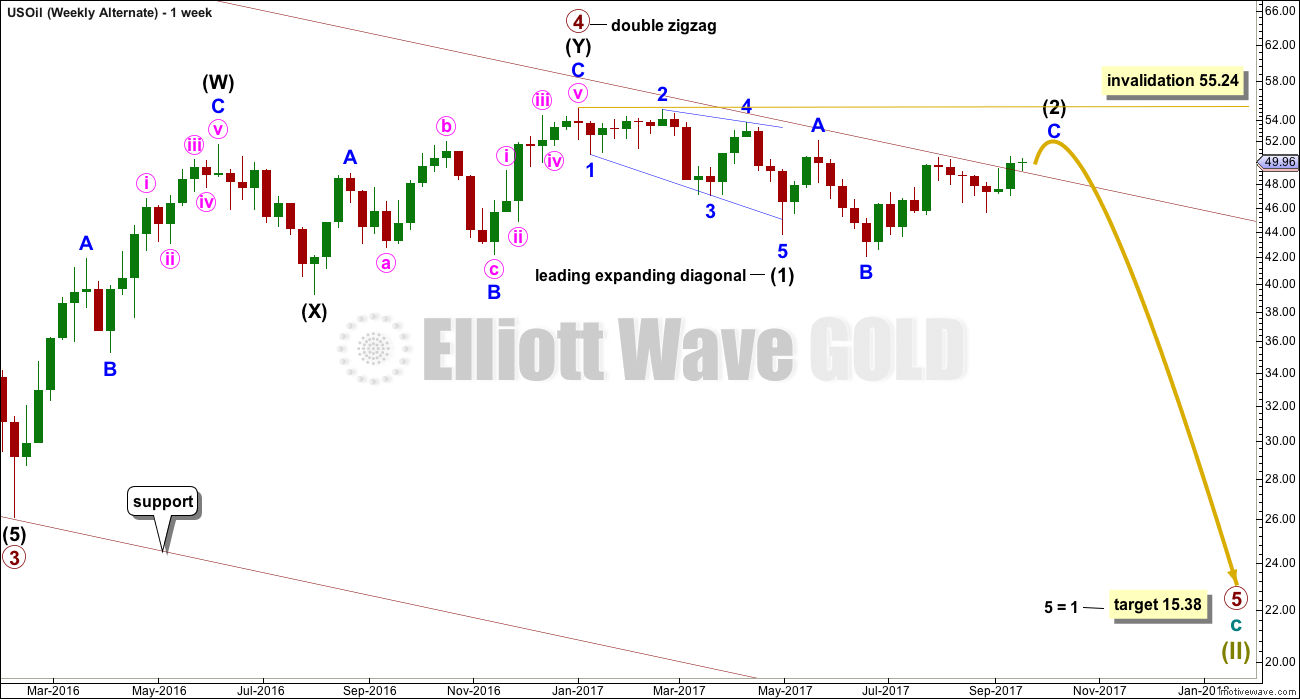
ALTERNATE WEEKLY ELLIOTT WAVE COUNT
Click chart to enlarge.
This alternate wave count again considers the possibility that primary wave 4 is over and primary wave 5 has begun.
Primary wave 5 may have begun with a leading expanding diagonal for intermediate wave (1). The current deep bounce may be a continuation of intermediate wave (2) as an expanded flat correction.
Intermediate wave (2) may not move beyond the start of intermediate wave (1) above 55.24.
Second wave corrections following first wave leading diagonals are commonly very deep indeed.
Only the breach of the maroon trend channel is judged to give this wave count a slightly lower probability in terms of Elliott wave than the main wave count. If primary wave 4 was over, then that trend channel should have provided resistance.
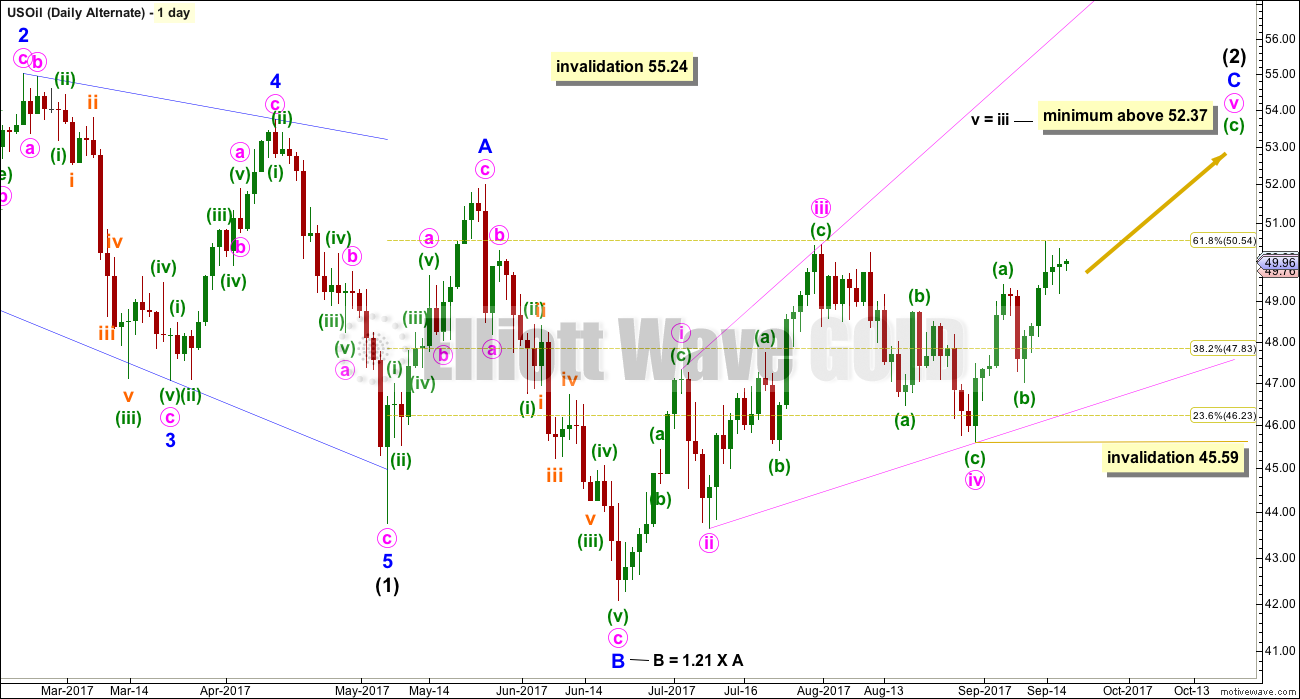
ALTERNATE DAILY ELLIOTT WAVE COUNT
Click chart to enlarge.
The leading diagonal for intermediate wave (1) ended with a strong overshoot of the 1-3 trend line. While this is very typical of contracting diagonals, it is less common for expanding diagonals.
Intermediate wave (2) fits so far as an expanded flat correction.
Minor wave C may be another expanding diagonal, this one ending. Within ending diagonals, all sub-waves must subdivide as zigzags and the fourth wave should overlap first wave price territory.
Minute wave v must be longer than minute wave iii within an expanding diagonal, so that the rule regarding wave lengths is met. Minute wave v must end above 52.37.
This would see minor wave C end above the end of minor wave A at 52.00 avoiding a truncation and a very rare running flat.
Within minute wave v, if minuette wave (b) continues further as an expanded flat correction, it may not move beyond the start of minuette wave (a) below 45.59. However, diagonals normally adhere well to their trend lines. If the lower pink i-iii trend line is breached, then this diagonal would look wrong. The probability would substantially reduce prior to invalidation.
TECHNICAL ANALYSIS
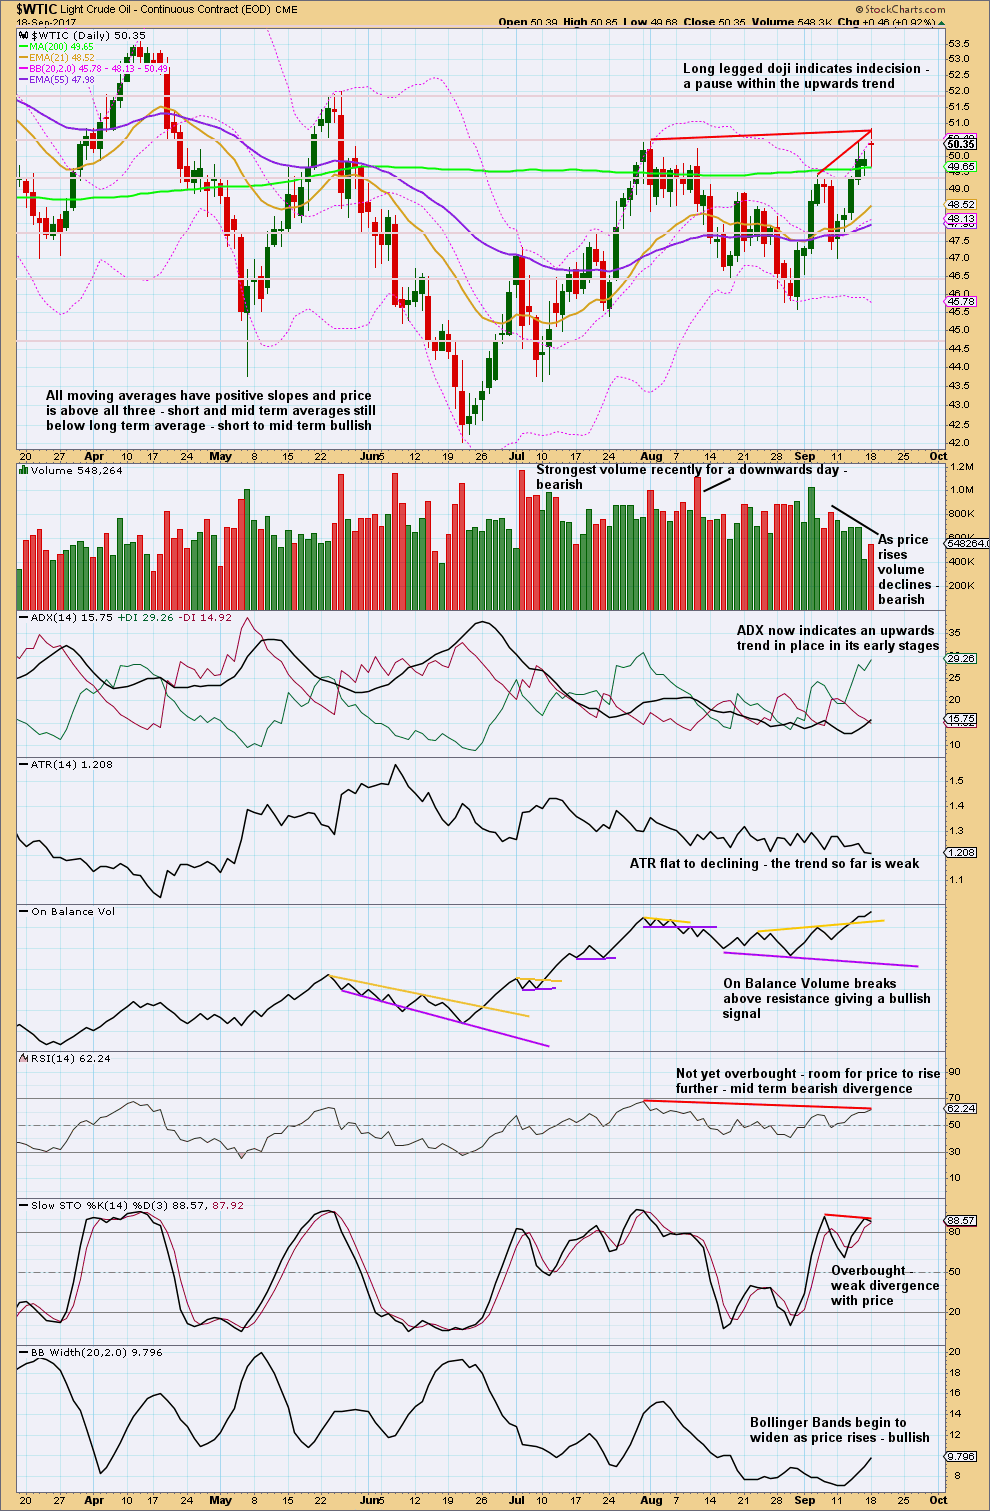
DAILY CHART
Click chart to enlarge. Chart courtesy of StockCharts.com.
While the Elliott wave counts both now expect some more upwards movement, this classic analysis does not offer good support to that view.
Stochastics is bearish. It is overbought and exhibits divergence with price. RSI is also bearish, but there divergence may just disappear.
On Balance Volume does offer good support to the Elliott wave counts though, and I would rather give this indicator more weight.
While volume overall is declining as price rises, Oil can behave like this during the early days if its trends. The last upwards day does show some increase in volume.
VOLATILITY INDEX
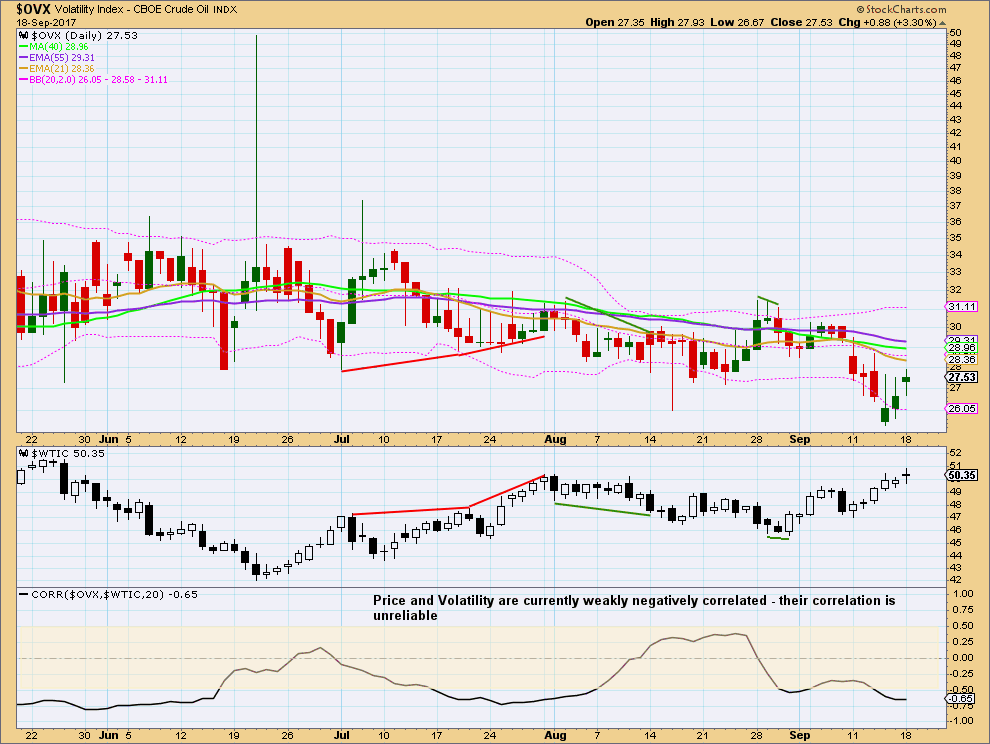
Click chart to enlarge. Chart courtesy of StockCharts.com.
Normally, volatility should decline as price rises and volatility should increase as price falls. Divergence from this normal can provide a bullish or bearish signal for Oil. However, it is noted that this signal occurs both in minor and major lows and it cannot be used to distinguish between them.
No new short term divergence is noted between price and volatility.
Published @ 04:04 a.m. EST.
Lara, Thanks as always for the cogent analysis.
Thanks William! This week worked out pretty well.