
Last week’s analysis expected Oil to continue to rise for the short to mid term.
Summary: Oil may continue to rise for the short to mid term. The target is now 53.20 for the short term.
Use the blue channel on the main daily Elliott wave chart. Expect upwards movement while price remains within or above it. If that channel is breached by downwards movement, then expect a deeper pullback.
New updates to this analysis are in bold.
MONTHLY ELLIOTT WAVE COUNT
Click chart to enlarge.
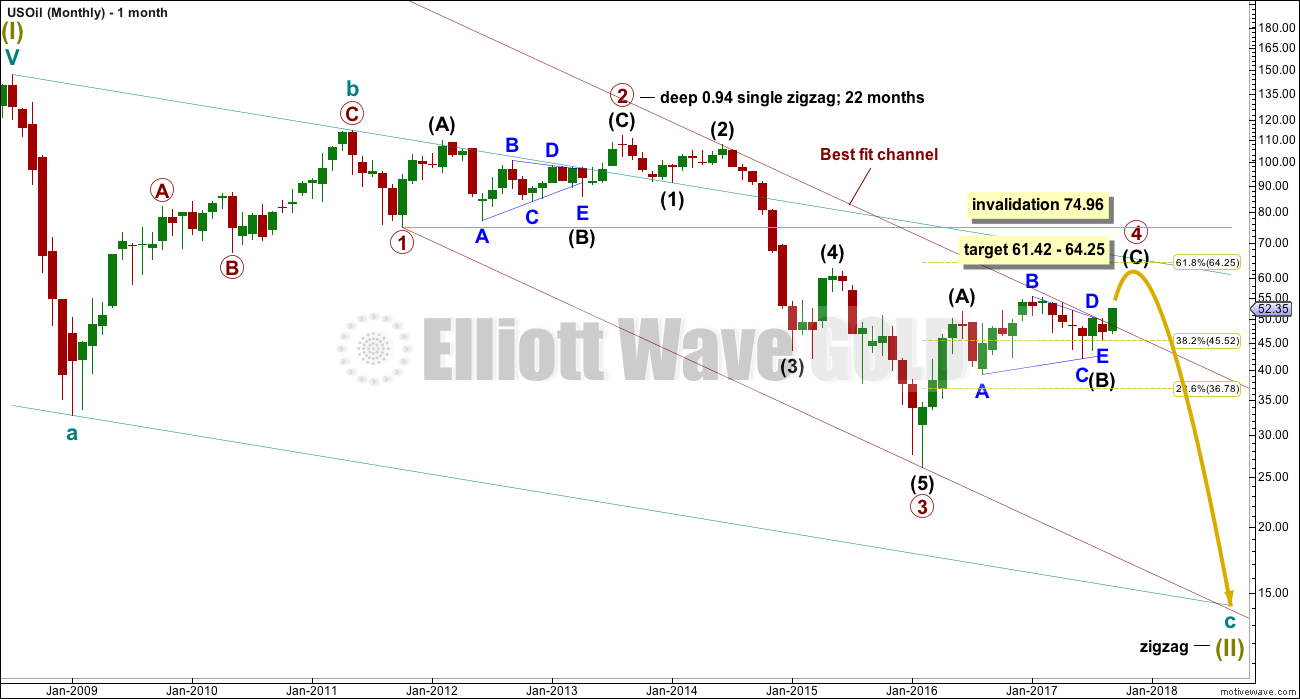
Within the bear market, cycle wave b is seen as ending in May 2011. Thereafter, a five wave structure downwards for cycle wave c begins.
Primary wave 1 is a short impulse lasting five months. Primary wave 2 is a very deep 0.94 zigzag lasting 22 months. Primary wave 3 is a complete impulse with no Fibonacci ratio to primary wave 1. It lasted 30 months.
There is alternation in depth with primary wave 2 very deep and primary wave 4 relatively shallow. There is inadequate alternation in structure, both are zigzags. So far primary wave 4 has lasted 19 months. So far there is good proportion between primary waves 2 and 4.
Primary wave 4 may not move into primary wave 1 price territory above 74.96.
WEEKLY ELLIOTT WAVE COUNT
Click chart to enlarge.
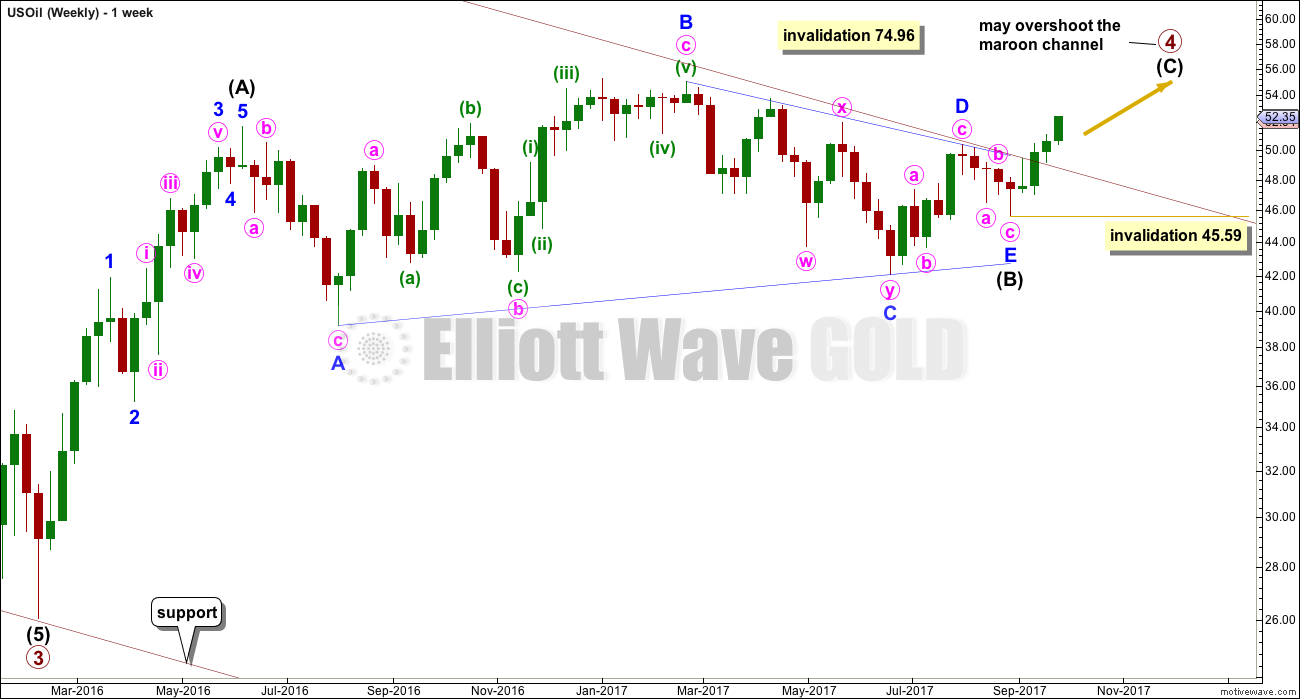
This wave count now sees primary wave 4 incomplete as a relatively shallow zigzag.
Fourth waves are not always contained within channels. This one has now breached the channel. When it is complete, a channel may then be redrawn.
Intermediate wave (A) will subdivide as a five wave impulse. Intermediate wave (B) fits as a running contracting triangle. Intermediate wave (C) has now moved above the end of intermediate wave (A) at 51.67 avoiding a truncation. As soon as the structure of intermediate wave (C) could be complete, then an end to primary wave 4 may be considered. This can be seen at the daily chart level.
DAILY ELLIOTT WAVE COUNT
Click chart to enlarge.
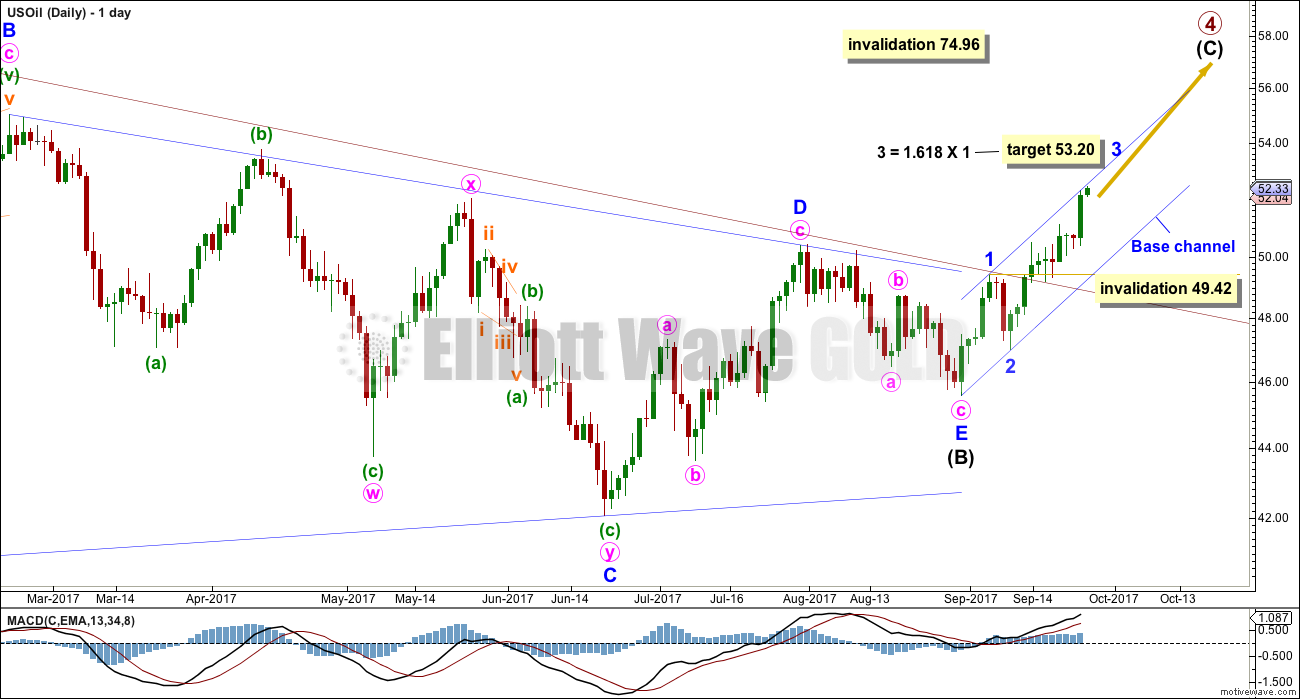
A short term target is given for minor wave 3.
Minor wave 3 exhibits an increase in upwards momentum and now has some support from volume.
Any corrections along the way up should find support at the lower edge of the base channel.
At this stage, price is finding resistance at the upper edge of the base channel. Third waves often (not always) have the power to break through base channels in the direction of the trend. Here, minor wave 3 may be able to break above the upper edge of this blue channel.
At this stage, if the target is wrong, it looks like it may be a little too low.
When minor wave 3 is complete, then minor wave 4 may not move into minor wave 1 price territory below 49.42.
ALTERNATE WEEKLY ELLIOTT WAVE COUNT
Click chart to enlarge.
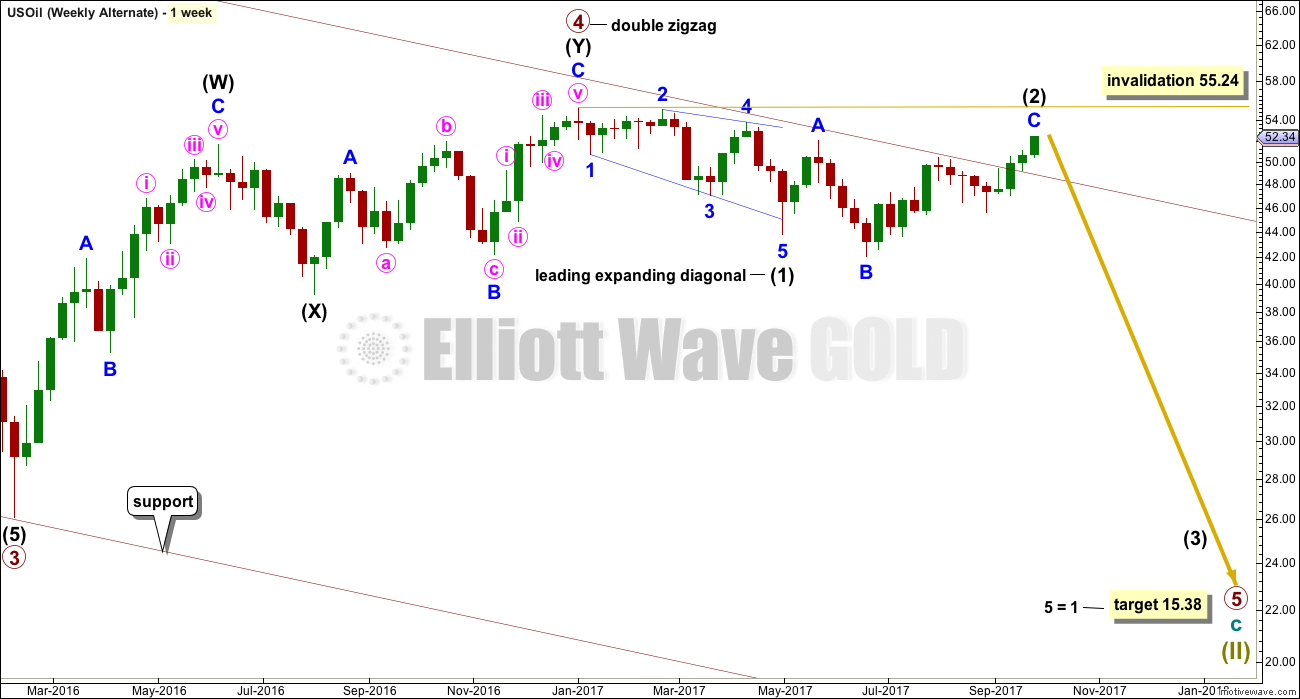
This alternate wave count considers the possibility that primary wave 4 is over and primary wave 5 has begun.
Primary wave 5 may have begun with a leading expanding diagonal for intermediate wave (1). The current deep bounce may be a continuation of intermediate wave (2) as an expanded flat correction.
Intermediate wave (2) may not move beyond the start of intermediate wave (1) above 55.24.
Second wave corrections following first wave leading diagonals are commonly very deep indeed.
Only the breach of the maroon trend channel is judged to give this wave count a slightly lower probability in terms of Elliott wave than the main wave count. If primary wave 4 was over, then that trend channel should have provided resistance.
ALTERNATE DAILY ELLIOTT WAVE COUNT
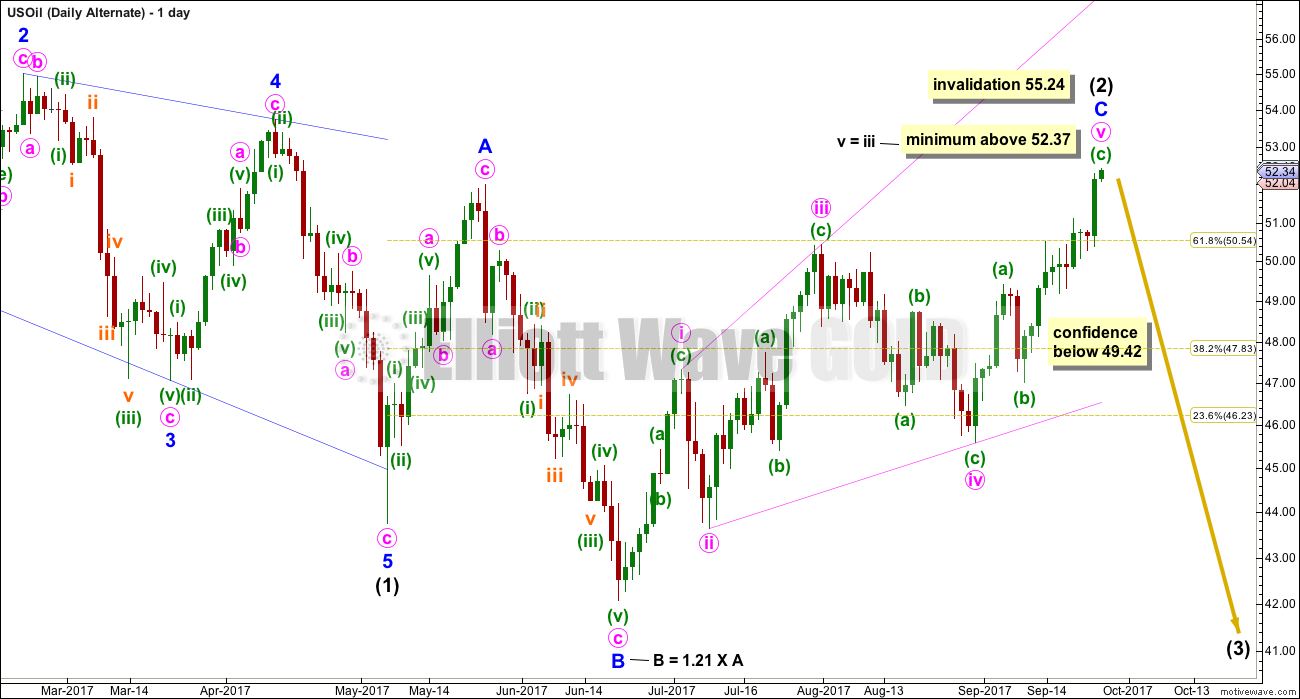
Click chart to enlarge.
The leading diagonal for intermediate wave (1) ended with a strong overshoot of the 1-3 trend line. While this is very typical of contracting diagonals, it is less common for expanding diagonals.
Intermediate wave (2) fits so far as an expanded flat correction.
Minor wave C may be another expanding diagonal, this one ending. Within ending diagonals, all sub-waves must subdivide as zigzags and the fourth wave should overlap first wave price territory.
Minute wave v must be longer than minute wave iii within an expanding diagonal, so that the rule regarding wave lengths is met. Minute wave v must end above 52.37. It has met this minimum requirement. It is possible now that it could be complete.
Minor wave C has now moved above the end of minor wave A at 52.00 avoiding a truncation and a very rare running flat.
A new low now below 49.42 would invalidate the main daily wave count, so at that stage the invalidation would provide some confidence in this alternate.
TECHNICAL ANALYSIS
DAILY CHART
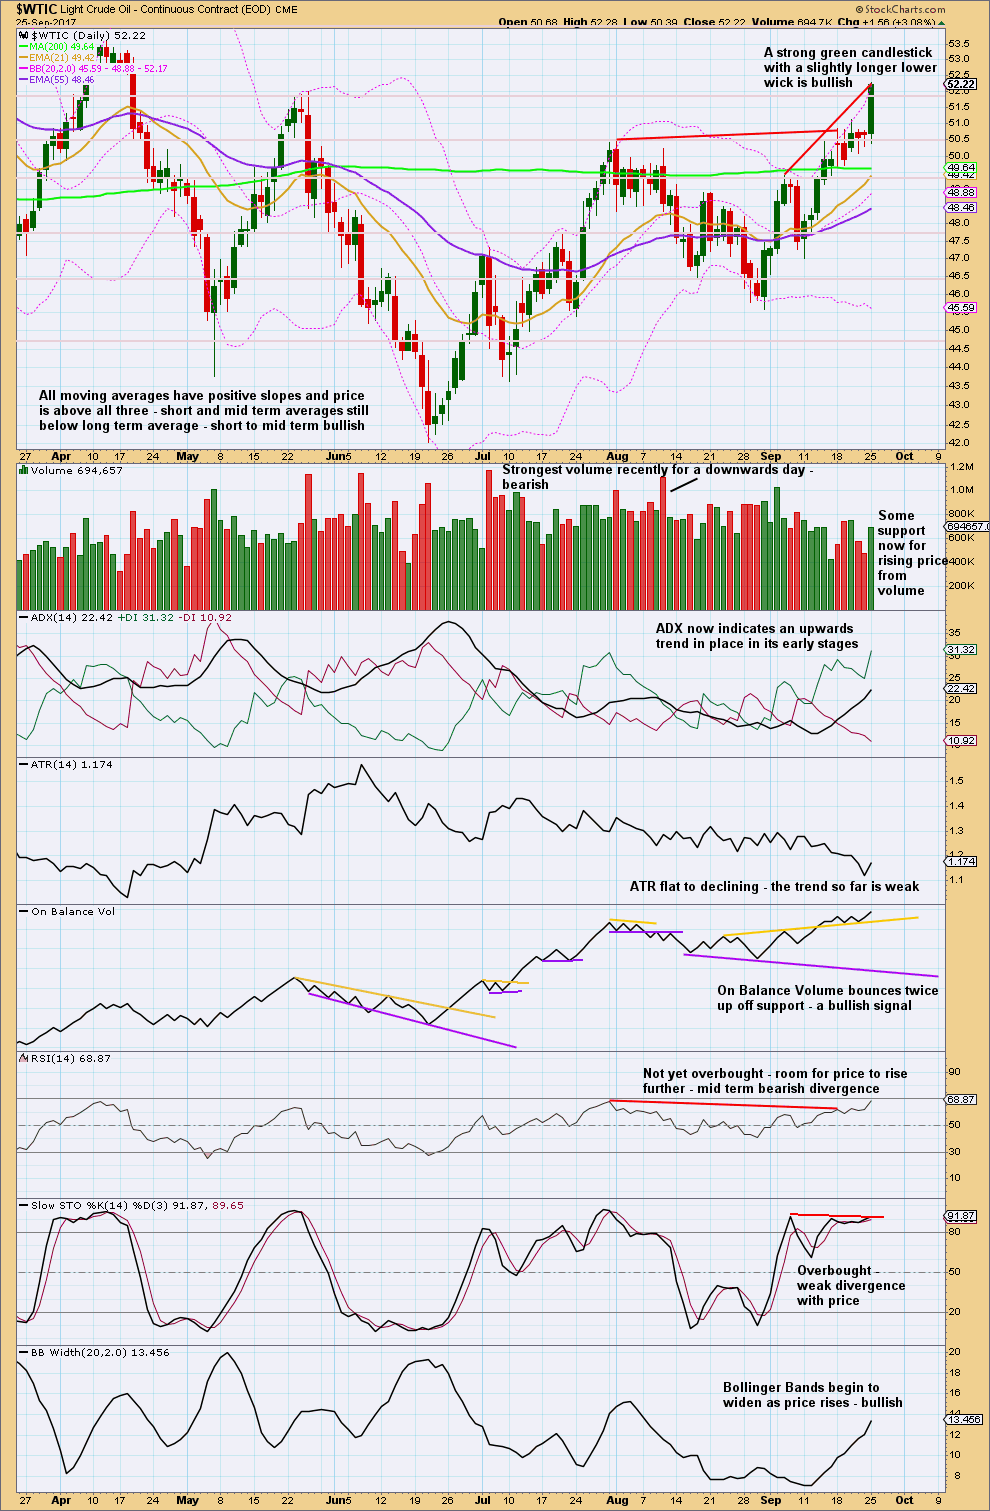
Click chart to enlarge. Chart courtesy of StockCharts.com.
On Balance Volume continues to be a leading indicator. This week On Balance Volume gives two more bullish signals with two bounces up from the yellow support line. Give this indicator reasonable weight. At this time, it supports the main Elliott wave count.
Declining ATR supports the idea that this upwards trend may not be too long lived.
VOLATILITY INDEX
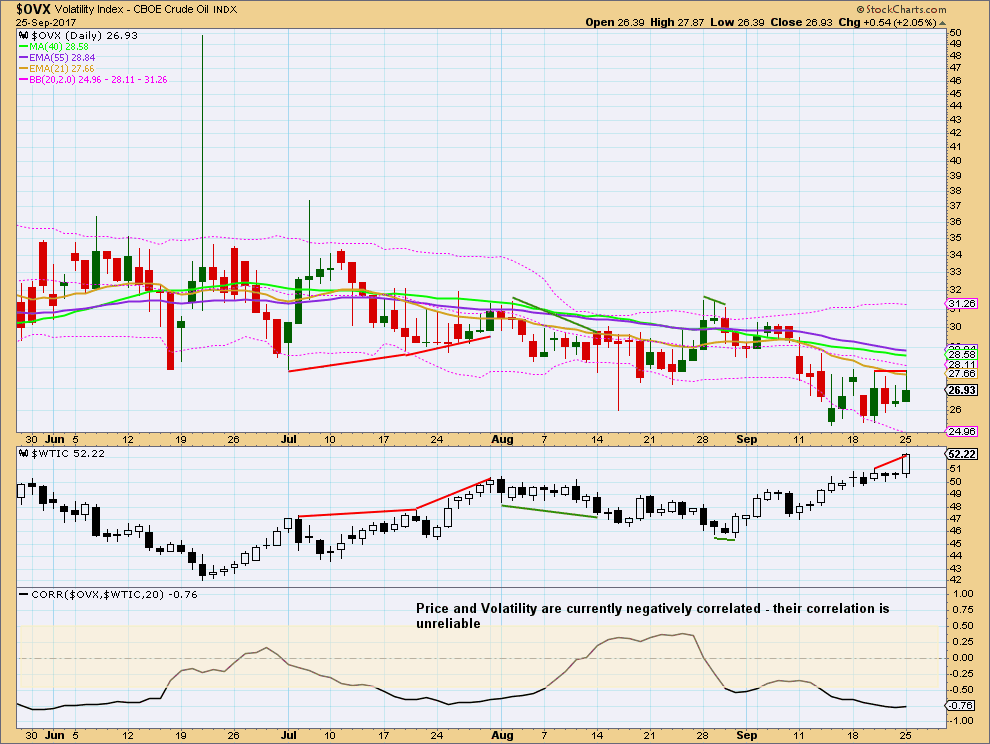
Click chart to enlarge. Chart courtesy of StockCharts.com.
Normally, volatility should decline as price rises and volatility should increase as price falls. Divergence from this normal can provide a bullish or bearish signal for Oil. However, it is noted that this signal occurs both in minor and major lows and it cannot be used to distinguish between them.
Price has moved strongly higher for the last session of the 25th of September, but volatility has not shown any decline and instead has shown some increase. Along with this single day divergence there is short term divergence between the last two small highs in price and volatility. This is bearish. The rise in price is weak; it does not have normal declining volatility.
Published @ 12:35 a.m. EST.
Updated daily chart showing some more detail of the current rise up
Today, iv went into 1 territory so perhaps minor 3 was over at last high. Still like target around 53.5 for C wave to end.
Exactly.