Three Elliott wave counts are presented below in the order in which they were developed, not in the order of probability:
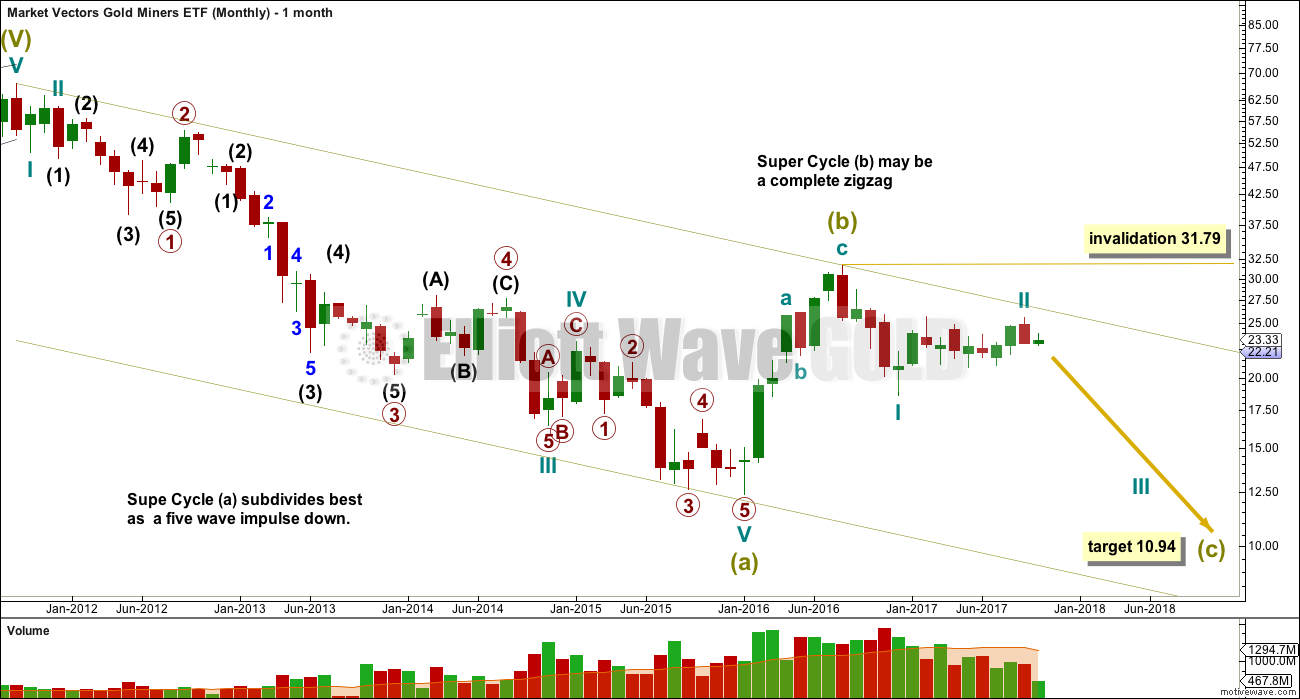
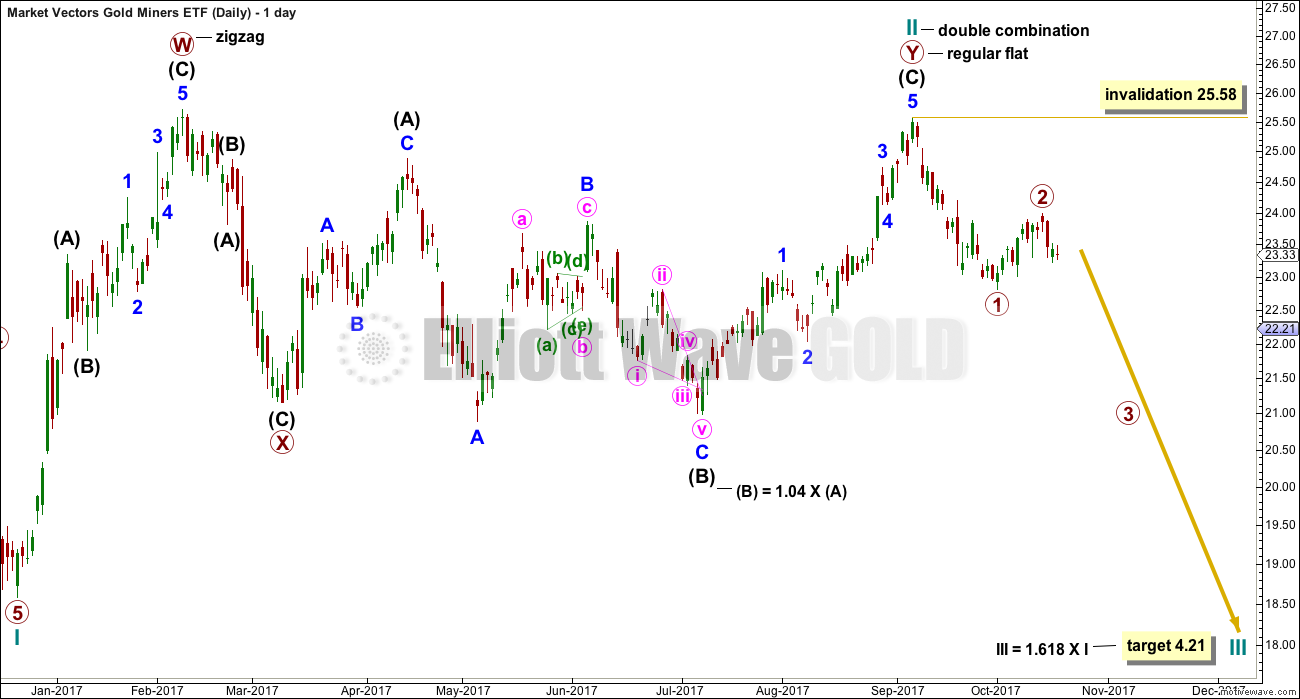
FIRST WAVE COUNT
MONTHLY CHART
DAILY CHART
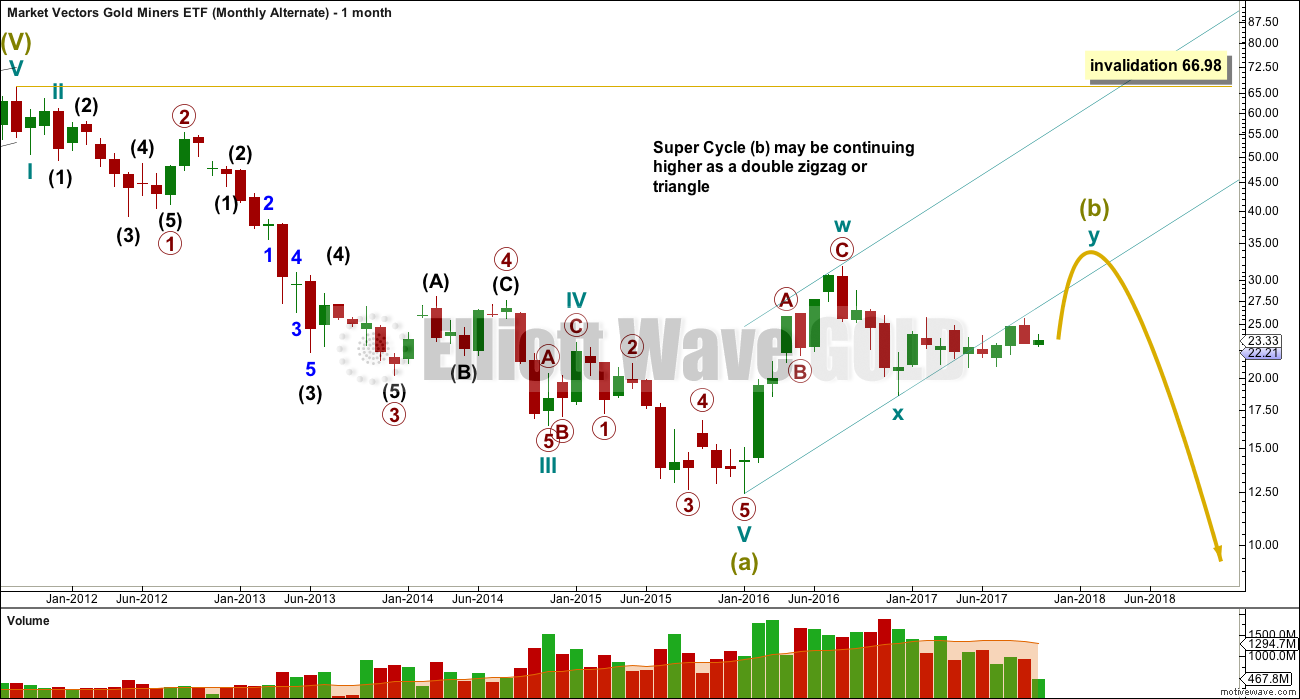
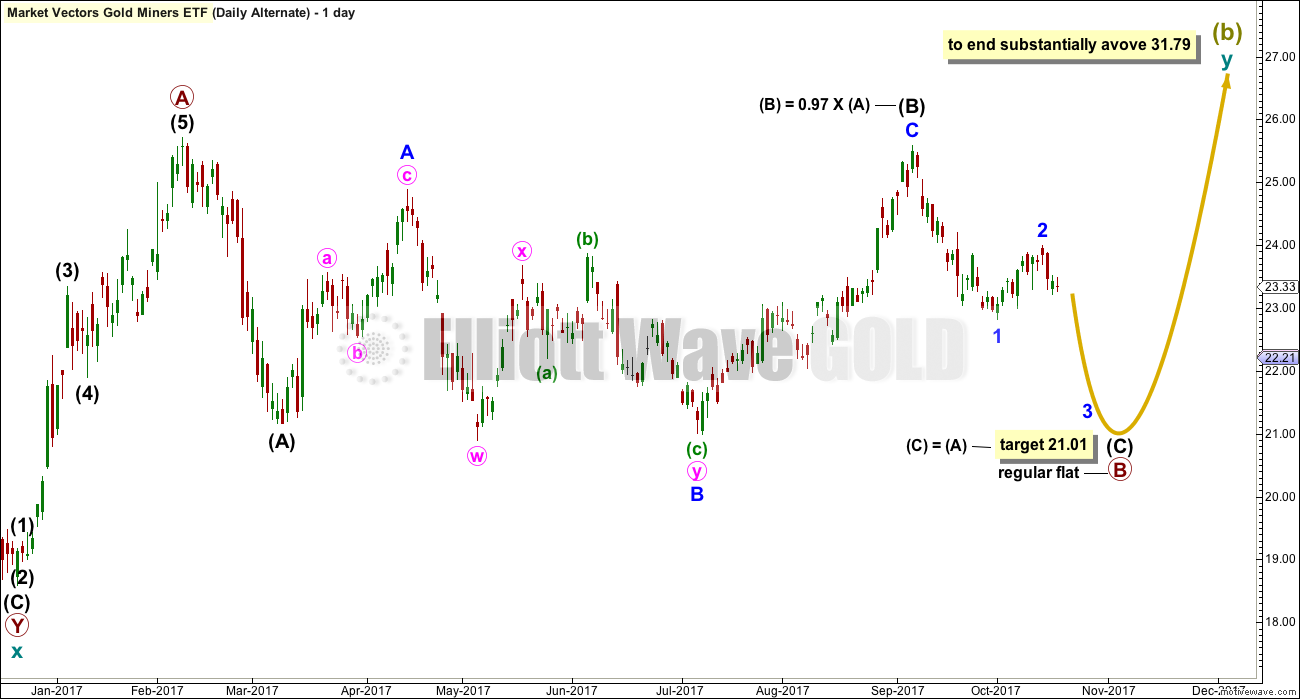
SECOND WAVE COUNT
MONTHLY CHART
DAILY CHART
THIRD WAVE COUNT
MONTHLY CHART
DAILY CHART
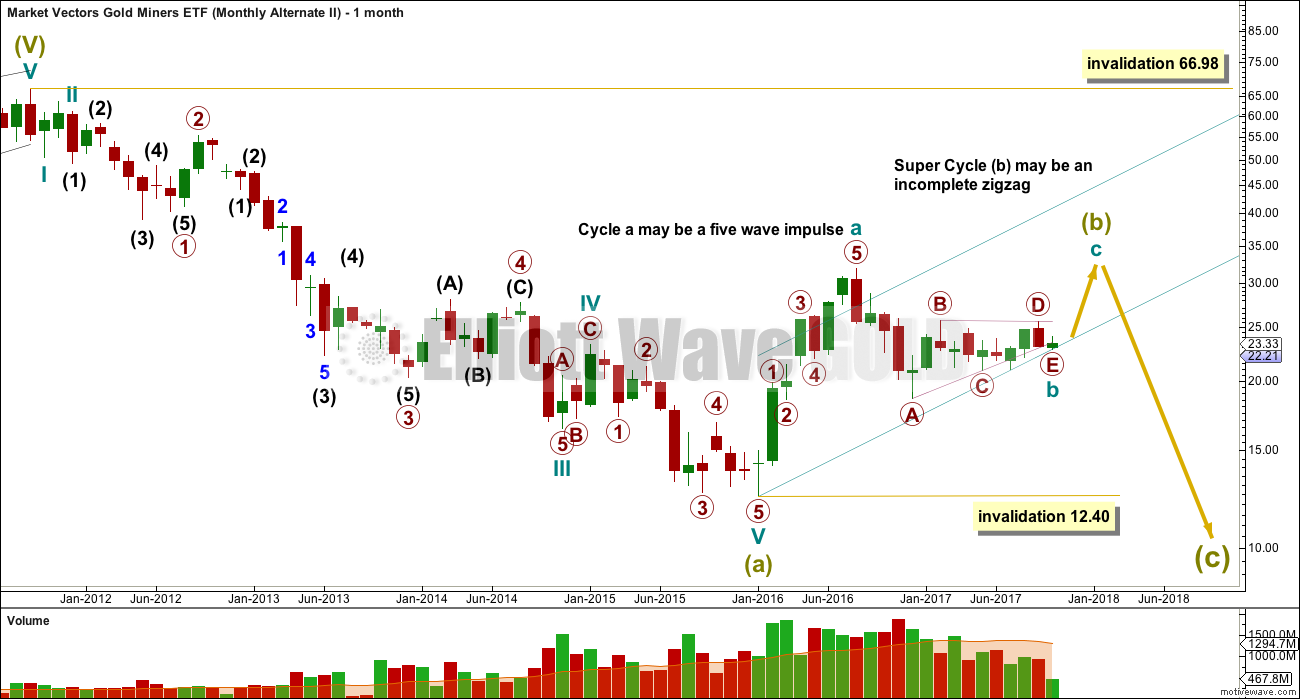
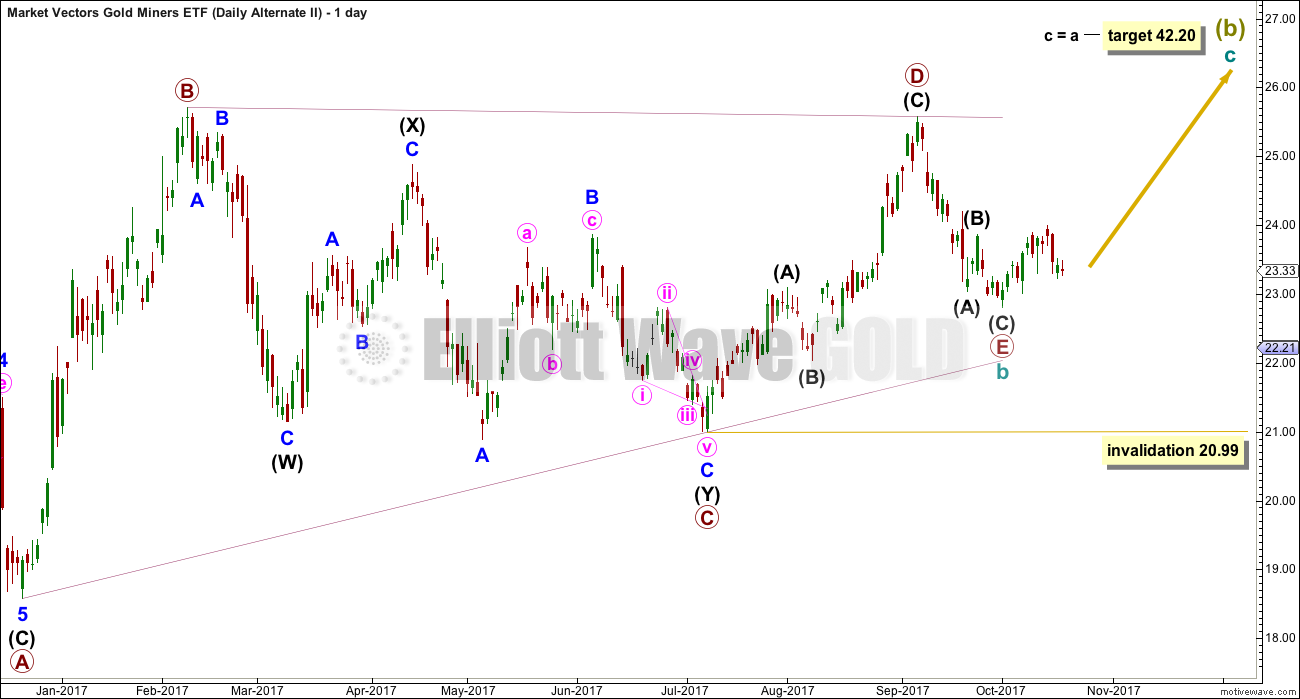
For most recent movement, this wave count has the best fit in terms of Elliott wave structure. It does look like a barrier triangle has recently finished, which may be cycle wave b.
If the triangle is correctly labelled, then this tells us two things, because it cannot be a second nor fourth wave and so may only be a B wave:
1. The breakout from this multi month consolidation should be upwards.
2. After an upwards wave to last one to several years, GDX should then turn downwards for wave C.
Published @ 02:20 a.m. EST.

Lara, thank you for the GDX update. Always good to see your thoughts.
Focusing in on your 3rd count (Barrier Triangle), I’d like to understand the differences between my traditional triangle and your Barrier triangle and why you would choose one over the other?
For example, I think both counts have one or more anomalies. For example, your count has Minor C of Intermediate Y of Primary C with a .10 truncation and my triangle has a large overshoot for Wave E.
There are many other differences, but bottom line, I don’t see any rule violations for either count. My count could easily be changed to an ABC vs. a WXY and we could align the overall degree of labeling.
So how/why do you choose one over the other? Do you just like the look of the barrier triangle better or ?
Thanks,
https://www.tradingview.com/x/3ol3UxZC/