
Downwards movement continued overall as the last analysis expected.
Summary: The larger trend remains up but a pullback is underway. At its end, it should offer an entry point to join the upwards trend. That may not be until the end of this week or the beginning of next week.
The target for the pullback to end is 1,278. This target may not be low enough now.
New updates to this analysis are in bold.
Last monthly charts for the main wave count are here, another monthly alternate is here, and video is here.
Grand SuperCycle analysis is here.
The wave counts will be labelled first and second. Classic technical analysis will be used to determine which wave count looks to be more likely. In terms of Elliott wave structure the second wave count has a better fit and fewer problems.
FIRST ELLIOTT WAVE COUNT
WEEKLY CHART
Click chart to enlarge.
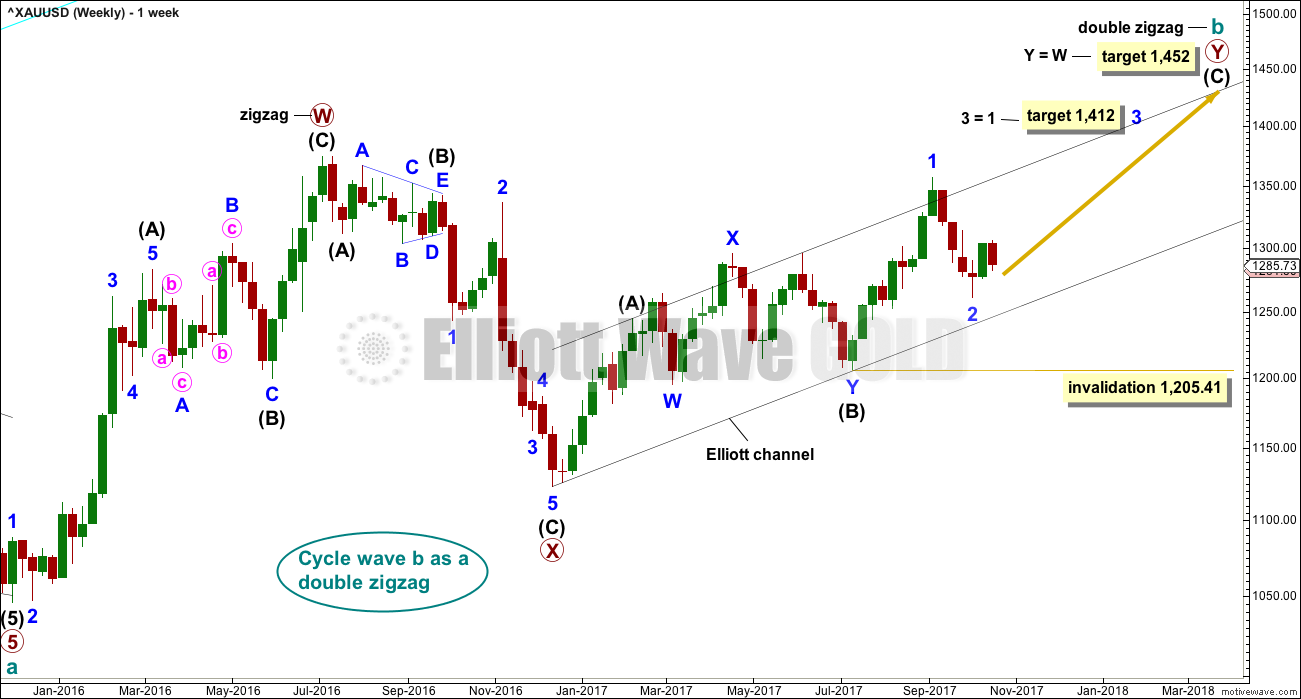
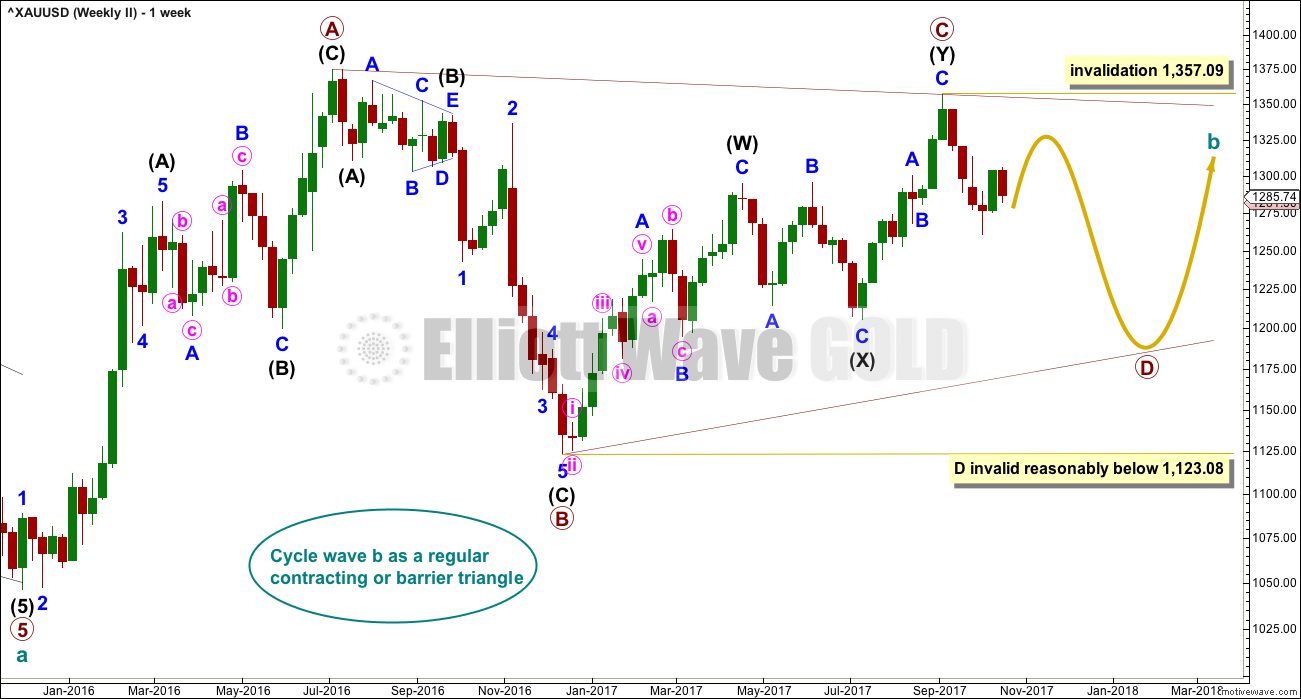
There are more than 23 possible corrective structures that B waves may take, and although cycle wave b still fits well at this stage as a triangle, it may still be another structure. This wave count looks at the possibility that it may be a double zigzag.
If cycle wave b is a double zigzag, then current upwards movement may be part of the second zigzag in the double, labelled primary wave Y.
The target remains the same.
Within intermediate wave (C), no second wave correction may move beyond the start of its first wave below 1,205.41. However, prior to invalidation, this wave count may be discarded if price breaks below the lower edge of the black Elliott channel. If this wave count is correct, then intermediate wave (C) should not break below the Elliott channel which contains the zigzag of primary wave Y upwards.
There are now three problems with this wave count which reduce its probability in terms of Elliott wave:
1. Cycle wave b is a double zigzag, but primary wave X within the double is deep and time consuming. While this is possible, it is much more common for X waves within double zigzags to be brief and shallow.
2. Intermediate wave (B) within the zigzag of primary wave Y is a double flat correction. These are extremely rare, even rarer than running flats. The rarity of this structure must further reduce the probability of this wave count.
3. Although intermediate wave (C) should be continuing so that primary wave Y ends substantially above the end of primary wave W, the duration and depth of minor wave 2 within it now looks to be too large at the weekly time frame.
DAILY CHART
Click chart to enlarge.
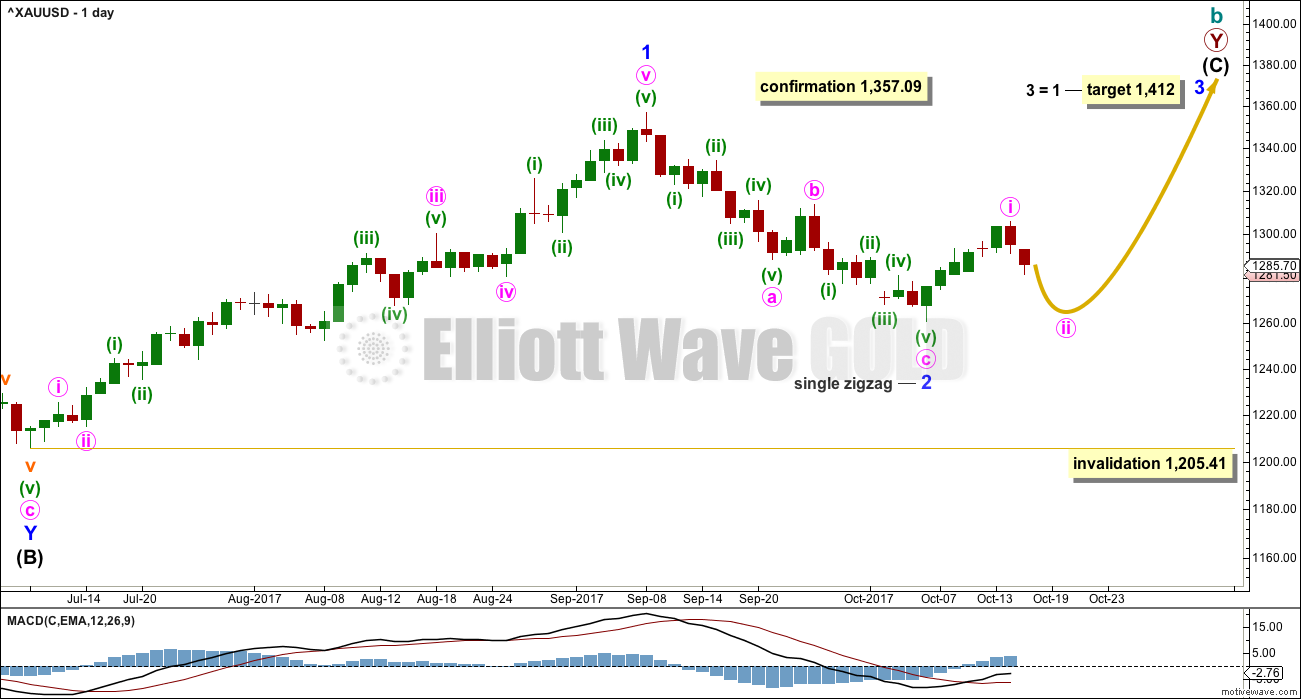
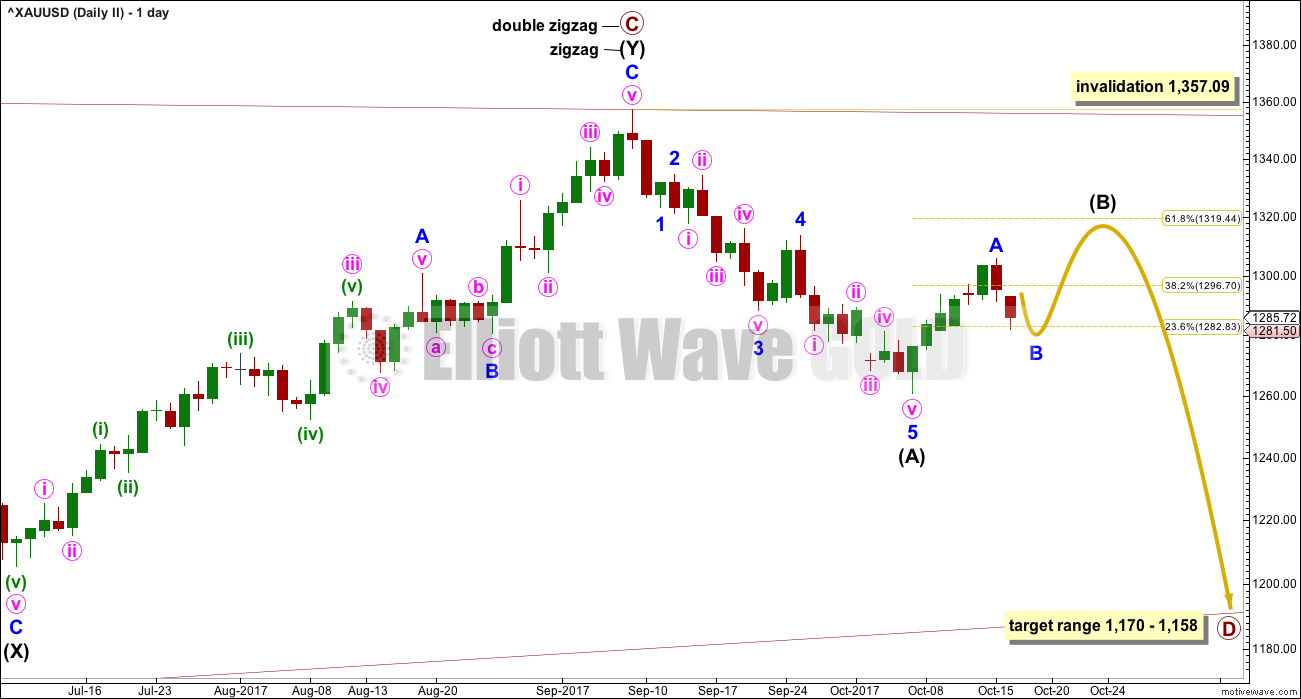
The analysis will focus on the structure of intermediate wave (C). To see details of all the bull movement for this year see daily charts here.
Intermediate wave (C) must be a five wave structure, either an impulse or an ending diagonal. It is unfolding as the more common impulse.
It is possible that minor waves 1 and now 2 may both be over. Minor wave 2 may have ended very close to the 0.618 Fibonacci ratio. If it continues lower, then minor wave 2 may not move beyond the start of minor wave 1 below 1,205.41.
Minor wave 1 lasted 44 days and minor wave 2 may have lasted 20 days, just one short of a Fibonacci 21.
It is of some concern now that minor wave 3 appears to be starting out rather slowly. This is somewhat unusual for a third wave and offers some support now to the second Elliott wave count. With StockCharts data showing a steady decline in volume as price rises, this concern is now validated.
Attention now turns to the structure of minute wave ii. Members would be best to focus on when the structure may be complete rather than on how price may move within it. There are too many structural possibilities for corrections, and for smaller degree corrections they do not present good trading opportunities. At its end, minute wave ii should present an opportunity to join the current upwards trend.
Two hourly wave counts are provided today that look at minute wave ii in two different ways. These hourly wave counts work in the same way for the second Elliott wave count, only the degree of labelling there would be one degree higher for minor wave B instead of minute wave ii.
MAIN HOURLY CHART
Click chart to enlarge.
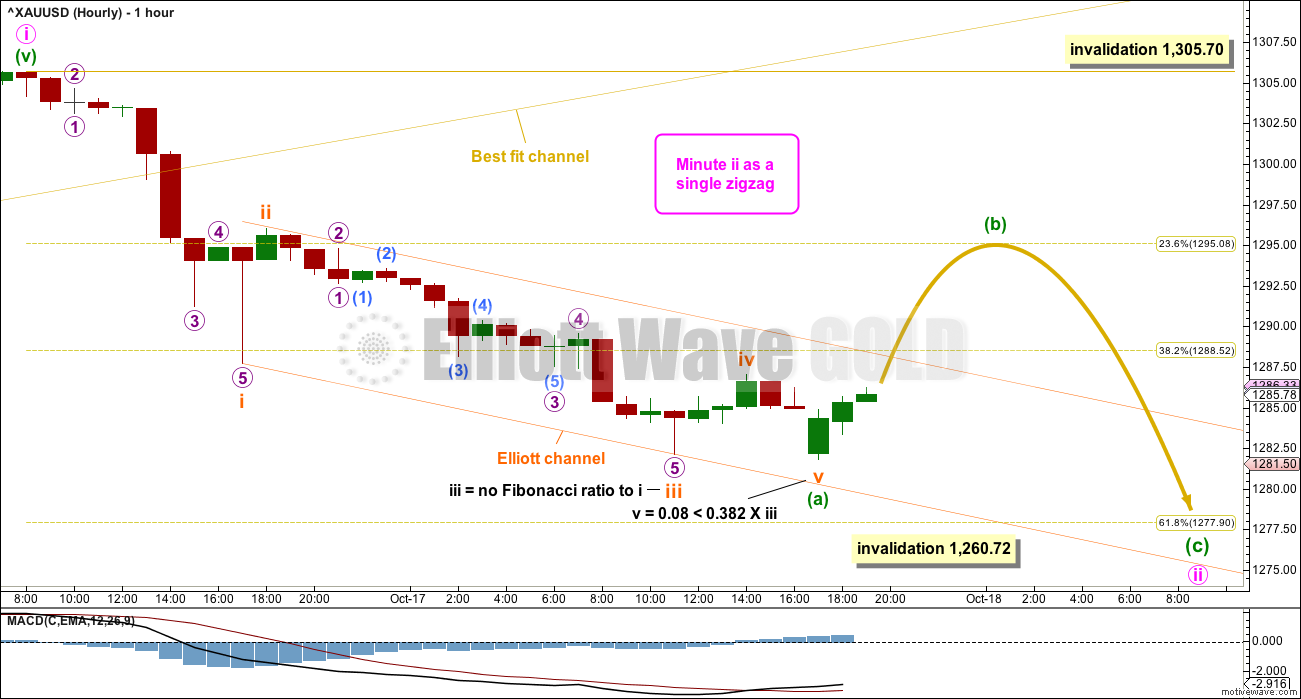
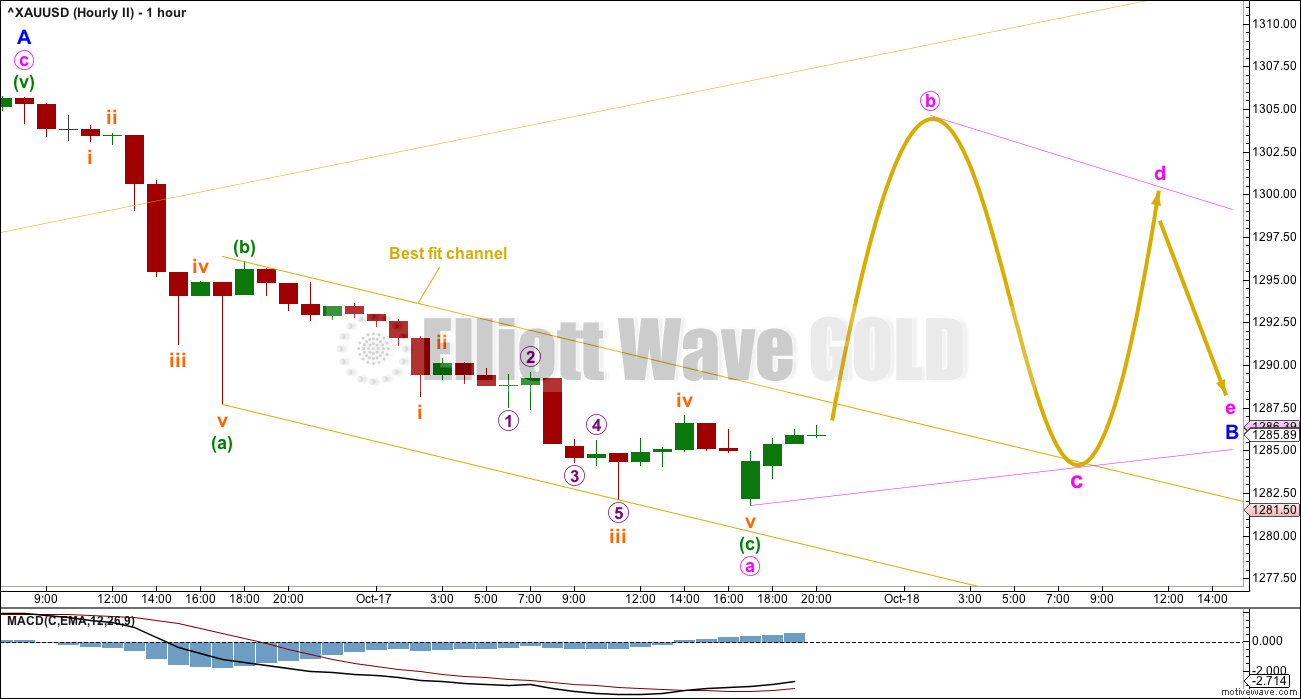
The most likely target for minute wave ii would be the 0.618 Fibonacci ratio of minute wave i, but it may not be low enough if this target is wrong. The first second wave correction within a new trend is commonly very deep for Gold.
Minute wave ii may not move beyond the start of minute wave i below 1,260.72.
Minute wave i would have lasted six days (not a Fibonacci number). Minute wave ii may be initially expected to total a Fibonacci three days, minimum, but more likely will last a Fibonacci five or eight days.
Minute wave ii would most likely be a zigzag, but it may be any other corrective structure except a triangle.
This first hourly chart looks at minute wave ii as a zigzag. If it is a zigzag, then minuette wave (a) within it should be a five wave structure. When an A wave subdivide as a five, the following B wave may not move beyond its start, so minuette wave (b) may not move beyond the start of minuette wave (a) above 1,305.70.
A breach of the orange Elliott channel by upwards movement would add confidence to the labelling of minuette wave (a) as complete. At that stage, expect either very choppy and overlapping sideways movement for minuette wave (b), or equally as likely a short, sharp, upwards zigzag for minuette wave (b).
Thereafter, minuette wave (c) downwards should move below the end of minuette wave (a) to avoid a truncation. When minuette wave (b) is complete and the start of minuette wave (c) is known, then the ratio between minuette waves (a) and (c) may be used to calculate a target for minute wave ii to end. That cannot be done yet, so only the 0.618 Fibonacci ratio of minute wave i at 1,278 will continue to be used.
ALTERNATE HOURLY CHART
Click chart to enlarge.
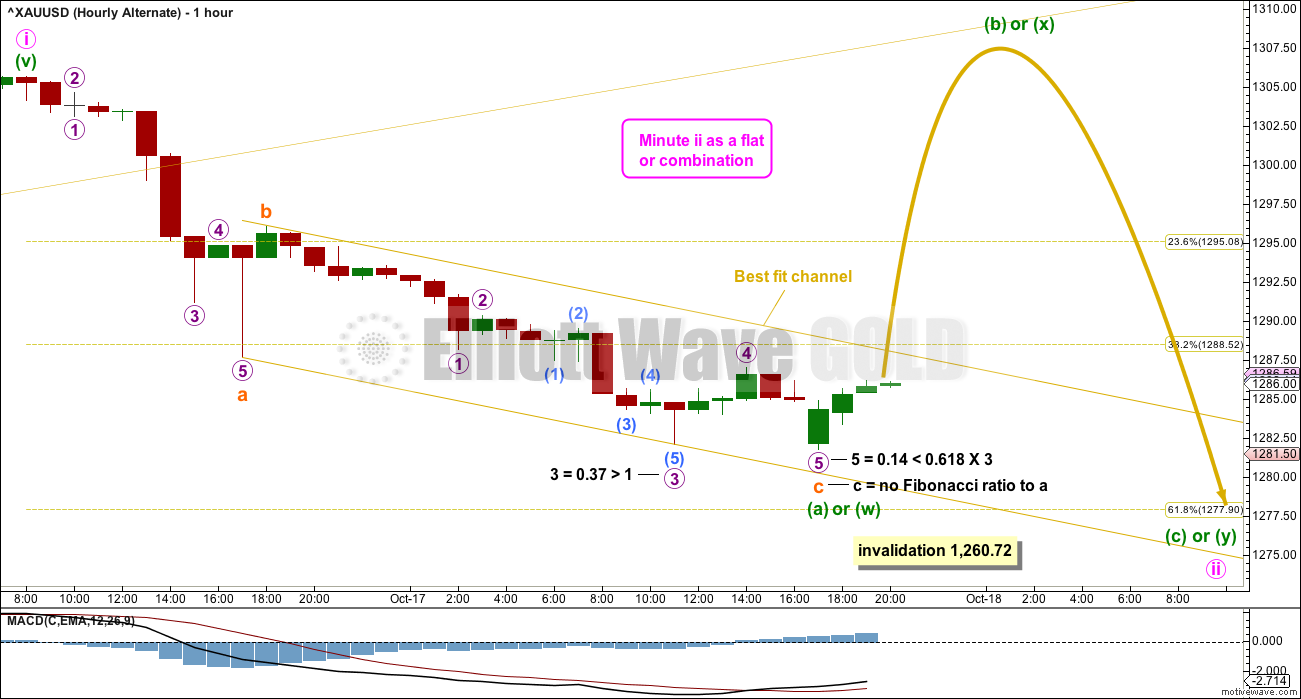
While minute wave ii is most likely to be a zigzag, it may also be a flat, combination or double zigzag. The downwards wave labelled minuette wave (a) may be seen as a three. This wave count is an alternate because the proportion of subminuette wave b to subminuette waves a and c does not look right. While B waves can be this brief and shallow, it is unusual.
If minute wave ii is a flat correction, then within it minuette wave (b) must retrace a minimum 0.9 length of minuette wave (a) at 1,313.31. Minuette wave (b) may move beyond the start of minuette wave (a) as in an expanded flat. A common range for B waves within flats is from 1 to 1.38 the length of their A waves, giving a range for minuette wave (b) from 1,305.70 to 1,314.79.
If minute wave ii is a combination, then within it there is no minimum requirement for minuette wave (x). The first structure in a double combination may now be complete as a zigzag for minuette wave (w). The double would now be needing a three in the opposite direction for minuette wave (x). X waves within combinations are most commonly zigzags and are almost always deep. It may make a new price extreme beyond the start of minuette wave (w); there is no maximum length for X waves.
If minute wave ii is a double zigzag, then within it minuette wave (x) would be most likely to be brief and shallow.
A breach of the best fit channel, which is drawn in exactly the same way on both hourly charts today, is required for confidence that a bounce has arrived.
SECOND ELLIOTT WAVE COUNT
WEEKLY CHART
Click chart to enlarge.
It is still possible that cycle wave b is unfolding as a regular contracting or barrier triangle.
Within a triangle, one sub-wave should be a more complicated multiple, which may be primary wave C. This is the most common sub-wave of the triangle to subdivide into a multiple.
Intermediate wave (Y) now looks like a complete zigzag at the weekly chart level.
Primary wave D of a contracting triangle may not move beyond the end of primary wave B below 1,123.08. Contracting triangles are the most common variety.
Primary wave D of a barrier triangle should end about the same level as primary wave B at 1,123.08, so that the B-D trend line remains essentially flat. This involves some subjectivity; price may move slightly below 1,123.08 and the triangle wave count may remain valid. This is the only Elliott wave rule which is not black and white.
Finally, primary wave E of a contracting or barrier triangle may not move beyond the end of primary wave C above 1,295.65. Primary wave E would most likely fall short of the A-C trend line. But if it does not end there, then it can slightly overshoot that trend line.
Primary wave A lasted 31 weeks, primary wave B lasted 23 weeks, and primary wave C lasted 38 weeks.
The A-C trend line now has too weak a slope. At this stage, this is now a problem for this wave count, the upper A-C trend line no longer has such a typical look.
Within primary wave D, no part of the zigzag may move beyond its start above 1,357.09.
DAILY CHART
Click chart to enlarge.
This second wave count expects the new wave down may be deeper and longer lasting than the first wave count allows for.
A common length for triangle sub-waves is from 0.8 to 0.85 the length of the prior wave. Primary wave D would reach this range from 1,170 to 1,158.
If primary wave C is correctly labelled as a double zigzag, then primary wave D must be a single zigzag.
Within the single zigzag of primary wave D, intermediate wave (A) is labelled as a complete impulse.
Intermediate wave (A) lasted 20 days, just one short of a Fibonacci 21. Intermediate wave (B) may be about the same duration, so that this wave count has good proportions, or it may be longer because B waves tend to be more complicated and time consuming.
Intermediate wave (B) may be a sharp upwards zigzag, or it may be a choppy overlapping consolidation as a flat, triangle or combination. At this stage, it looks most likely to be incomplete because an intermediate degree wave should last weeks. At its conclusion intermediate wave (B) should have an obvious three wave look to it here on the daily chart.
HOURLY CHART
Click chart to enlarge.
While the first two hourly charts for the first Elliott wave count also work in exactly the same way for this second wave count, there is another option that only works for this second wave count.
Second waves may not subdivide as triangles, so this idea does not work for the first Elliott wave count. But B waves may subdivide as triangles.
It is possible that price may be entering a sideways, time consuming, choppy movement to last another week and possibly two.
The best fit channel is the same and price is still required to break above it before any confidence in a bounce may be had.
TECHNICAL ANALYSIS
WEEKLY CHART
Click chart to enlarge. Chart courtesy of StockCharts.com.
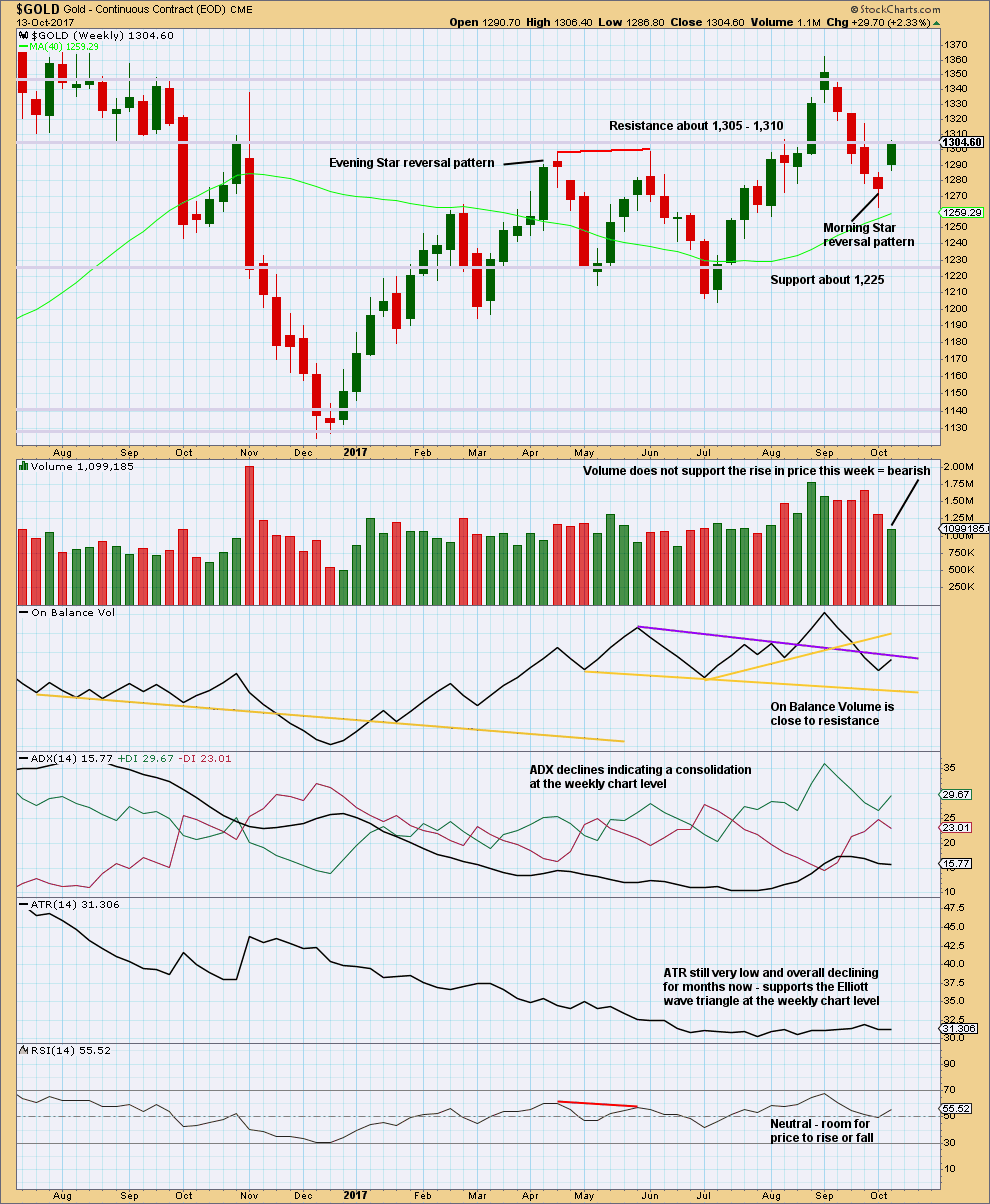
This last weekly candlestick completes a Morning Star reversal pattern, which is bullish.
Without support from volume for upwards movement though, it should be suspicious. The reversal pattern may signify a new sideways trend or a short lived upwards bounce.
Resistance at On Balance Volume may halt the rise in price.
DAILY CHART
Click chart to enlarge. Chart courtesy of StockCharts.com.
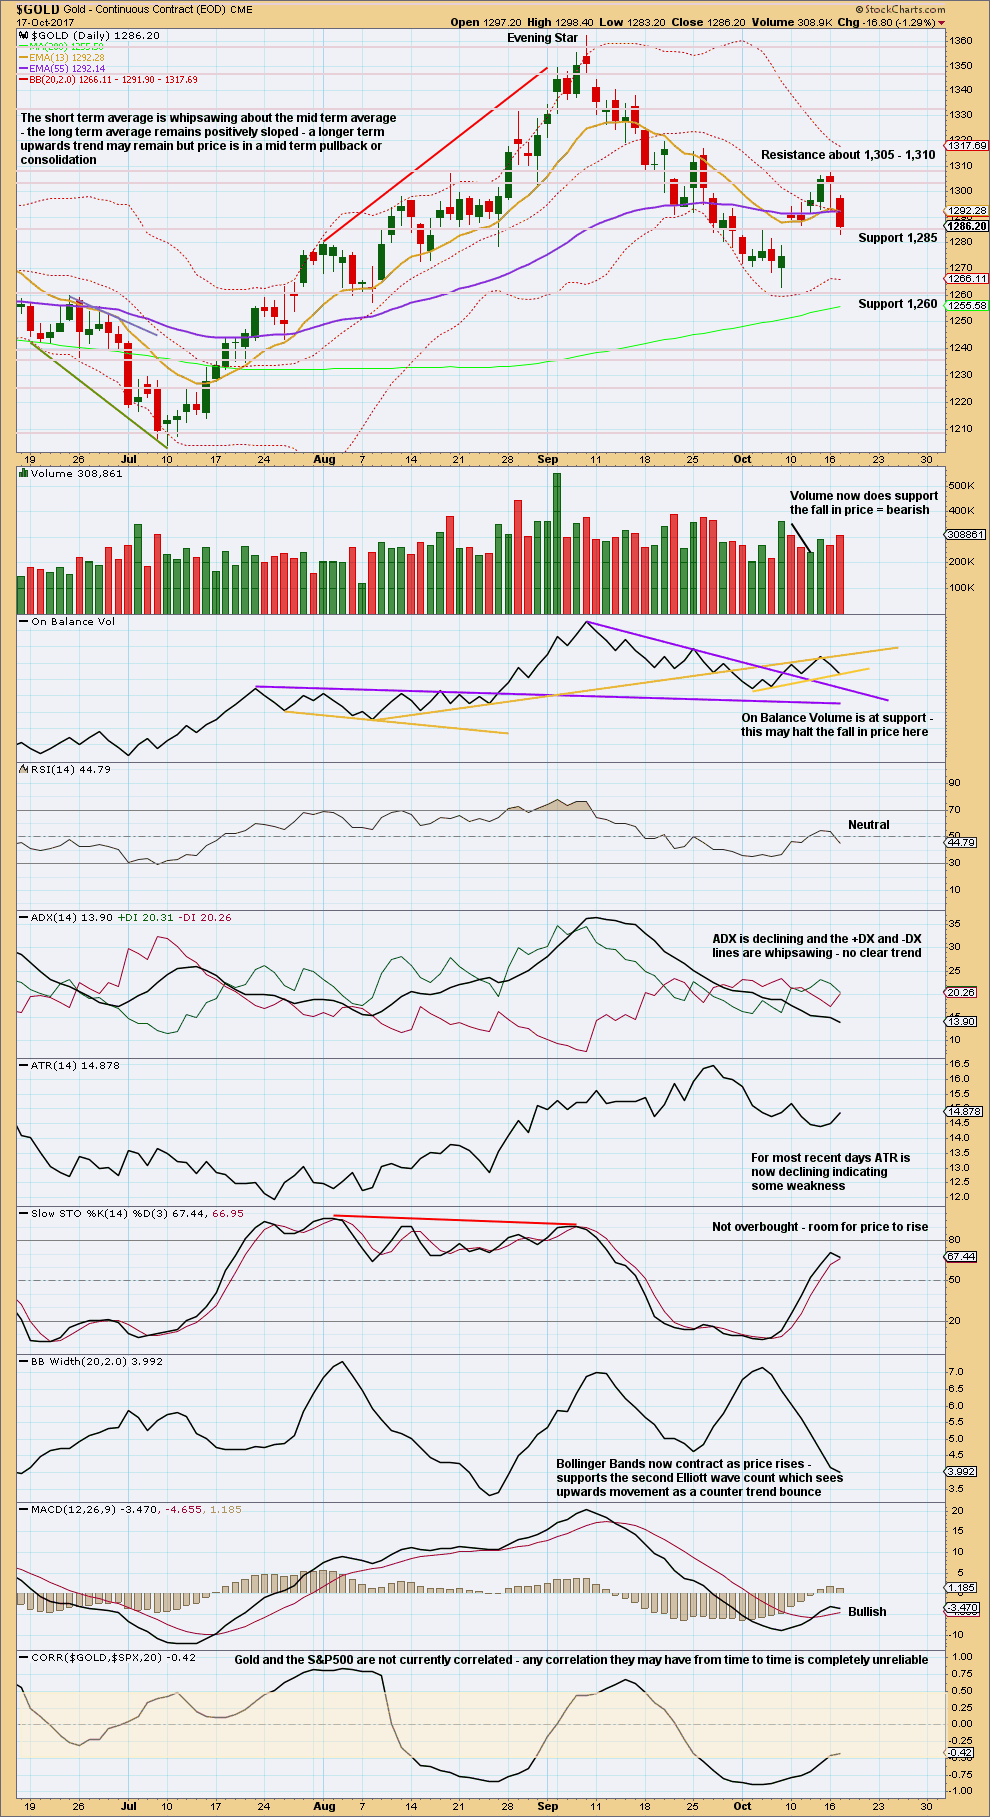
On Balance Volume is at support. This may initiate a small bounce here.
However, volume today disagrees, so downwards movement may continue tomorrow.
The last three candlesticks do not properly complete an Evening Star reversal pattern. There is no gap between the first and second candlesticks, which is a requirement according to Nison.
GDX
DAILY CHART
Click chart to enlarge. Chart courtesy of StockCharts.com.
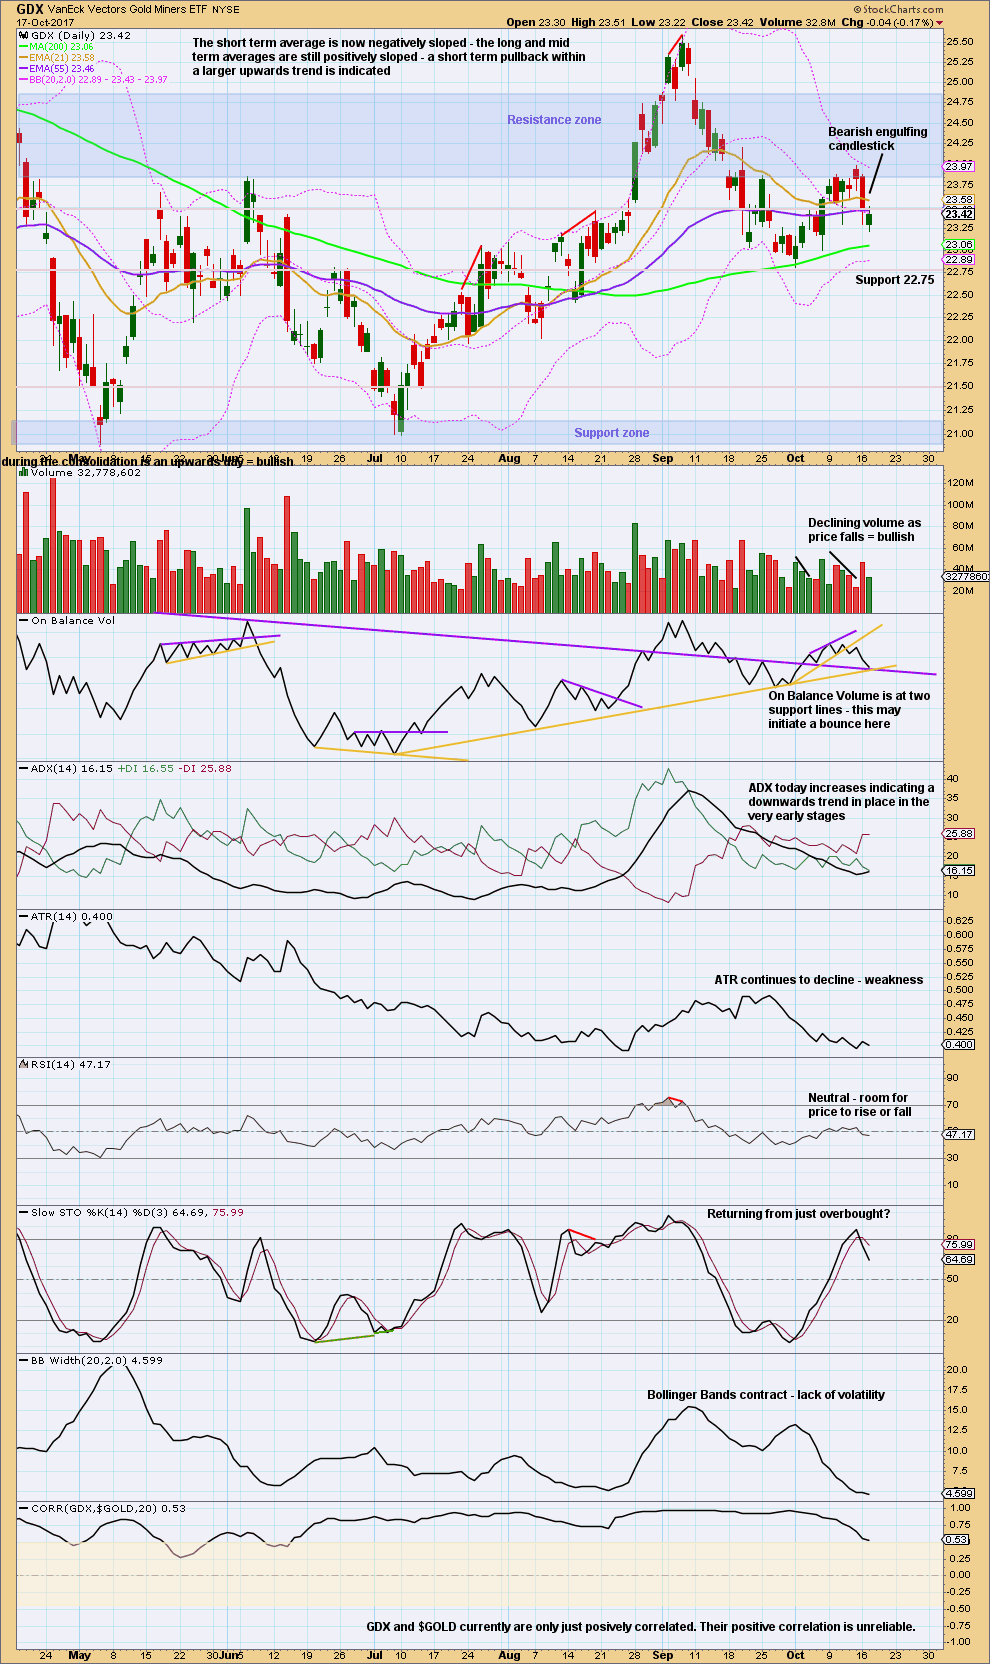
With On Balance Volume at support at two trend lines, and a decline in volume today as price moved lower, GDX again looks to be a little clearer than Gold. A bounce here looks to be very likely for tomorrow.
Published @ 08:43 p.m. EST.
Updated first main hourly chart:
A zigzag now could be complete ending very close to the 0.618 Fibonacci ratio of minute wave i.
The alternate idea will move this zigzag down one degree, it may be only wave A of a flat correction, or wave W of a combination, or for the second Elliott wave count wave A of a triangle.
Apart from an expanded flat all of those are sideways structures.
And so… a trading strategy would be to enter long as soon as the channel is breached by upwards movement which is when we may have some confidence a low is in place. Stops just below the last low please. Invest only 1-5% of equity on any one trade.
Newer members should know that my risk management advice is very serious. It is the most important aspect of trading that novice traders miss, and lack of risk management is the reason why novices will wipe out their accounts at least once.
Just in case any members missed it, there’s another “spot the mistakes” for you to have a go at here. I’ll post answers in a few hours.
View: Gold price is under selling pressure from under 1283/84 and should head on down for a take out of 1275-72. On the daily CCI is below zero (0) & DMI+ crossed below DMI-. Lets see.
The miners stepped up to the plate today and exhibited some relative strength compared to Gold, by closing almost flat while Gold continued down.
With Lara expecting up to a few more days for Gold to finish it’s correction, I may be way off base with these thoughts. Based on the GDX count and in order for GDX to maintain it’s immediate bullish count, I’m still looking for just one more quick move down for GDX to about 23.15ish. This would keep the base channel and the immediate uptrend on track. This idea, of course, will require Gold to complete it’s correction today and start moving up.
Should this idea fail, a move below 22.81 would mean that Minor 2 is continuing, so caution is advised.
Good luck!
https://www.tradingview.com/x/upnEYSby/