
Further downwards movement continued as the last analysis expected.
Summary: The pullback may be over. A clear breach of the channel on the hourly charts by upwards movement would give confidence that a low is in place. At that stage, long positions would have slightly less risk. Stops should be set just below the invalidation point at 1,260.72; give the market a little room to move.
The target would be at 1,320 in the first instance. It may be as high as 1,412, but this looks less likely.
Invest only 1-5% of equity on any one trade.
New updates to this analysis are in bold.
Last monthly charts for the main wave count are here, another monthly alternate is here, and video is here.
Grand SuperCycle analysis is here.
The wave counts will be labelled first and second. Classic technical analysis will be used to determine which wave count looks to be more likely. In terms of Elliott wave structure the second wave count has a better fit and fewer problems.
FIRST ELLIOTT WAVE COUNT
WEEKLY CHART
Click chart to enlarge.
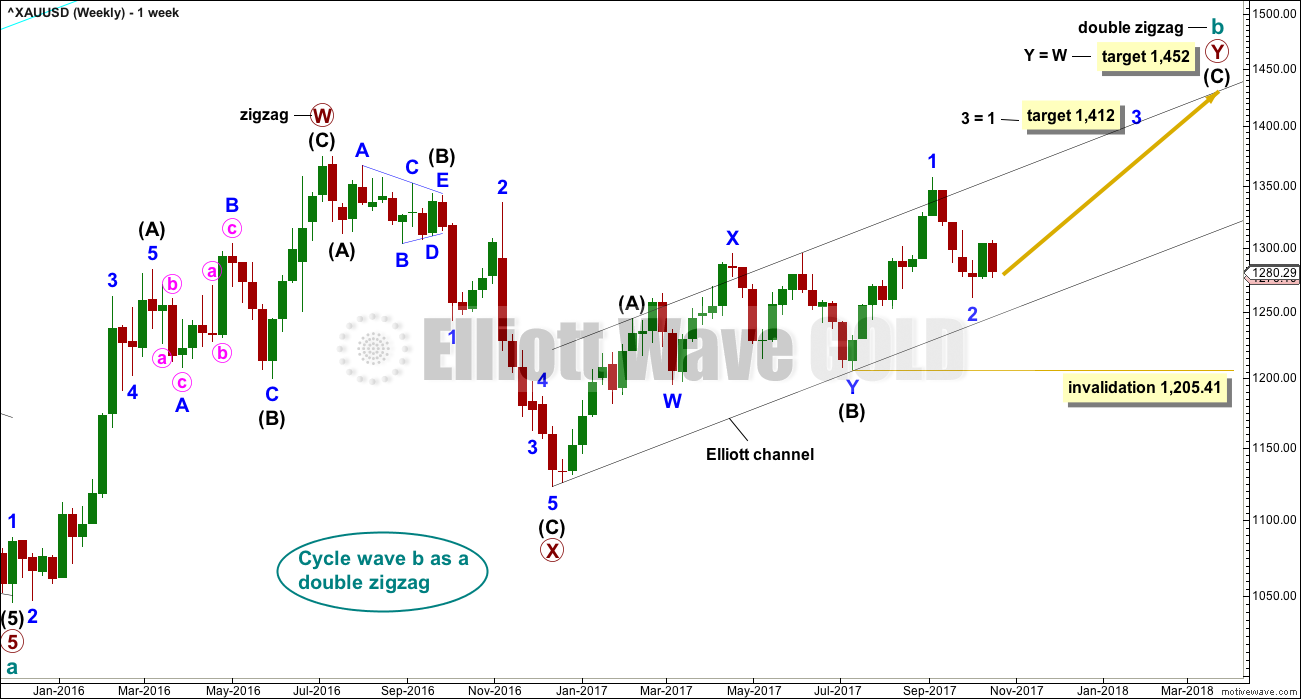
There are more than 23 possible corrective structures that B waves may take, and although cycle wave b still fits well at this stage as a triangle, it may still be another structure. This wave count looks at the possibility that it may be a double zigzag.
If cycle wave b is a double zigzag, then current upwards movement may be part of the second zigzag in the double, labelled primary wave Y.
The target remains the same.
Within intermediate wave (C), no second wave correction may move beyond the start of its first wave below 1,205.41. However, prior to invalidation, this wave count may be discarded if price breaks below the lower edge of the black Elliott channel. If this wave count is correct, then intermediate wave (C) should not break below the Elliott channel which contains the zigzag of primary wave Y upwards.
There are now three problems with this wave count which reduce its probability in terms of Elliott wave:
1. Cycle wave b is a double zigzag, but primary wave X within the double is deep and time consuming. While this is possible, it is much more common for X waves within double zigzags to be brief and shallow.
2. Intermediate wave (B) within the zigzag of primary wave Y is a double flat correction. These are extremely rare, even rarer than running flats. The rarity of this structure must further reduce the probability of this wave count.
3. Although intermediate wave (C) should be continuing so that primary wave Y ends substantially above the end of primary wave W, the duration and depth of minor wave 2 within it now looks to be too large at the weekly time frame.
DAILY CHART
Click chart to enlarge.
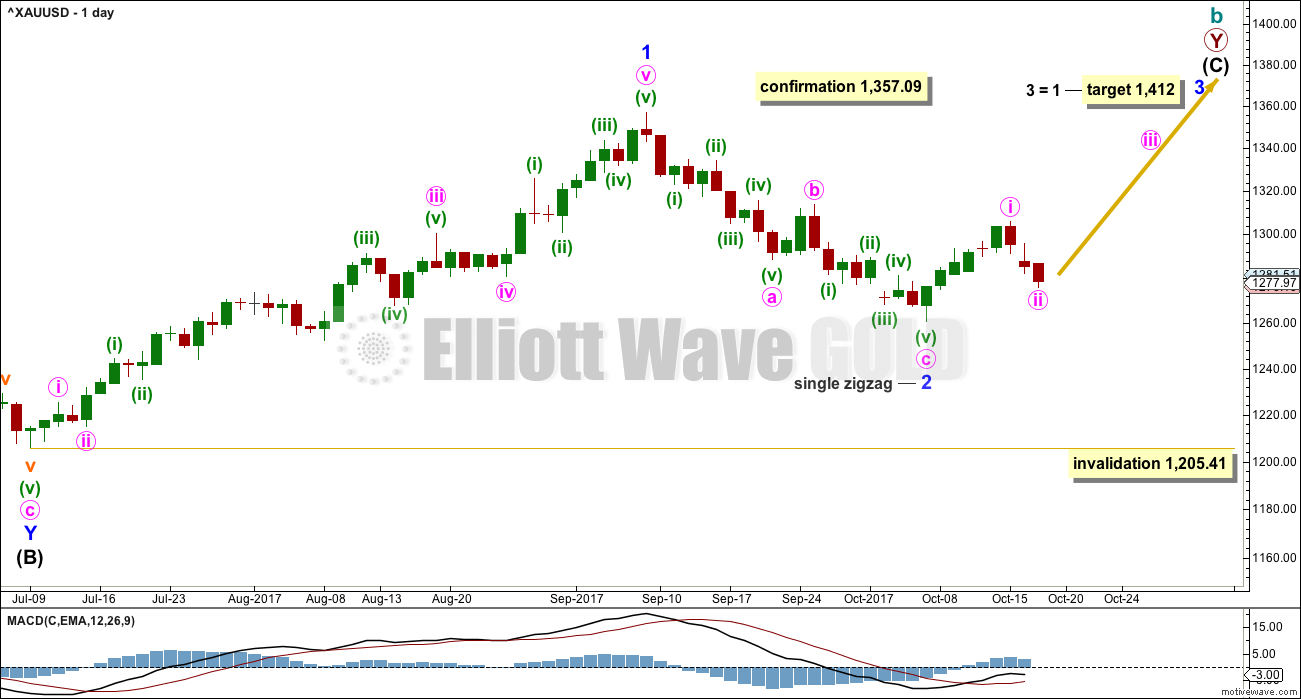
The analysis will focus on the structure of intermediate wave (C). To see details of all the bull movement for this year see daily charts here.
Intermediate wave (C) must be a five wave structure, either an impulse or an ending diagonal. It is unfolding as the more common impulse.
It is possible that minor waves 1 and now 2 may both be over. Minor wave 2 may have ended very close to the 0.618 Fibonacci ratio. If it continues lower, then minor wave 2 may not move beyond the start of minor wave 1 below 1,205.41.
Minor wave 1 lasted 44 days and minor wave 2 may have lasted 20 days, just one short of a Fibonacci 21.
It is of some concern now that minor wave 3 appears to be starting out rather slowly. This is somewhat unusual for a third wave and offers some support now to the second Elliott wave count. With StockCharts data showing a steady decline in volume as price rises, this concern is now validated.
Attention now turns to the structure of minute wave ii. At its end, minute wave ii should present an opportunity to join the current upwards trend. That opportunity may be very close now. The structure could be complete a the last low or it may need just one more slight low before it is done.
Two hourly wave counts are provided today that look at minute wave ii in two different ways. These hourly wave counts work in the same way for the second Elliott wave count, only the degree of labelling there would be one degree higher for minor wave B instead of minute wave ii.
MAIN HOURLY CHART
Click chart to enlarge.
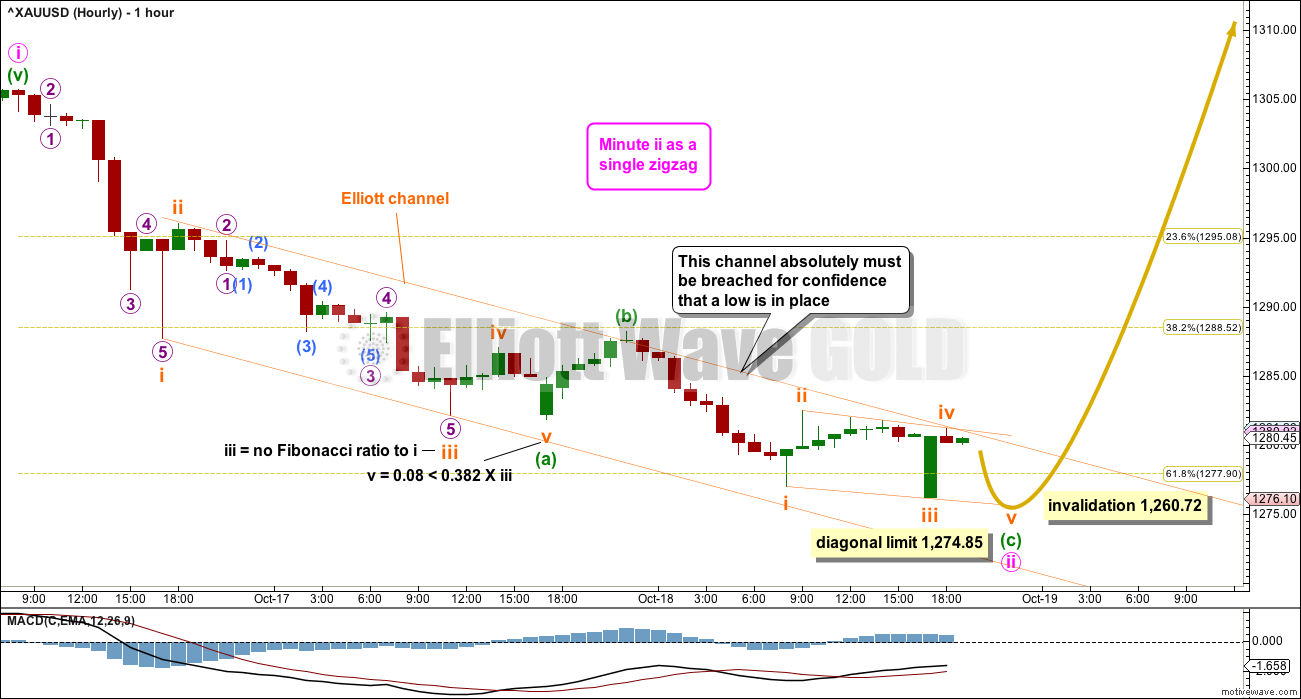
If minute wave ii is a single zigzag, then it may need another low to complete the structure. Minuette wave (c) may be an almost complete ending contracting diagonal. This structure meets all Elliott wave rules. The fifth wave of a contracting diagonal may not be longer than the third wave, so this gives a limit to subminuette wave v.
If price moves below the limit for the diagonal, then minuette wave (c) would be an impulse. A target for that to end may be about 1,264 where minuette wave (c) would reach equality in length with minuette wave (a).
While price remains within the channel, this first hourly wave count should be assumed to be correct.
If price breaks above the channel, then use the alternate hourly chart below.
ALTERNATE HOURLY CHART
Click chart to enlarge.
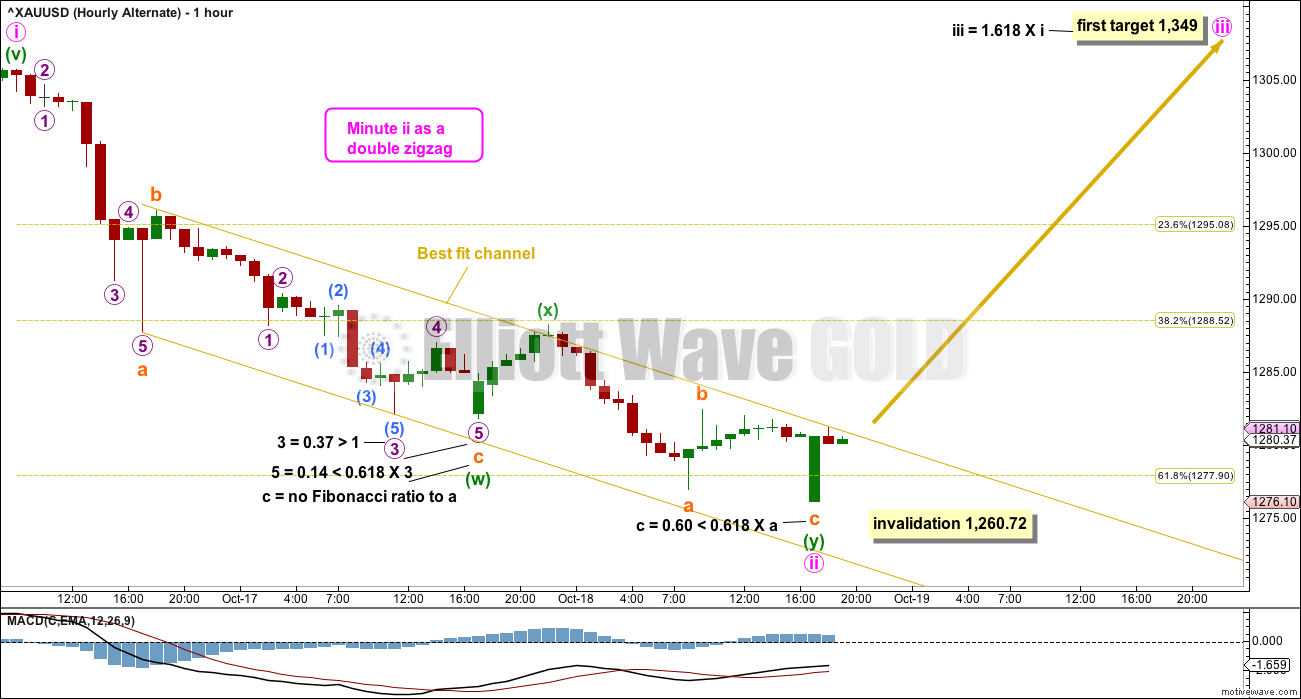
A double zigzag structure now could be complete for minute wave ii. At the daily chart level, this structure looks reasonably in proportion to minute wave i, and as it has reached now to just below the 0.618 Fibonacci ratio of minute wave i, it is entirely possible that it could be over.
A target is provided for minute wave iii, which assumes the most common Fibonacci ratio.
This wave count absolutely requires a breach of the channel by upwards (not sideways) movement for any confidence that a low is in place.
SECOND ELLIOTT WAVE COUNT
WEEKLY CHART
Click chart to enlarge.
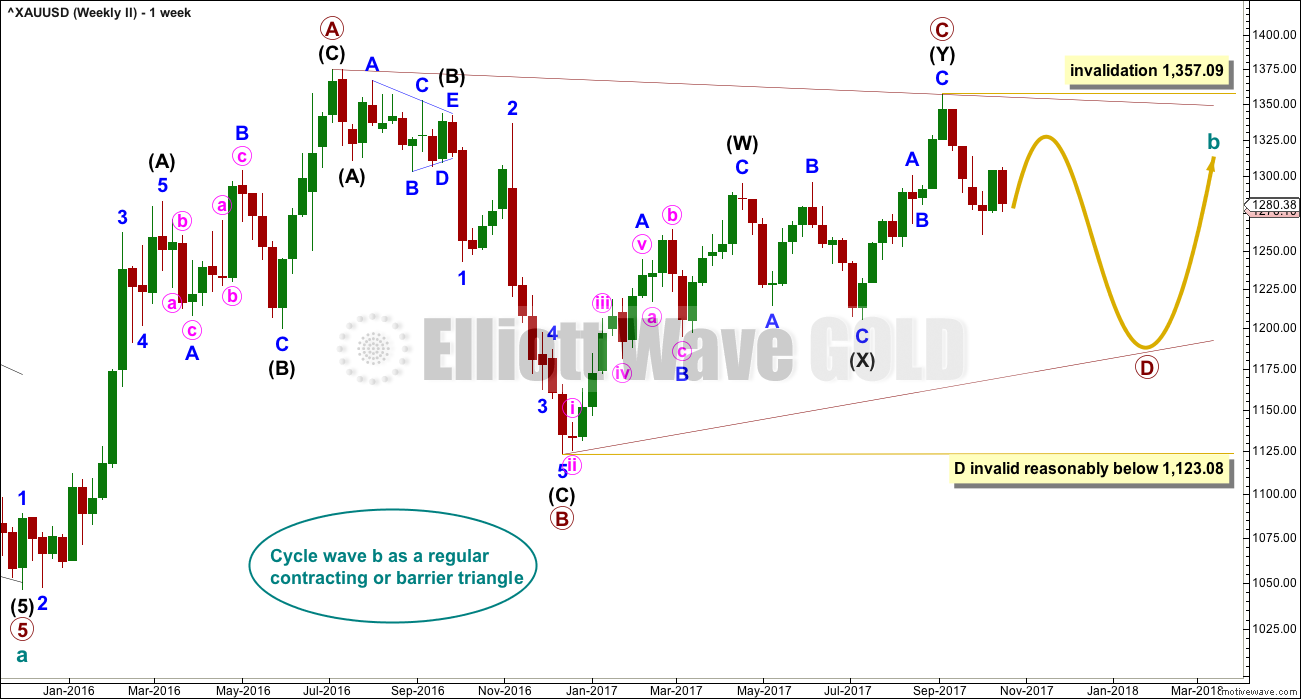
It is still possible that cycle wave b is unfolding as a regular contracting or barrier triangle.
Within a triangle, one sub-wave should be a more complicated multiple, which may be primary wave C. This is the most common sub-wave of the triangle to subdivide into a multiple.
Intermediate wave (Y) now looks like a complete zigzag at the weekly chart level.
Primary wave D of a contracting triangle may not move beyond the end of primary wave B below 1,123.08. Contracting triangles are the most common variety.
Primary wave D of a barrier triangle should end about the same level as primary wave B at 1,123.08, so that the B-D trend line remains essentially flat. This involves some subjectivity; price may move slightly below 1,123.08 and the triangle wave count may remain valid. This is the only Elliott wave rule which is not black and white.
Finally, primary wave E of a contracting or barrier triangle may not move beyond the end of primary wave C above 1,295.65. Primary wave E would most likely fall short of the A-C trend line. But if it does not end there, then it can slightly overshoot that trend line.
Primary wave A lasted 31 weeks, primary wave B lasted 23 weeks, and primary wave C lasted 38 weeks.
The A-C trend line now has too weak a slope. At this stage, this is now a problem for this wave count, the upper A-C trend line no longer has such a typical look.
Within primary wave D, no part of the zigzag may move beyond its start above 1,357.09.
DAILY CHART
Click chart to enlarge.
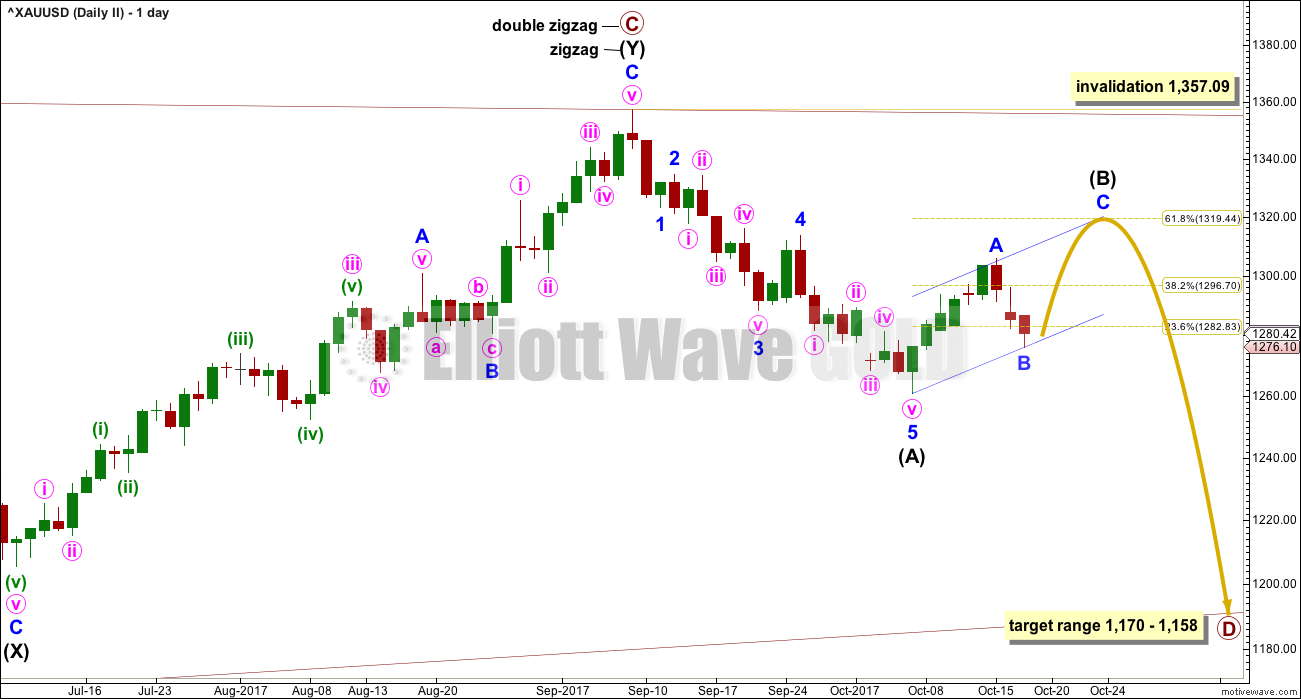
This second wave count expects the new wave down may be deeper and longer lasting than the first wave count allows for.
A common length for triangle sub-waves is from 0.8 to 0.85 the length of the prior wave. Primary wave D would reach this range from 1,170 to 1,158.
If primary wave C is correctly labelled as a double zigzag, then primary wave D must be a single zigzag.
Within the single zigzag of primary wave D, intermediate wave (A) is labelled as a complete impulse.
Intermediate wave (A) lasted 20 days, just one short of a Fibonacci 21. Intermediate wave (B) may be about the same duration, so that this wave count has good proportions, or it may be longer because B waves tend to be more complicated and time consuming.
Intermediate wave (B) may be a sharp upwards zigzag, or it may be a choppy overlapping consolidation as a flat, triangle or combination. At this stage, it looks most likely to be incomplete because an intermediate degree wave should last weeks. At its conclusion intermediate wave (B) should have an obvious three wave look to it here on the daily chart.
It now looks likely that minor wave B could be over, that intermediate wave (B) could be subdividing as a simple zigzag. The target for minor wave C would see intermediate wave (B) end close to the 0.618 Fibonacci ratio of intermediate wave (A), and price would end at the upper edge of the small blue channel.
While it is possible that minor wave B is complete as a double zigzag, it is also possible that it may continue sideways as a triangle as per the hourly chart below.
HOURLY CHART
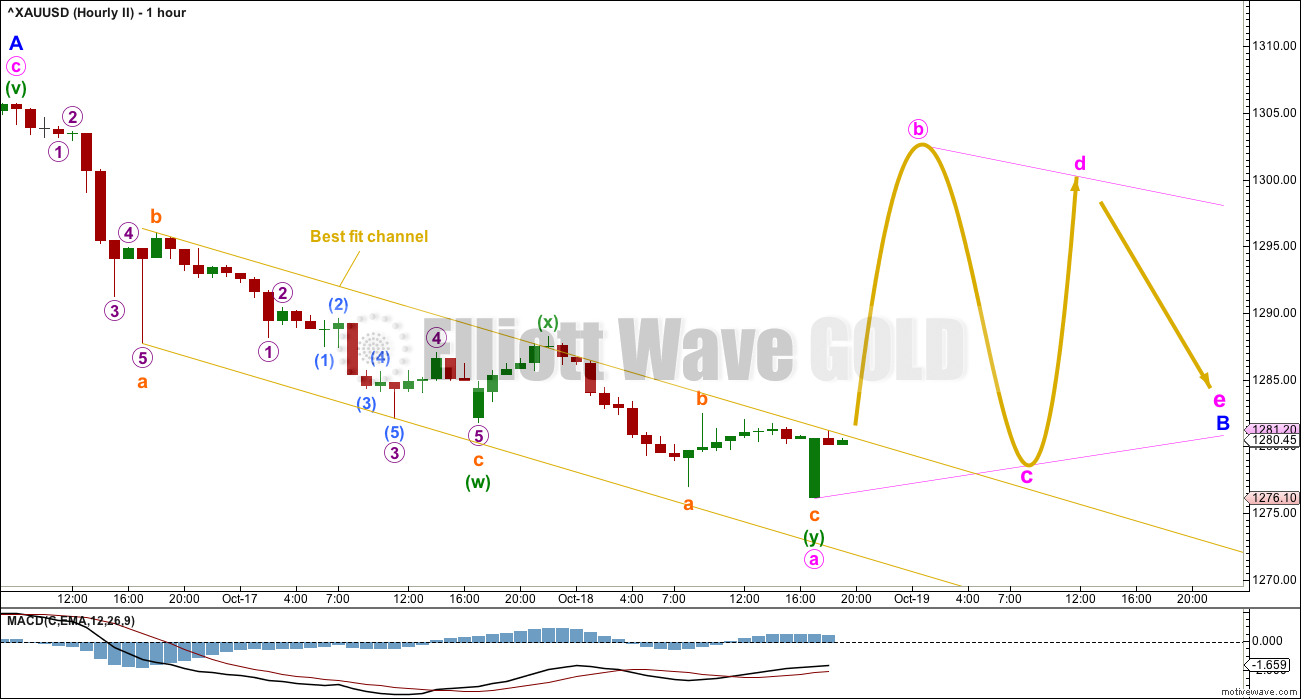
Click chart to enlarge.
While the first two hourly charts for the first Elliott wave count also work in exactly the same way for this second wave count, there is another option that only works for this second wave count.
Second waves may not subdivide as triangles, so this idea does not work for the first Elliott wave count. But B waves may subdivide as triangles.
It is possible that price may be entering a sideways, time consuming, choppy movement to last another week and possibly two.
The best fit channel is the same and price is still required to break above it before any confidence in a bounce may be had.
TECHNICAL ANALYSIS
WEEKLY CHART
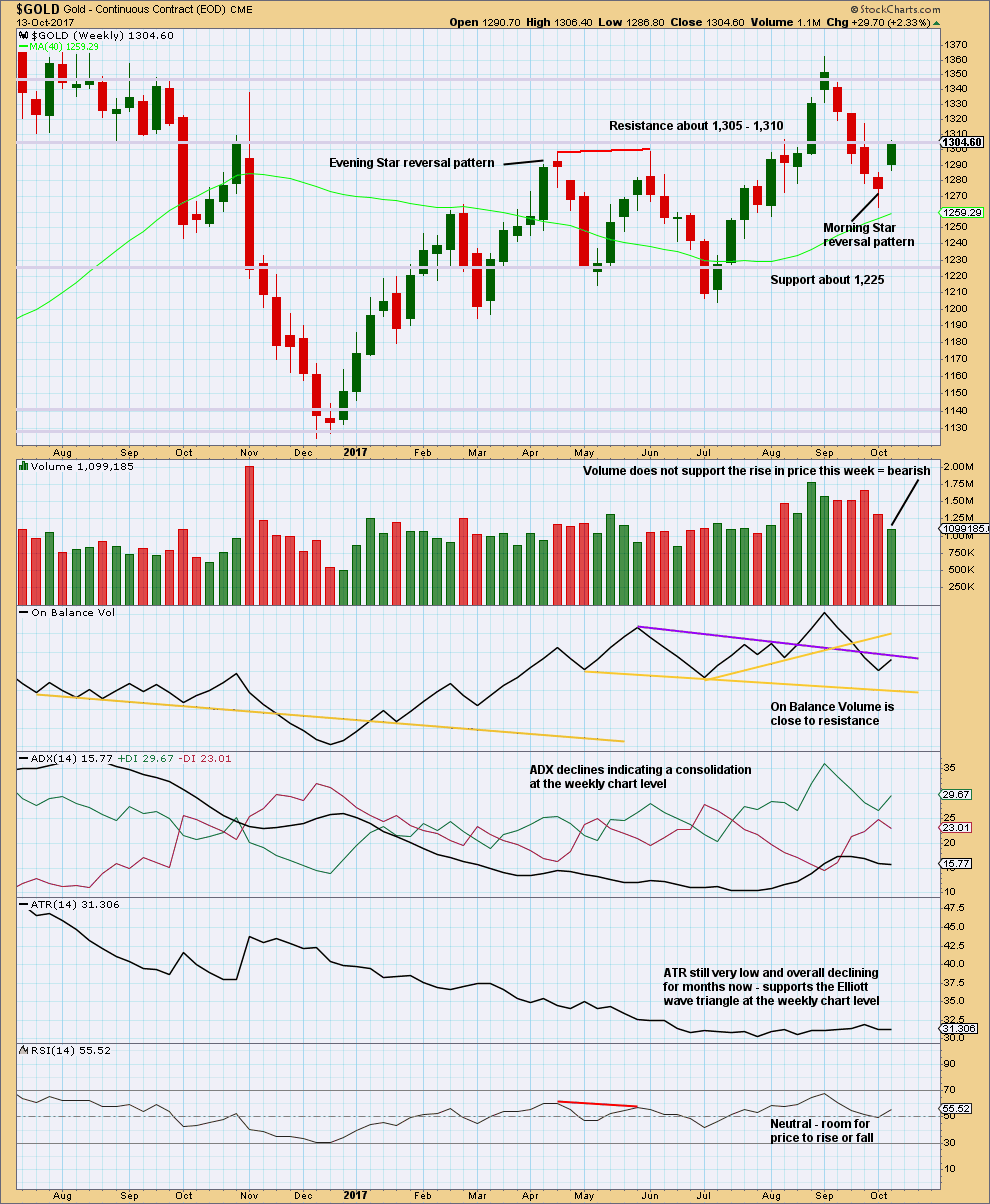
Click chart to enlarge. Chart courtesy of StockCharts.com.
This last weekly candlestick completes a Morning Star reversal pattern, which is bullish.
Without support from volume for upwards movement though, it should be suspicious. The reversal pattern may signify a new sideways trend or a short lived upwards bounce.
Resistance at On Balance Volume may halt the rise in price.
DAILY CHART
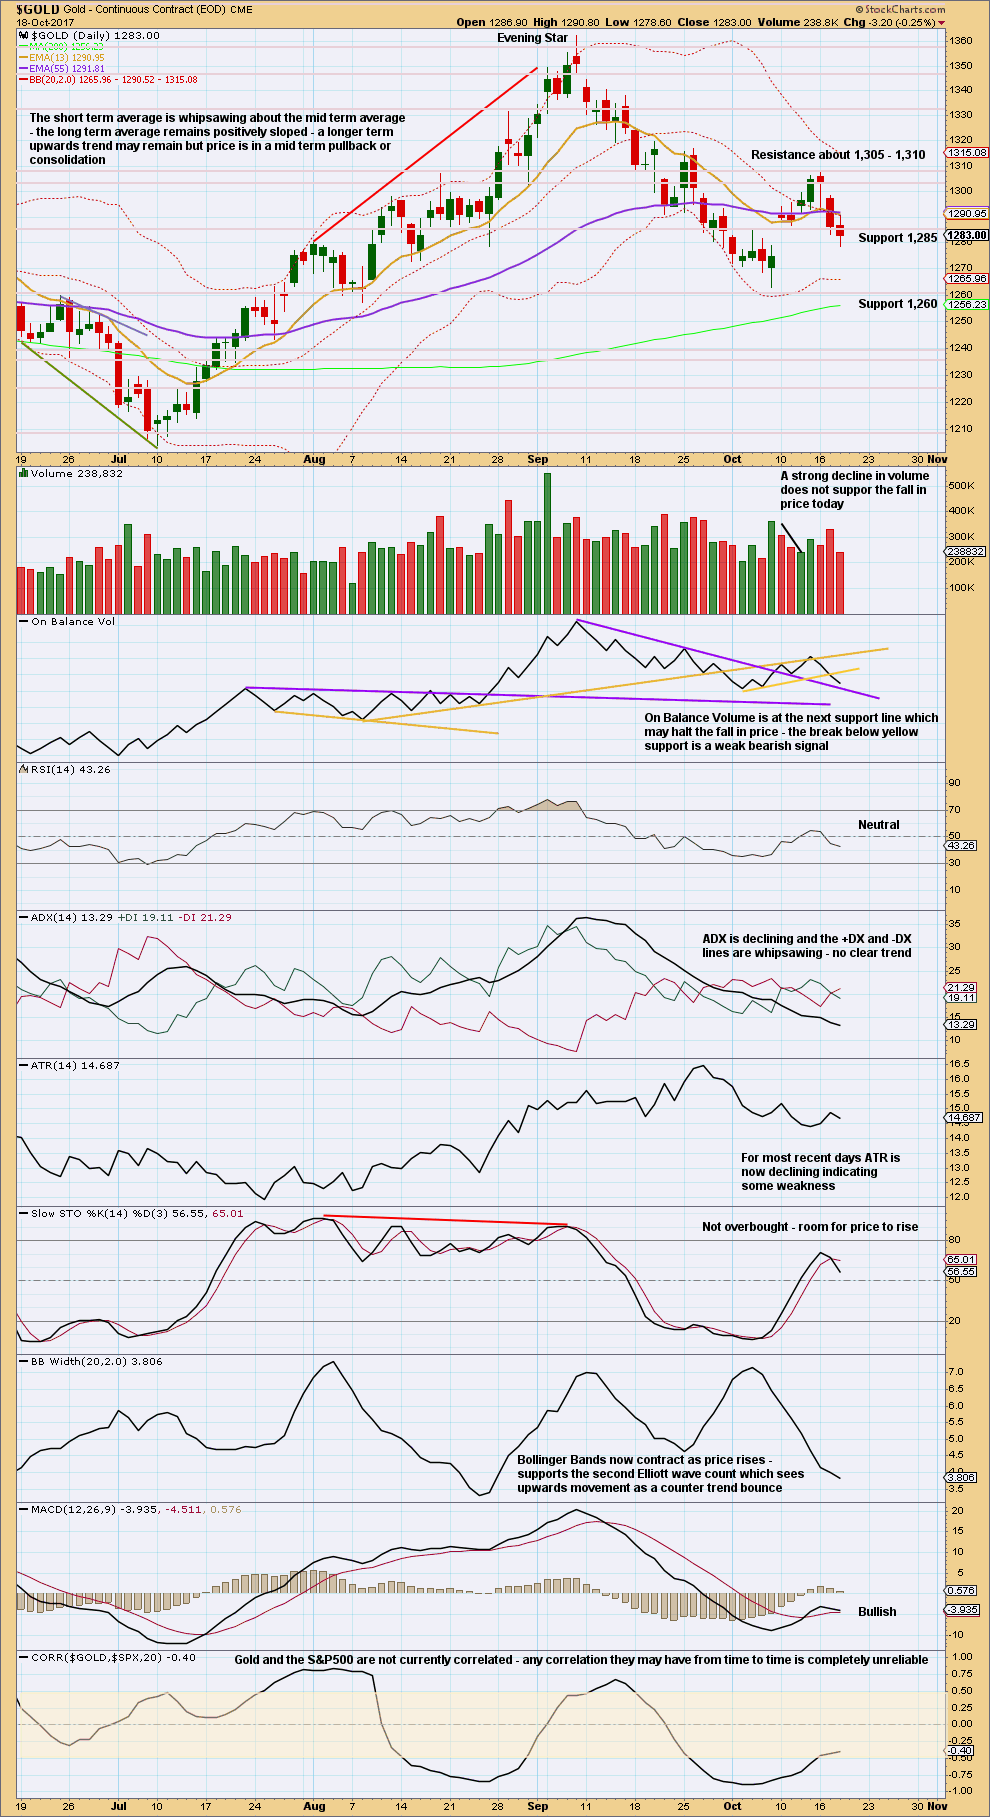
Click chart to enlarge. Chart courtesy of StockCharts.com.
Today’s Spinning Top candlestick represents indecision, a balance of bulls and bears with the bears winning today. A sharp decline in volume along with the Spinning Top looks like a low may possibly be in.
The bearish signal from On Balance Volume is weak because the yellow line is not long held, only tested twice before, and has a reasonable slope.
The purple line has stronger technical significance. This may halt the fall in price. If it is breached, that would provide a reasonable bearish signal.
GDX
DAILY CHART
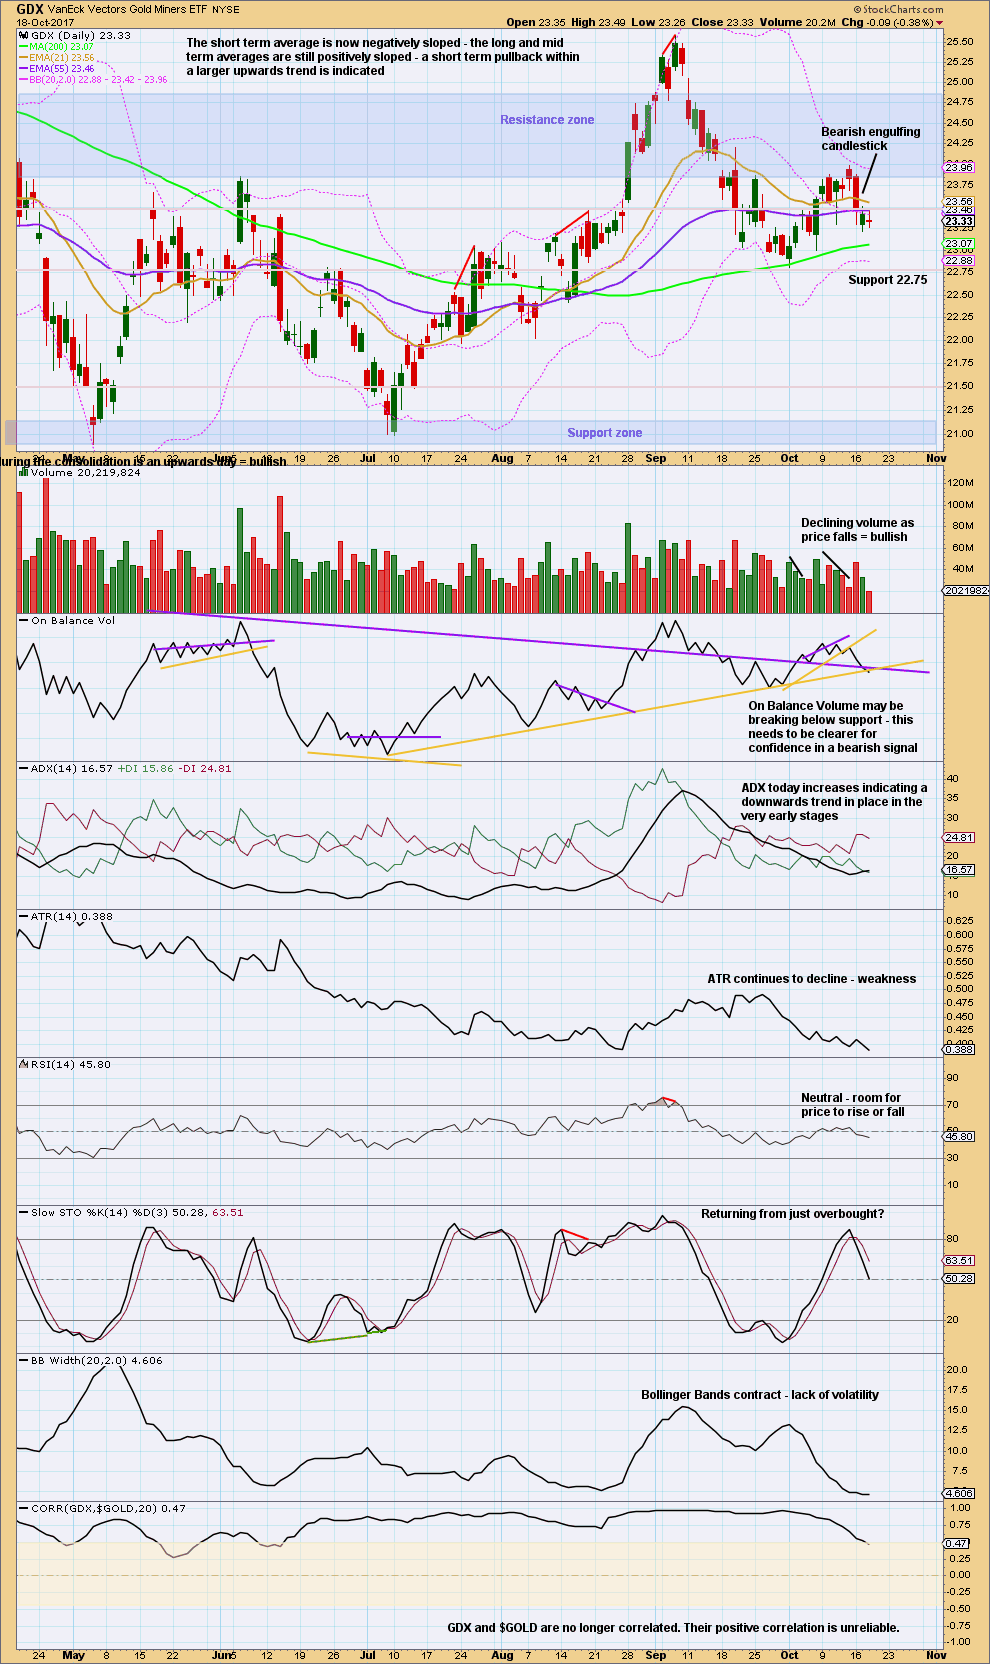
Click chart to enlarge. Chart courtesy of StockCharts.com.
A small inside day completes a doji. Like the Spinning Top on Gold, a doji here for GDX represents indecision. The balance of volume today was down and it shows a strong decline. This is good to see at lows.
Published @ 08:30 p.m. EST.
Updated hourly chart:
We have a breach of the channel about prior downwards movement which adds confidence to a trend change at least for the short term.
Members who took trading advice in this analysis should now have profitable positions. Depending upon your particular trading strategy you may take profits and try to re-enter, or hold on and pull stops up to just below 1,276.10 now.
Tip: when setting stops allow a little room for widening broker spreads in volatile times. I always check the normal spread, multiply it X 3, and set my stop that far beyond the invalidation point.
Hi Lara,
I am not sure if I am understanding your tip. Are you saying that if you enter within a normal spread, one should multiply 3X and place stop at that point beyond invalidation point , so that as ie., gold becomes more volatile and the broker widens spreads, one’s stop will not get hit? So one should also record what the spread was when they enter, not just the entry point?
Thank you…Melanie
Exactly.
I notice that on news releases (as an example) then price whipsaws violently, that the broker spread widens considerably. In order for a position to not be stopped out when this happens I have found it best to set the stop a little beyond the point you’re using to set a stop.
Too many times I have had positions stopped out even though price did not move beyond my stop, but my broker spread meant my stop was hit. Only to then see price turn and go in the expected direction after the whipsaw.
I don’t record what the spread was when I entered. I only record my reasoning for where I set my stop. My broker spread is almost always the same and quite small, but it will widen when the market is volatile.
Patiently watching GSR top HnS in hourly period. Now has another inv Hns.
Once GSR drops below 74 gold/silver will rise as per Lara’s forecast.
Need the breakdown below NL.
Next target still 68.
https://www.tradingview.com/chart/ufduMUCA/
A nice expanded flat in subminuette 2.
Just wait till it drops in the c wave to 1282.81 – 1280.78 before going long.
I think the second Daily and hourly are in play i.e. the triangle
No totally convinced the down movement in gold is over…..
Watching US10Y and DXY.
Not totally that is…
Likewise. I’m still bearish. At least until, at a minimum, gold closes above the 10 dma. Until then this could be a big wave 2 or 1212 before a very big wave 3 down
Gold looks a little spunky tonight. A channel break looks like a bottom is in for now at minimum.
Look for a backtest of the breakout before a move higher.
IMO with the Gold price drop that just occurred, 1306 has probably been signaled as an interim top. Gold price would now need to get to and hold above 1287-88 to motor on further. Does not look likely for this to happen just yet. Expecting Silver to pullback further which will probably take Gold price down with it…. Lets see.
I always find it strange when Barchart has these quick spikes that don’t appear on other data feeds…
I don’t trust those spikes either.
BarChart is getting data from COMEX I think.
Lara, looks like you may have the Daily II chart shown on the First Count as well as the 2nd (triangle) count.
Oops! thank you Dreamer, both Cesar and I missed that! Fixed now.