
Downwards movement continues as both Elliott wave counts expected. The target has not yet been met for the first wave count.
Summary: The bigger picture sees a pullback continue here to about 1,261. It may be as low as 1,170 – 1,158.
A bearish signal today from On Balance Volume supports downwards movement, which is nearing extreme.
Always trade with stops and invest only 1-5% of equity on any one trade.
New updates to this analysis are in bold.
Last monthly charts for the main wave count are here, another monthly alternate is here, and video is here.
Grand SuperCycle analysis is here.
The wave counts will be labelled first and second. Classic technical analysis will be used to determine which wave count looks to be more likely.
FIRST ELLIOTT WAVE COUNT
WEEKLY CHART
Click chart to enlarge.
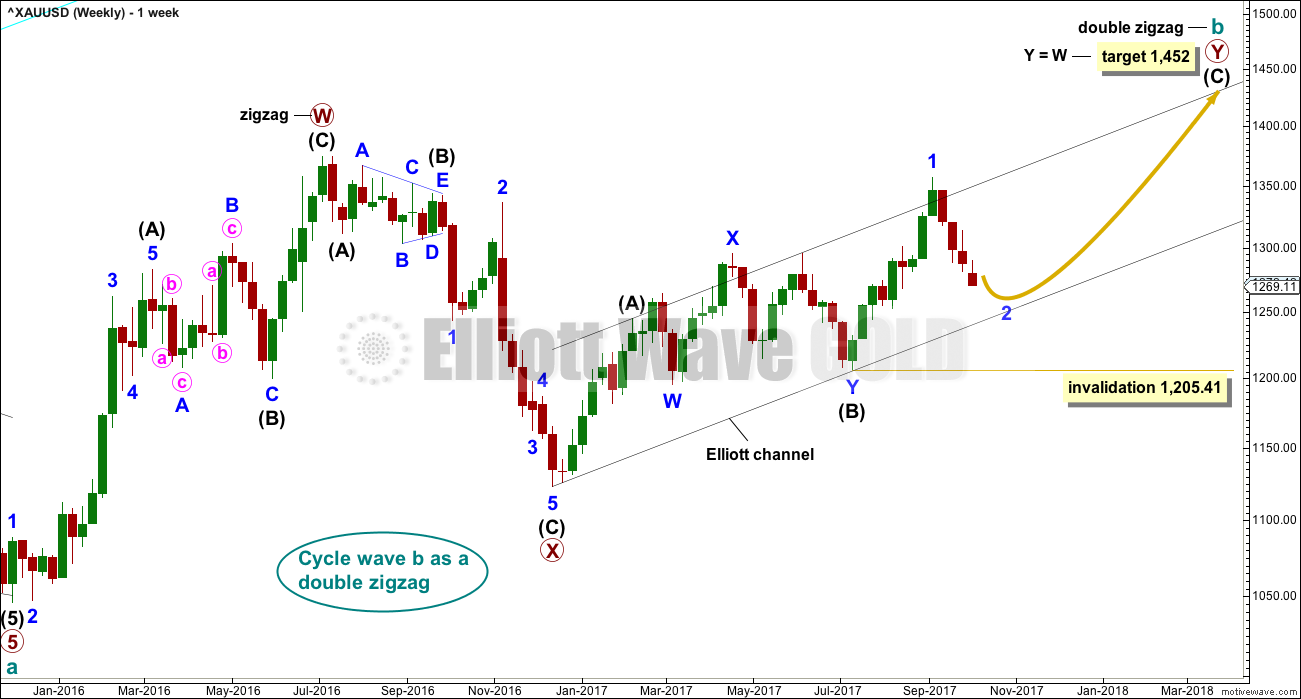
There are more than 23 possible corrective structures that B waves may take, and although cycle wave b still fits well at this stage as a triangle, it may still be another structure. This wave count looks at the possibility that it may be a double zigzag.
If cycle wave b is a double zigzag, then current upwards movement may be part of the second zigzag in the double, labelled primary wave Y.
The target remains the same.
Within intermediate wave (C), no second wave correction may move beyond the start of its first wave below 1,205.41. However, prior to invalidation, this wave count may be discarded if price breaks below the lower edge of the black Elliott channel. If this wave count is correct, then intermediate wave (C) should not break below the Elliott channel which contains the zigzag of primary wave Y upwards.
There are two problems with this wave count which reduce its probability in terms of Elliott wave:
1. Cycle wave b is a double zigzag, but primary wave X within the double is deep and time consuming. While this is possible, it is much more common for X waves within double zigzags to be brief and shallow.
2. Intermediate wave (B) within the zigzag of primary wave Y is a double flat correction. These are extremely rare, even rarer than running flats. The rarity of this structure must further reduce the probability of this wave count.
DAILY CHART
Click chart to enlarge.
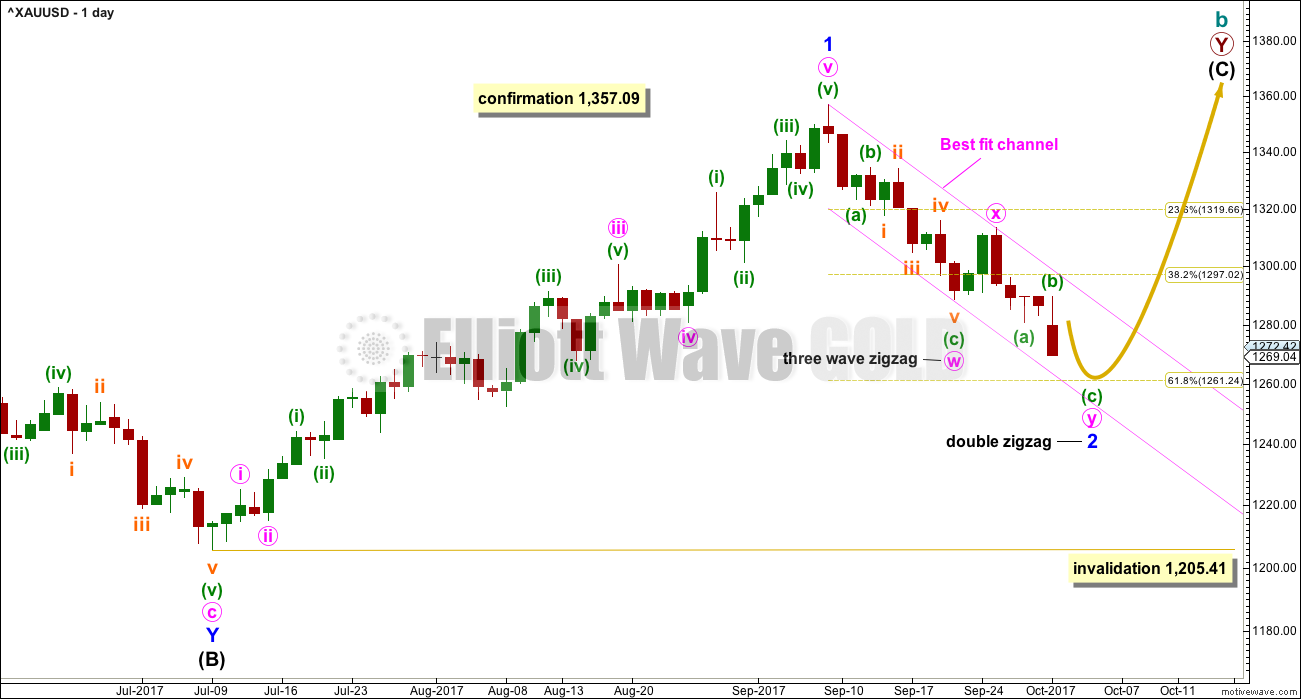
The analysis will focus on the structure of intermediate wave (C). To see details of all the bull movement for this year see daily charts here.
Intermediate wave (C) must be a five wave structure, either an impulse or an ending diagonal. It is unfolding as the more common impulse.
It is possible that minor wave 1 may have been over at the last high and the current pullback may be minor wave 2. Minor wave 2 may not move beyond the start of minor wave 1 below 1,205.41.
Minor wave 2 is not over and may continue lower to reach a more normal depth of about 0.618 the length of minor wave 1, about 1,261. This would also see minor wave 2 have a better proportion to minor wave 1 in terms of duration; minor wave 1 lasted 44 days and so far minor wave 2 has lasted only 16 days. If it continues now for another 5 days, it may total a Fibonacci 21.
HOURLY CHART
Click chart to enlarge.
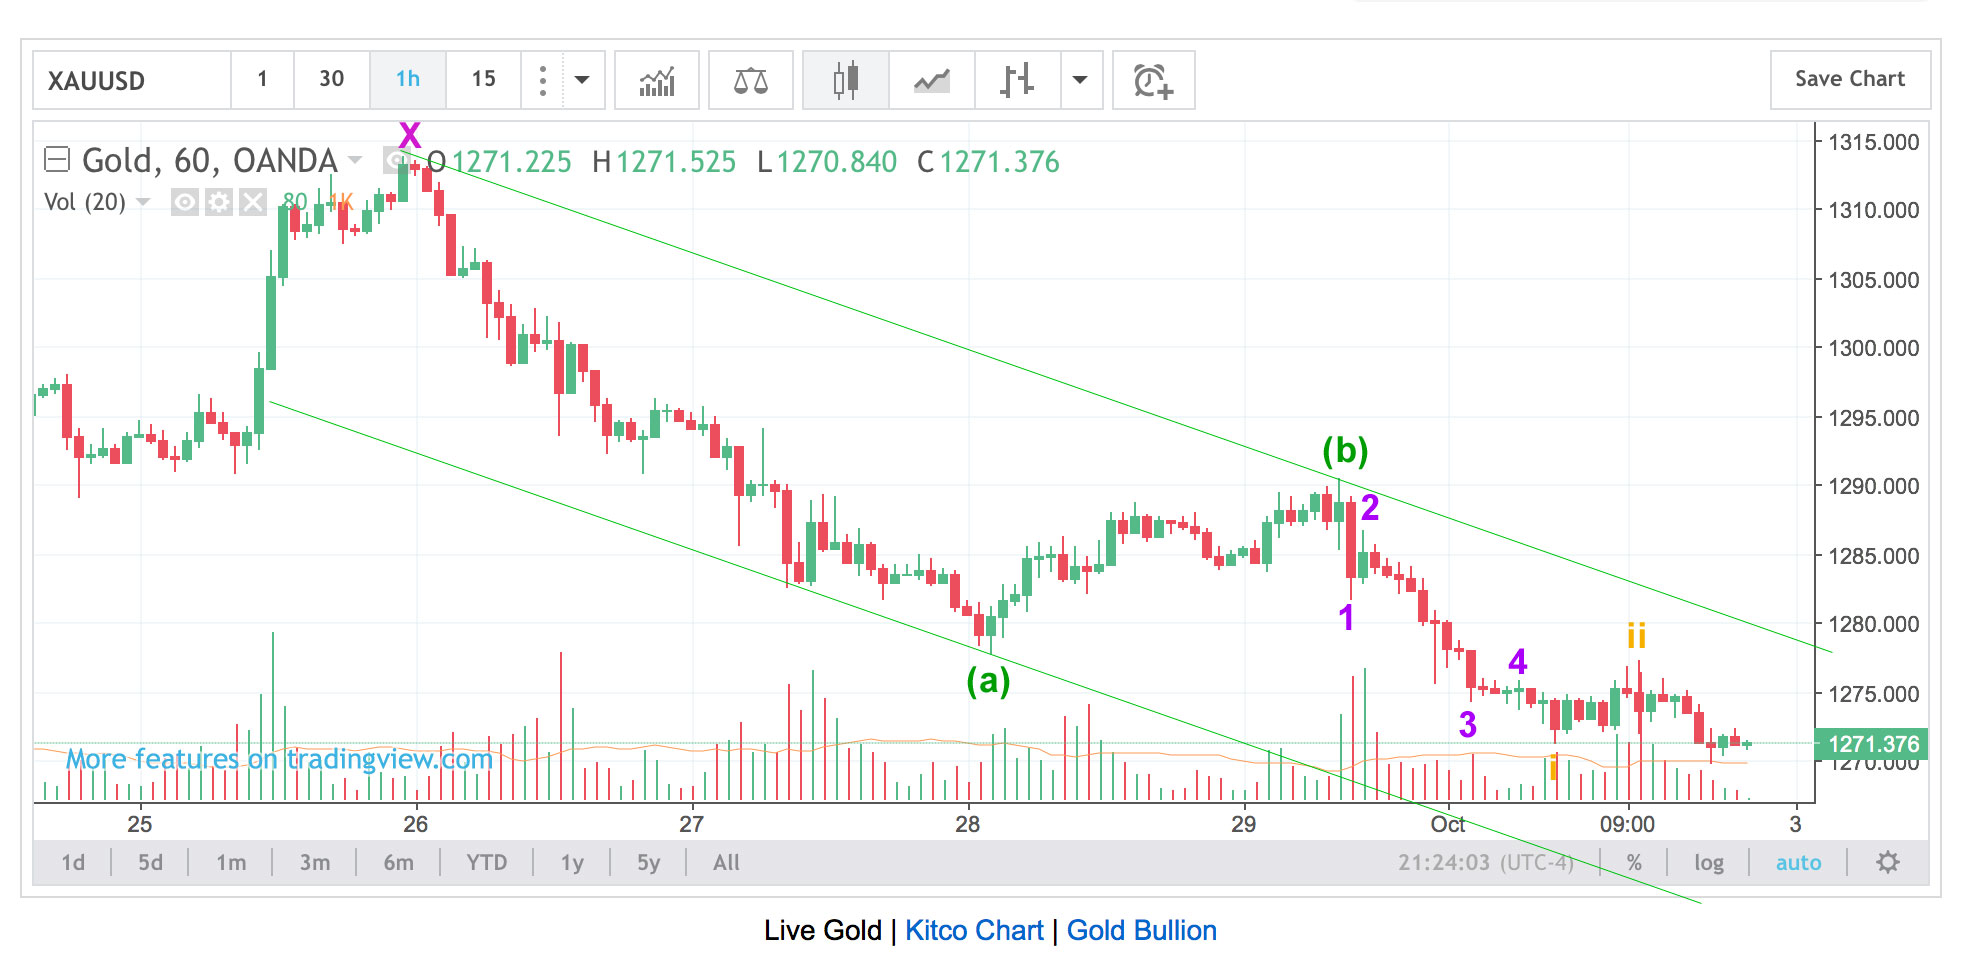
BarChart’s data for Gold continues to be inaccurate now for the last three sessions. Therefore, I will use PMBull’s data, with Photoshop (for the labelling), at the hourly chart level.
A 5-3-5 down looks to be unfolding. Both Elliott wave counts will label it minuette (a) – (b) – (c). This hourly chart works in the same way for both wave counts at this stage.
From the high labelled minuette wave (b) to the low today, I cannot see a completed five wave structure. A five down is complete to the low labelled subminuette wave i, but another subsequent new low below that point indicates downwards movement is not yet over.
Some increase in downwards momentum may be expected for this wave count if the labelling is correct.
Using PMBull data, minuette wave (a) is 35.67 in length and minuette wave (b) ends at 1,290.50. A target calculation using a ratio of equality between minuette waves (a) and (c) would see minuette wave (c) end about 1,255.
This may widen the target for minor wave 2 to end to 1,261 to 1,255.
SECOND ELLIOTT WAVE COUNT
WEEKLY CHART
Click chart to enlarge.
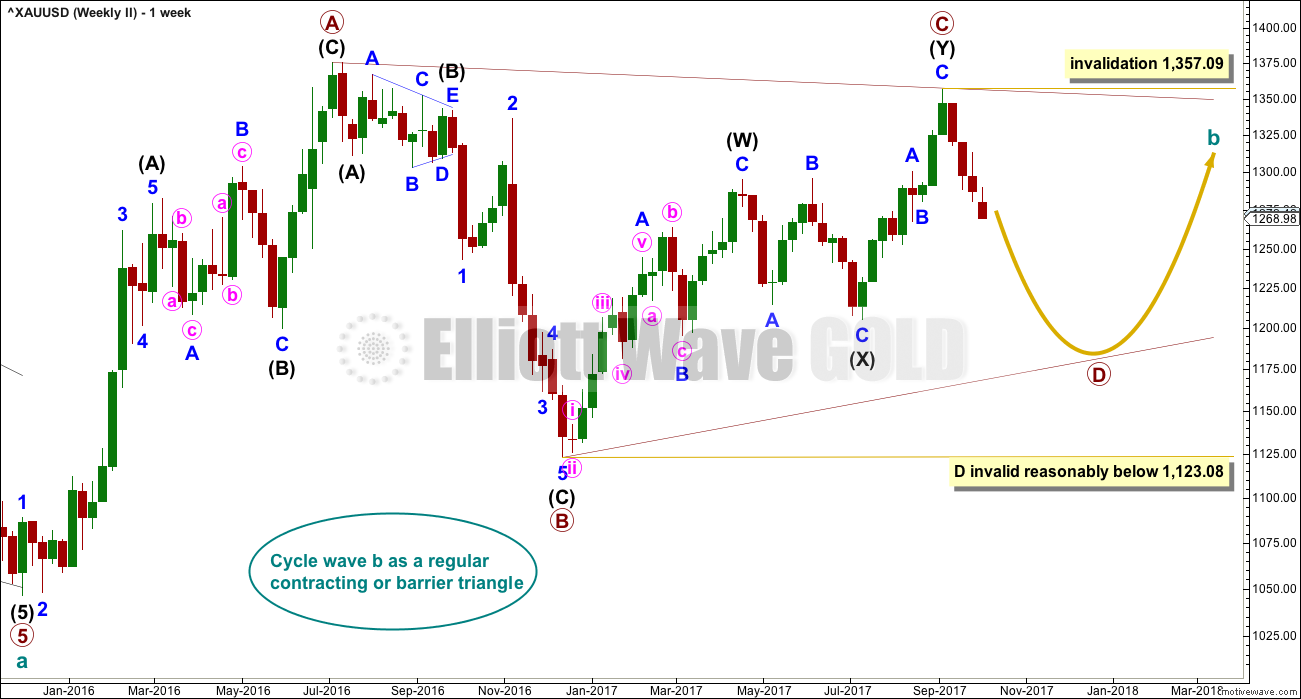
It is still possible that cycle wave b is unfolding as a regular contracting triangle.
Within a triangle, one sub-wave should be a more complicated multiple, which may be primary wave C. This is the most common sub-wave of the triangle to subdivide into a multiple.
Intermediate wave (Y) now looks like a complete zigzag at the weekly chart level.
Primary wave D of a contracting triangle may not move beyond the end of primary wave B below 1,123.08. Contracting triangles are the most common variety.
Primary wave D of a barrier triangle should end about the same level as primary wave B at 1,123.08, so that the B-D trend line remains essentially flat. This involves some subjectivity; price may move slightly below 1,123.08 and the triangle wave count may remain valid. This is the only Elliott wave rule which is not black and white.
Finally, primary wave E of a contracting or barrier triangle may not move beyond the end of primary wave C above 1,295.65. Primary wave E would most likely fall short of the A-C trend line. But if it does not end there, then it can slightly overshoot that trend line.
Primary wave A lasted 31 weeks, primary wave B lasted 23 weeks, and primary wave C lasted 38 weeks.
The A-C trend line now has too weak a slope. At this stage, this is now a problem for this wave count, the upper A-C trend line no longer has such a typical look.
Within primary wave D, no part of the zigzag may move beyond its start above 1,357.09.
DAILY CHART
Click chart to enlarge.
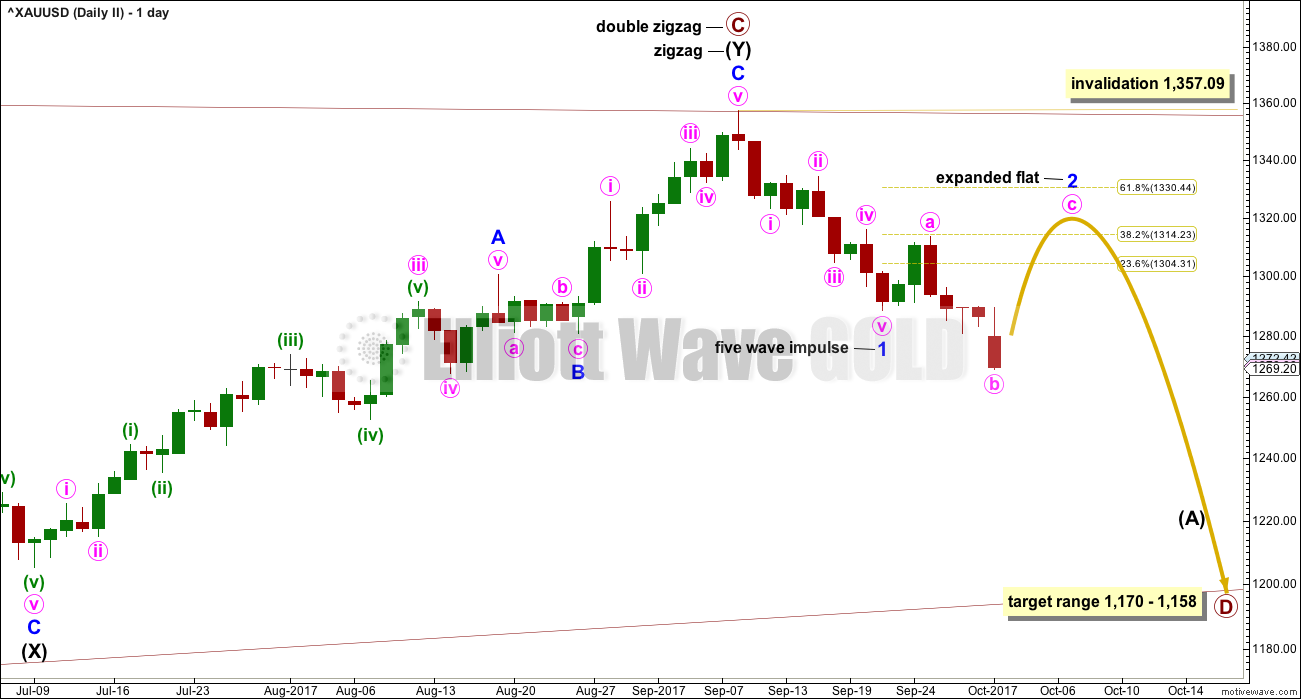
This second wave count expects the new wave down may be deeper and longer lasting than the first wave count allows for.
A common length for triangle sub-waves is from 0.8 to 0.85 the length of the prior wave. Primary wave D would reach this range from 1,170 to 1,158.
If primary wave C is correctly labelled as a double zigzag, then primary wave D must be a single zigzag.
Within the single zigzag of primary wave D, intermediate wave (A) is labelled as an incomplete impulse.
Within intermediate wave (A), minor wave 1 will fit as a five wave impulse. While it is possible that minor wave 2 could have been over at the high for the 25th of September, it would be remarkably brief and shallow; the proportions between minor waves 1 and 2 would be very poor.
It is still more likely that minor wave 2 is continuing further as an expanded flat correction. Expanded flats are very common structures. The most common length for their B waves is from 1 to 1.38 times the length of their A waves. Here, minute wave b is now a 1.78 length to minute wave a. This is longer than the most common length but still within allowable limits of up to 2 times the length of minute wave a.
If price continues lower to 1,263 or below, then minute wave b would reach 2 times the length of minute wave a. At that stage, the idea of an expanded flat correction would be discarded based upon a very low probability.
Only one hourly chart will be provided today as both wave counts see subdivisions of recent movement in the same way.
TECHNICAL ANALYSIS
WEEKLY CHART
Click chart to enlarge. Chart courtesy of StockCharts.com.
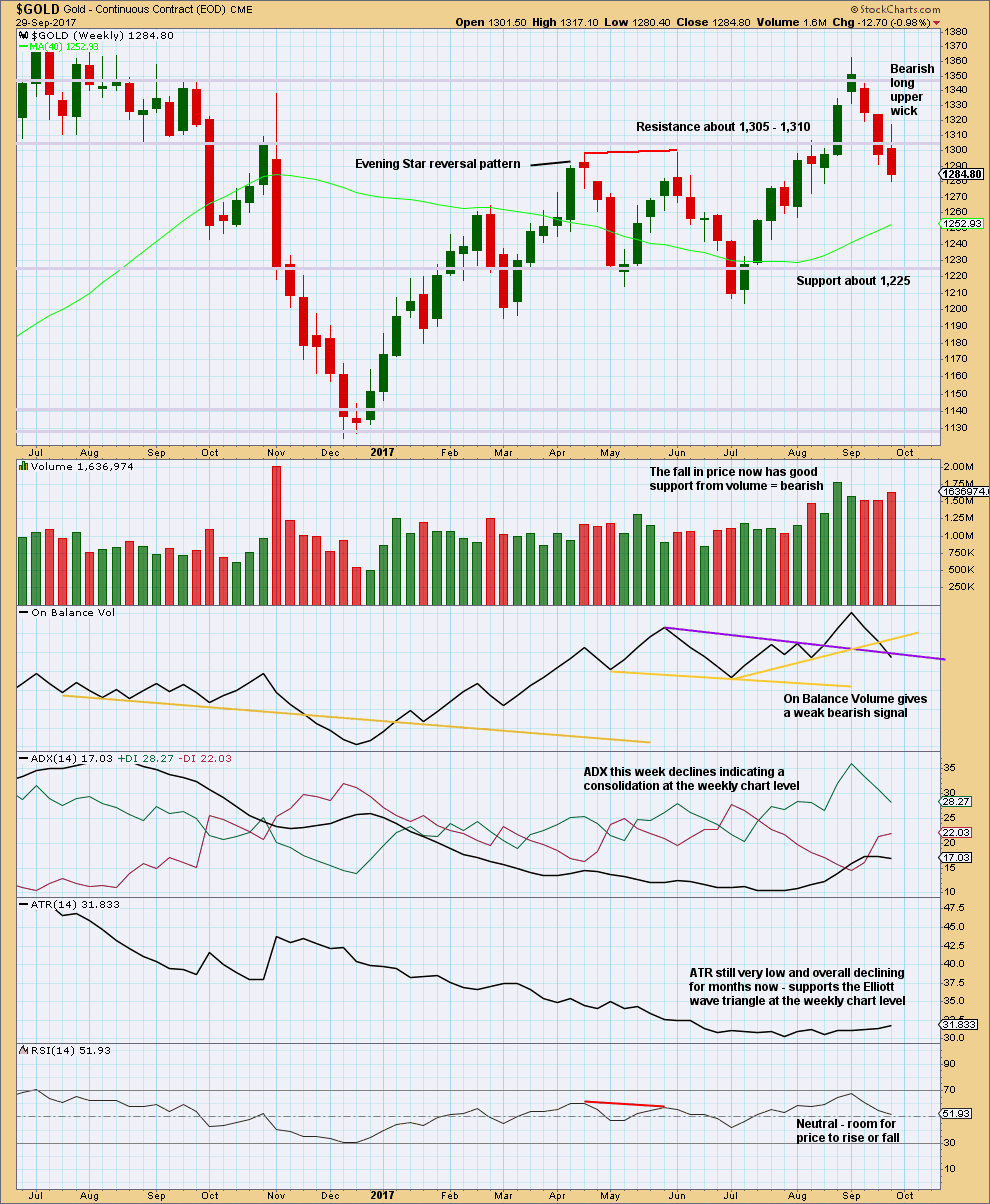
Support of the Elliott wave counts which expect overall more downwards movement this week comes from an increase in volume last week for downwards movement, a bearish upper candlestick wick, and a weak bearish signal now from On Balance Volume.
These signals cannot tell us how far price may fall though. Support and resistance may be used as a guide for this. Next strong support for price is about 1,225.
DAILY CHART
Click chart to enlarge. Chart courtesy of StockCharts.com.
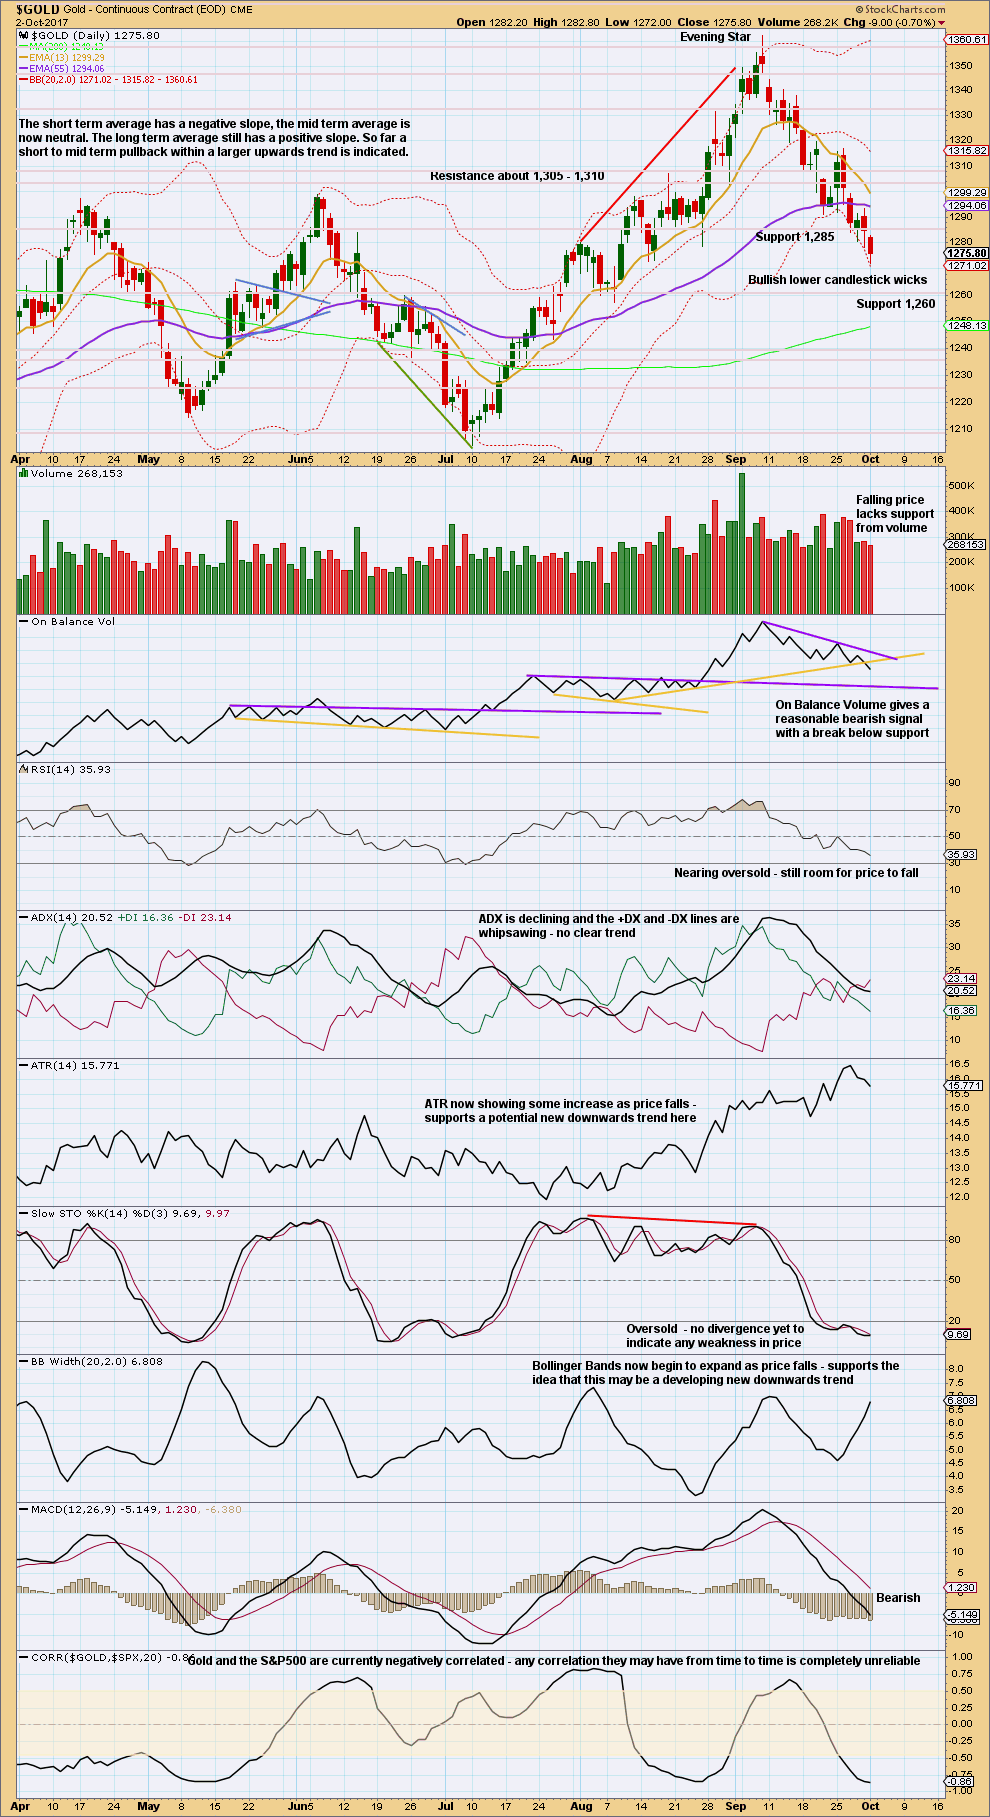
Bearish: A reasonable signal today from On Balance Volume, ATR increasing, Bollinger Bands widening and MACD.
Neutral: ADX and RSI.
Bullish: Stochastics is now extreme (but this is not very bullish because it can remain extreme for longer and does not yet exhibit divergence to indicate any weakness), falling volume, and long lower candlestick wicks.
Overall, there are now some signs of weakness but not yet enough to expect a low is in place. Assume the trend remains the same until proven otherwise. The trend is clearly downwards. Wait for RSI to move into oversold or for Stochastics to develop strong divergence with price at lows while it is oversold.
GDX
DAILY CHART
Click chart to enlarge. Chart courtesy of StockCharts.com.
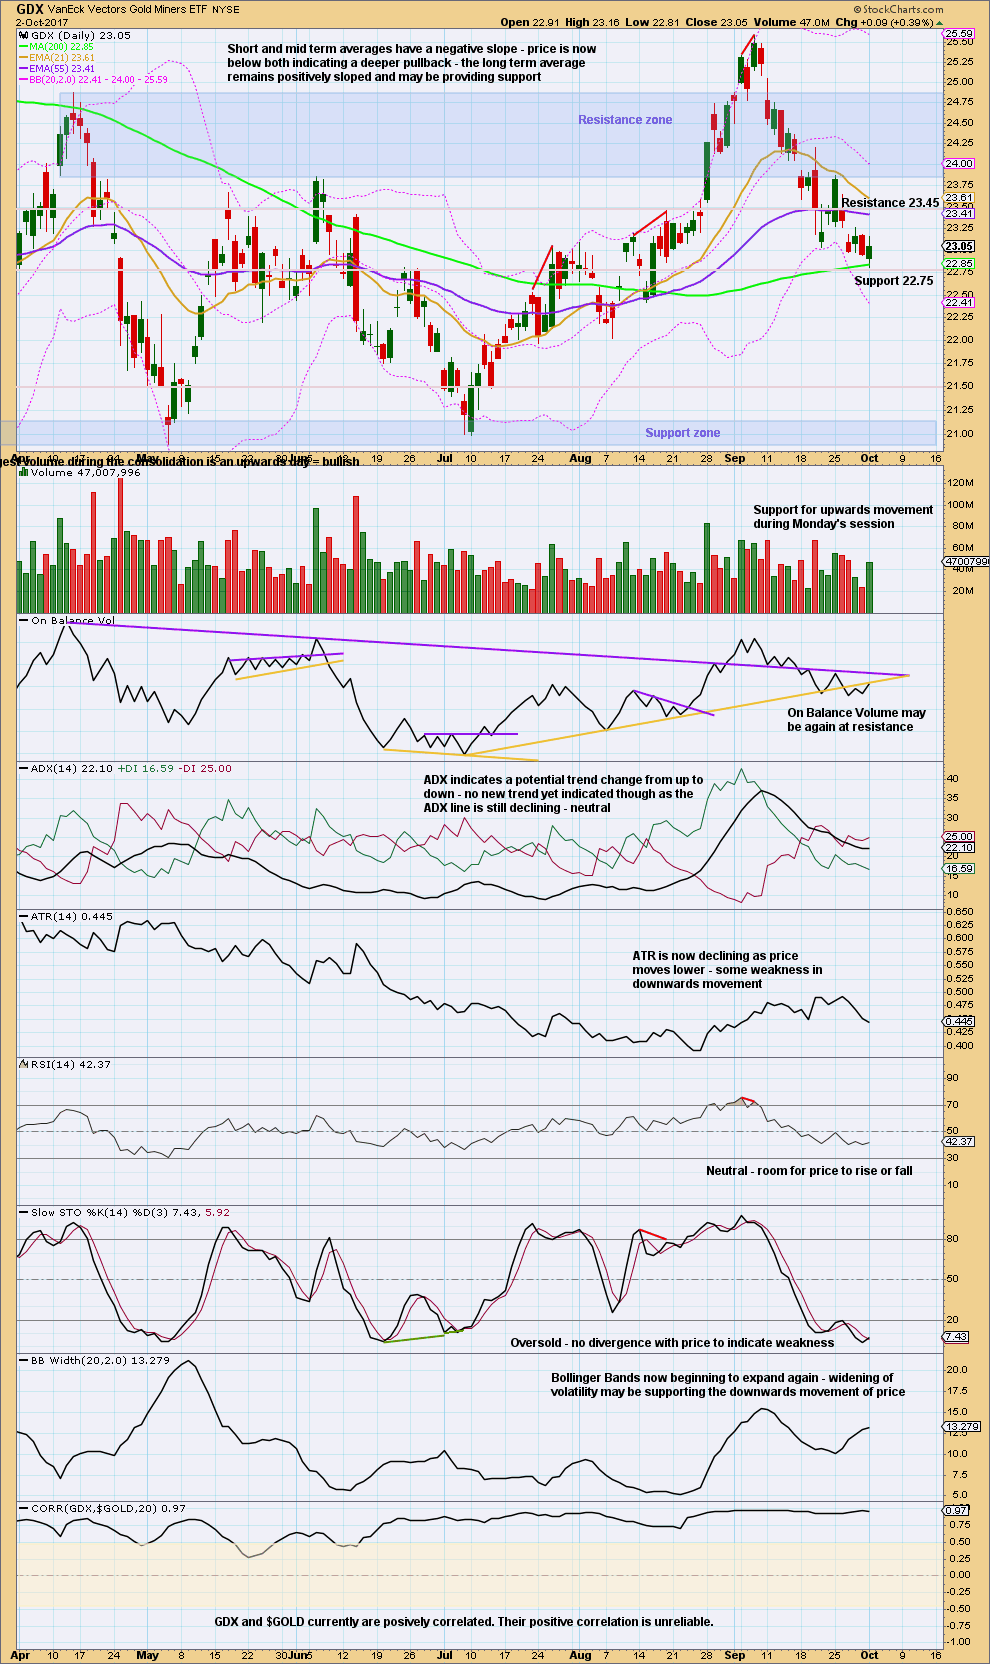
GDX bounced up strongly off support about 22.75. Although Monday completed a lower low and a lower high, the balance of volume was downwards and it shows a strong increase. It looks like the bounce is not done and may continue higher. Resistance is about 23.45.
The yellow line on On Balance Volume is slightly adjusted today to be as conservative as possible. It may offer some resistance here. If On Balance Volume breaks above this line, it would be weakened and no longer very useful; it would have to be redrawn.
With Stochastics not yet exhibiting weakness and RSI not yet oversold, there is still room for price to fall here.
Published @ 11:03 p.m. EST.
GDX had a nice up day today, breaking the downtrend line, although volume was weak. Support was found at the 200MA and the cloud. The cloud looks to support higher prices.
MACD is at support for a possible turning point.
OBV broke above the short term downtrend line and hit resistance at the longer term downtrend line.
GDX is trying to bottom.
I’ve noticed for GDX the short term volume profile isn’t always as helpful as it can be for Gold. It can start out a move weak, then gather strength. So when it starts the weakness indicates a correction against a trend, and not a new trend.
Lara, while gold broke short term OBV uptrend support yesterday, today it appears to be at longer term uptrend support. With the lower volume today not supporting the move down, maybe a bounce or new uptrend is possible?
It certainly is possible. The structure could be complete.
I’m working on a main and alternate.
BarChart have partially fixed the bug now. Price is now behaving normally. But the hourly chart bars up to 2nd October are still wrong. That’ll be fixed in the next 24 hours they tell me.
Just a brief daily update.
Gold remains in a bearish trend. This pullback is corrective. Technically we should soon see a reversal to the upside. But, I have not seen a reversal signal yet.
The daily Ichimoku chart shows that gold price has dropped below both the tenkan-sen and the kijun-sen, and has broken below the top cloud boundary support. Gold price also lies below the 50-day MA. But, we are not in bear territory yet; gold has not dropped below the bottom cloud boundary support, nor the 200-day MA. With the 5-day RSI weakening but not making new lows as price does, the time for a strong bounce and the resumption of the uptrend ought to be near.
Currently, the support levels for the drop are around 1256 (bottom cloud boundary) and 1248.13 (200 day MA).
Not too sure if we will get a reversal to the upside just yet. Gold price is struggling to get to or past 1273. CCI on the weekly has broken below zero (0) suggests initiating shorts; 5dma looks to be heading for an eventual drop below 100dma which could cause Gold price to slump and dump. 50% retrace of 1357/1123 would not be a bad place for Gold price to go once a break below 1260 occurs! Just saying…. lol. Thank you Alan for your valuable updates.
Yes, thank you very much Alan for your most valuable updates.
It is always nice to see when your conclusions agree with mine.
Yes, Gold is in a down trend, but it’s a pullback within a larger upwards trend.
Until proven otherwise that is.