
Downwards movement continued as both Elliott wave counts expected.
Volume analysis will be used to indicate which of three hourly Elliott wave counts looks most likely.
Summary: Assume the trend remains down while price remains below 1,289.67.
A new high above 1,289.67 (the high for 2nd of October) by any amount at any time frame would indicate more upwards movement. At that stage, use the target at 1,330 – 1,334 in the first instance.
If upwards movement shows reasonable strength with support from volume, then it may go as high as 1,420, but that would require a new high above 1,357.09 for reasonable confidence.
Always trade with stops and invest only 1-5% of equity on any one trade.
New updates to this analysis are in bold.
Last monthly charts for the main wave count are here, another monthly alternate is here, and video is here.
Grand SuperCycle analysis is here.
The wave counts will be labelled first and second. Classic technical analysis will be used to determine which wave count looks to be more likely.
FIRST ELLIOTT WAVE COUNT
WEEKLY CHART
Click chart to enlarge.
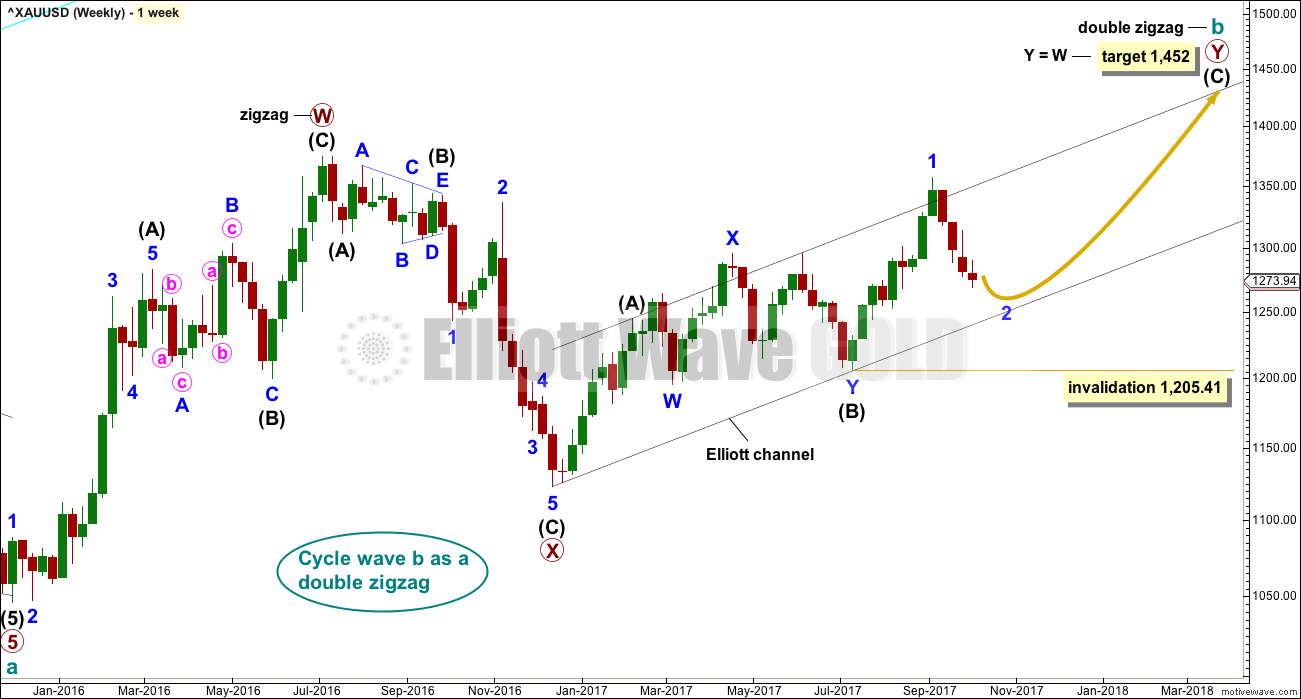
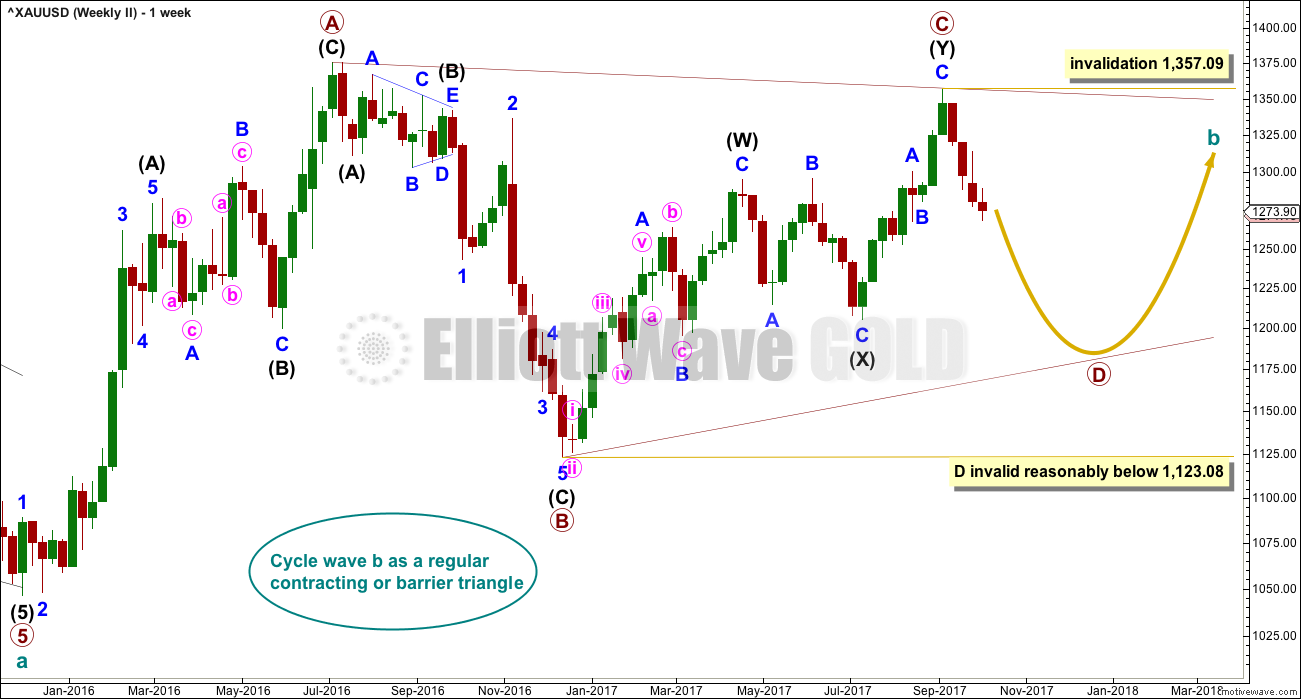
There are more than 23 possible corrective structures that B waves may take, and although cycle wave b still fits well at this stage as a triangle, it may still be another structure. This wave count looks at the possibility that it may be a double zigzag.
If cycle wave b is a double zigzag, then current upwards movement may be part of the second zigzag in the double, labelled primary wave Y.
The target remains the same.
Within intermediate wave (C), no second wave correction may move beyond the start of its first wave below 1,205.41. However, prior to invalidation, this wave count may be discarded if price breaks below the lower edge of the black Elliott channel. If this wave count is correct, then intermediate wave (C) should not break below the Elliott channel which contains the zigzag of primary wave Y upwards.
There are two problems with this wave count which reduce its probability in terms of Elliott wave:
1. Cycle wave b is a double zigzag, but primary wave X within the double is deep and time consuming. While this is possible, it is much more common for X waves within double zigzags to be brief and shallow.
2. Intermediate wave (B) within the zigzag of primary wave Y is a double flat correction. These are extremely rare, even rarer than running flats. The rarity of this structure must further reduce the probability of this wave count.
DAILY CHART
Click chart to enlarge.
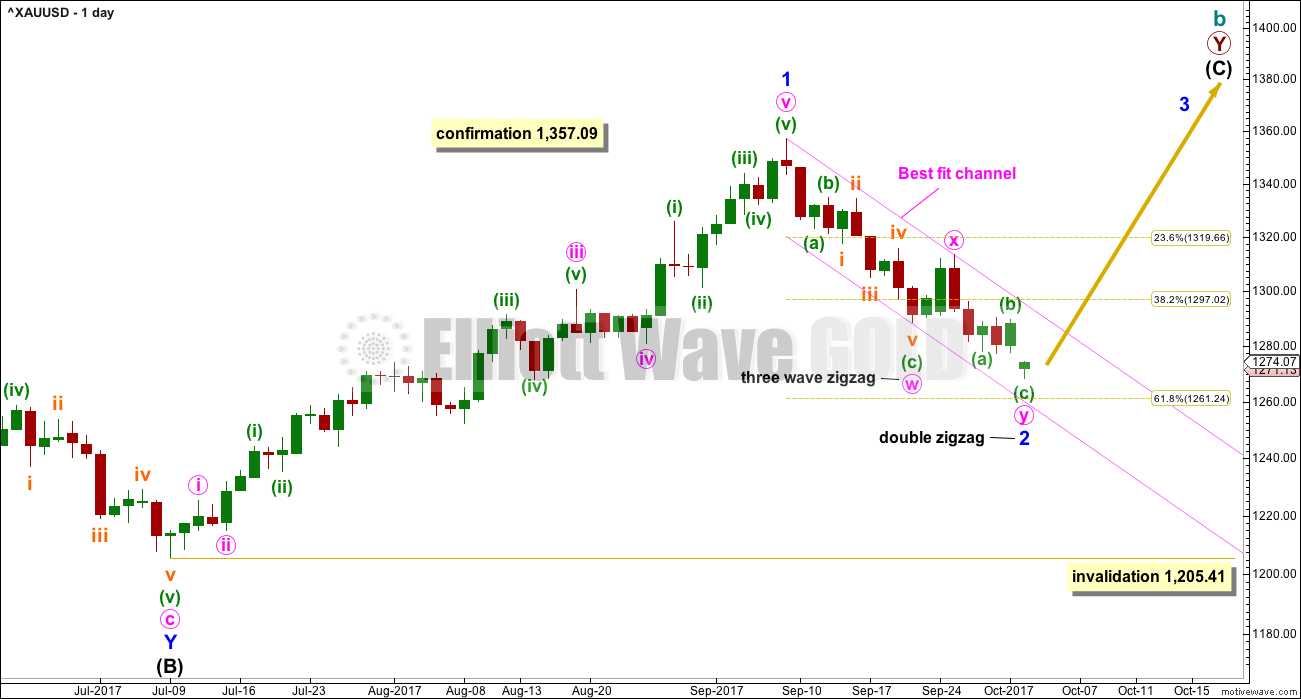
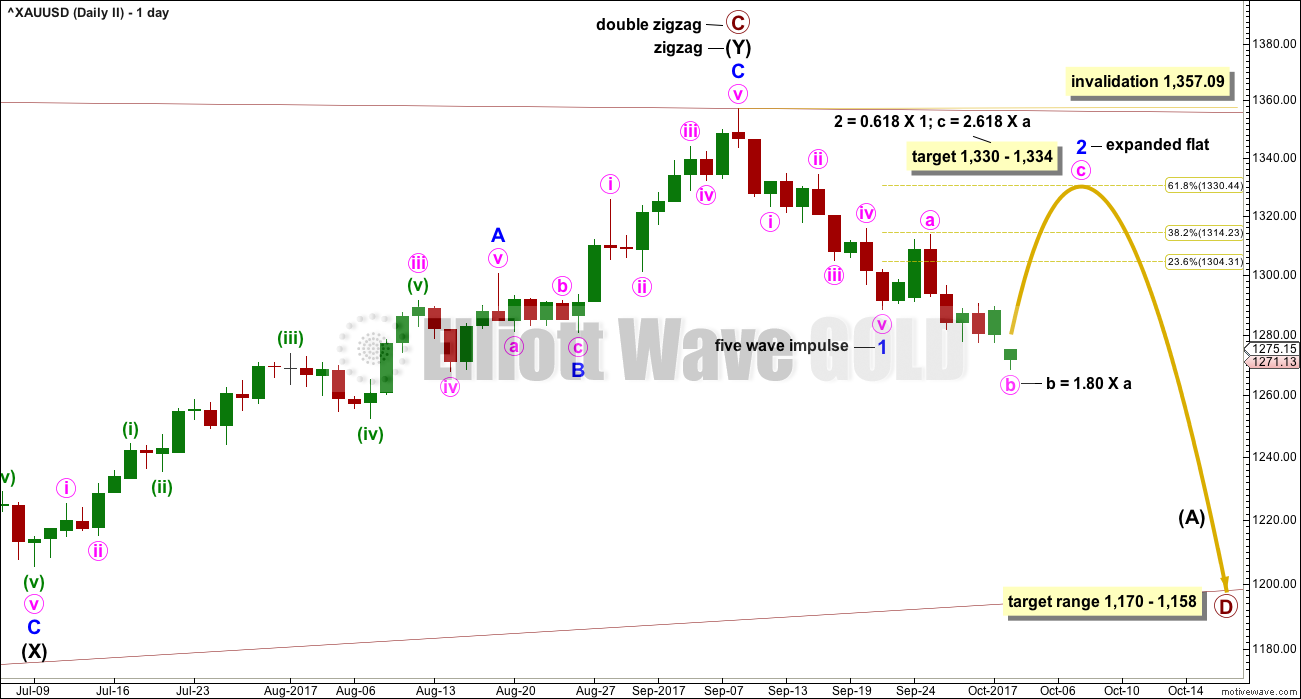
The analysis will focus on the structure of intermediate wave (C). To see details of all the bull movement for this year see daily charts here.
Intermediate wave (C) must be a five wave structure, either an impulse or an ending diagonal. It is unfolding as the more common impulse.
It is possible that minor wave 1 may have been over at the last high and the current pullback may be minor wave 2. Minor wave 2 may not move beyond the start of minor wave 1 below 1,205.41.
Minor wave 2 is not over and may continue lower to reach a more normal depth of about 0.618 the length of minor wave 1, about 1,261. This would also see minor wave 2 have a better proportion to minor wave 1 in terms of duration; minor wave 1 lasted 44 days and so far minor wave 2 has lasted only 17 days. If it continues now for another 4 days, it may total a Fibonacci 21.
HOURLY CHART
Click chart to enlarge.
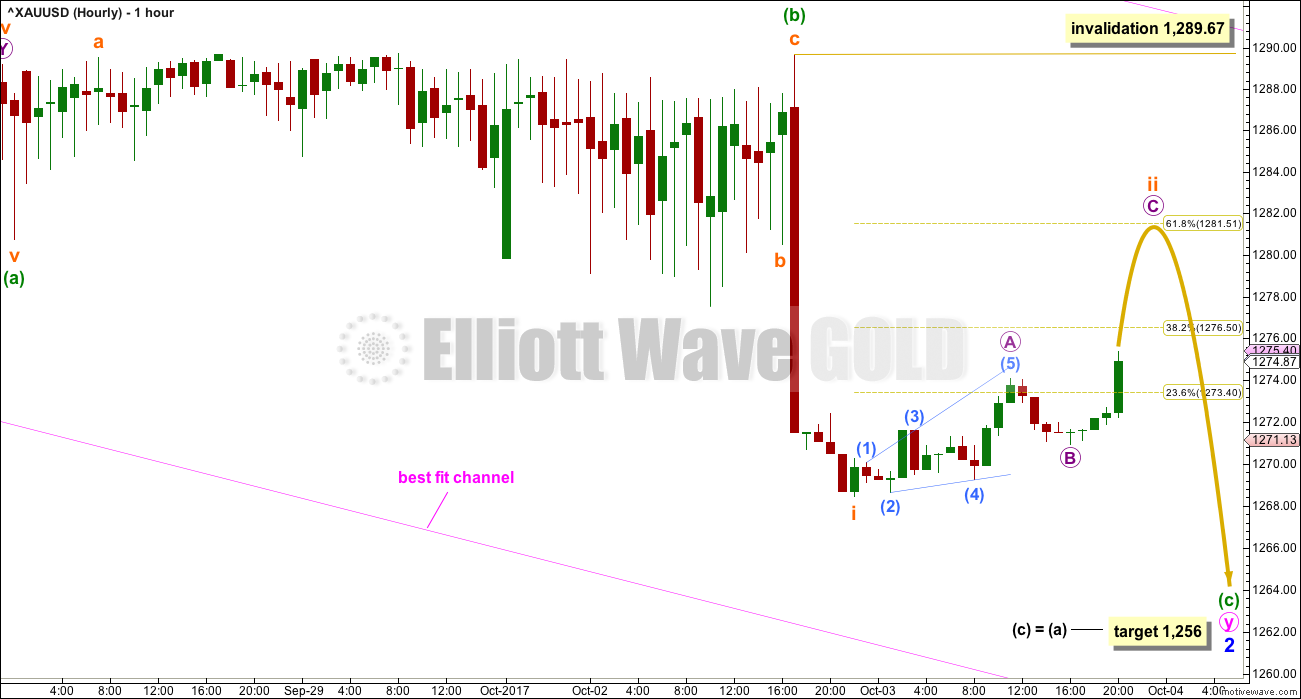
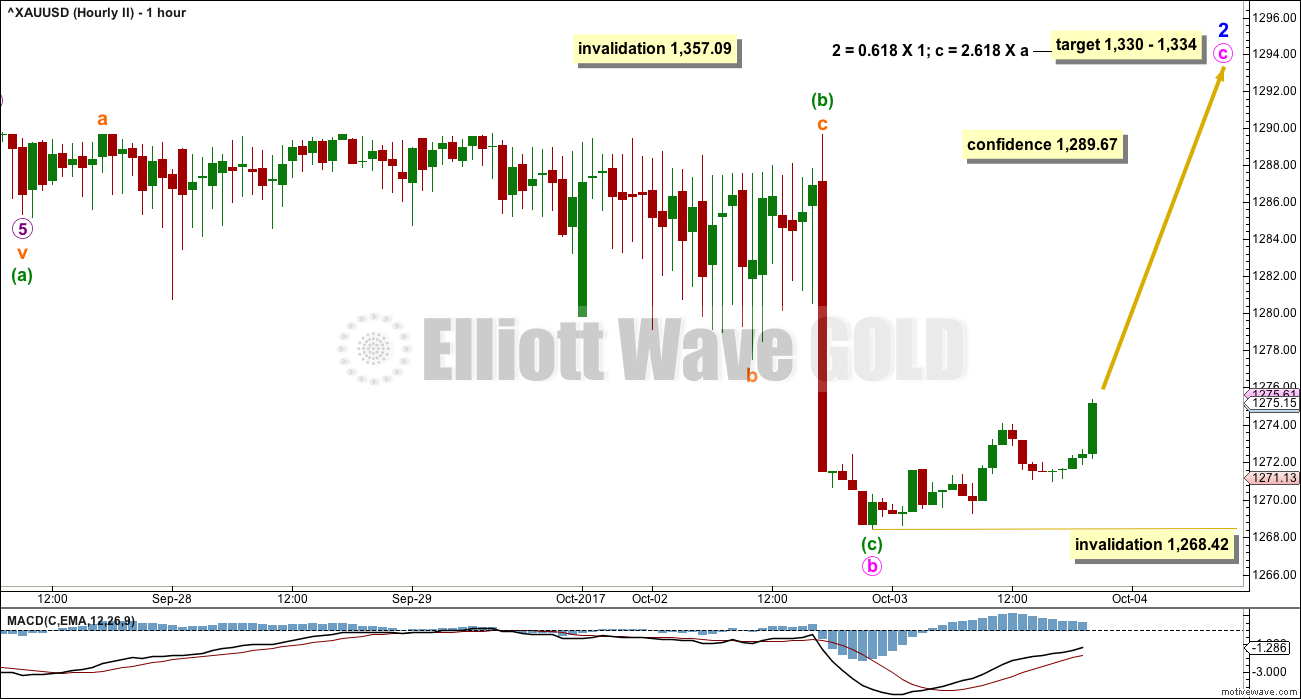
BarChart have fixed the problem with their data for current data, and the problem of past data for the sessions from 28th September to 2nd of October will be fixed in the next 24 hours. As members can see, the data for the whole of minuette wave (b) is still wrong. This was probably some kind of combination; I will analyse that when the data is fixed. At this time, it will make no difference at all to the analysis because it is clear that minuette wave (b) is over no matter what structure it was.
I have checked the subdivisions within minuette wave (c) on PMBull data and this will subdivide neatly into a five wave structure at the hourly chart level.
If minuette wave (c) is not complete, then only subminuette wave i within it may be over at the last low. Subminuette wave ii may be moving higher as a zigzag to end about the 0.618 Fibonacci ratio of subminuette wave i.
Thereafter, this hourly wave count would expect another wave down with some increase in momentum for subminuette wave iii.
If the target for this hourly wave count is wrong, it may not be low enough.
Subminuette wave ii may not move beyond the start of subminuette wave i above 1,289.67.
ALTERNATE HOURLY CHART
Click chart to enlarge.
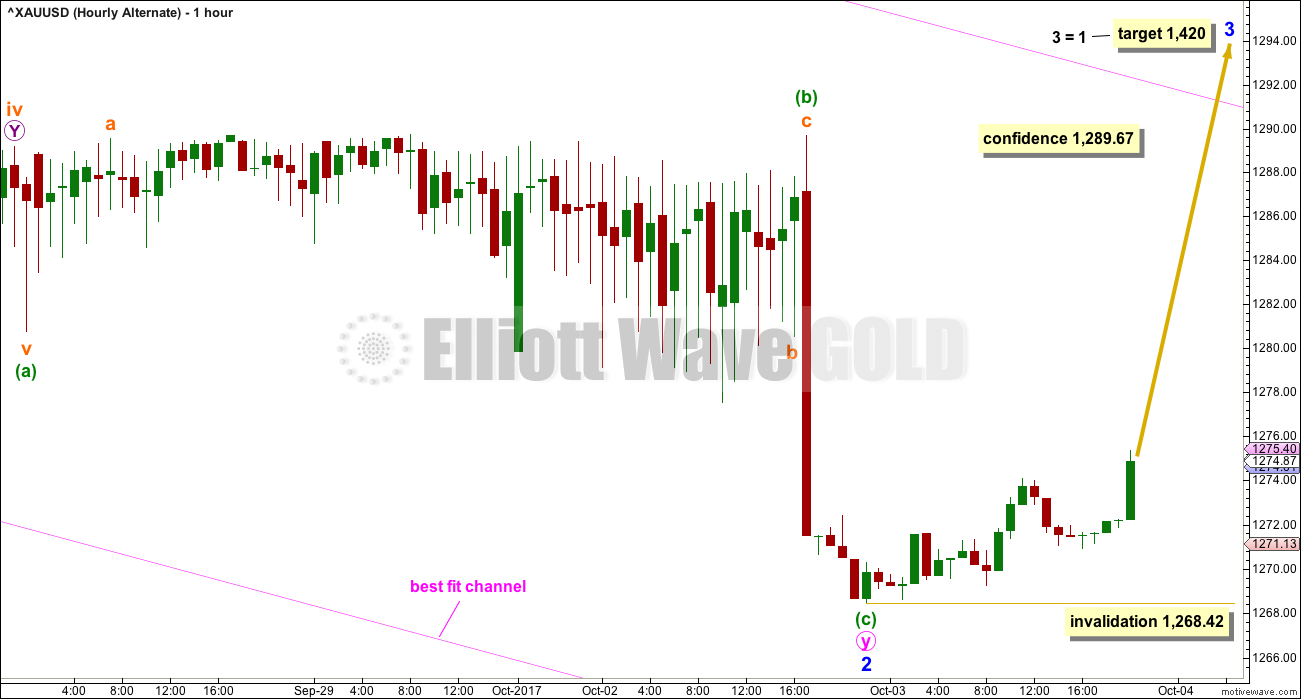
It is possible to see that minor wave 2 could be over by simply moving the degree of labelling within minuette wave (c) all up one degree.
This wave count requires a new high above the high for the 2nd of October (which for BarChart data was at 1,289.67) before any confidence may be had in it.
The trend remains the same until proven otherwise. Assume the trend is down until price proves it is not.
If the next wave up is the start of a third wave at minor degree, then it should have support from volume.
SECOND ELLIOTT WAVE COUNT
WEEKLY CHART
Click chart to enlarge.
It is still possible that cycle wave b is unfolding as a regular contracting triangle.
Within a triangle, one sub-wave should be a more complicated multiple, which may be primary wave C. This is the most common sub-wave of the triangle to subdivide into a multiple.
Intermediate wave (Y) now looks like a complete zigzag at the weekly chart level.
Primary wave D of a contracting triangle may not move beyond the end of primary wave B below 1,123.08. Contracting triangles are the most common variety.
Primary wave D of a barrier triangle should end about the same level as primary wave B at 1,123.08, so that the B-D trend line remains essentially flat. This involves some subjectivity; price may move slightly below 1,123.08 and the triangle wave count may remain valid. This is the only Elliott wave rule which is not black and white.
Finally, primary wave E of a contracting or barrier triangle may not move beyond the end of primary wave C above 1,295.65. Primary wave E would most likely fall short of the A-C trend line. But if it does not end there, then it can slightly overshoot that trend line.
Primary wave A lasted 31 weeks, primary wave B lasted 23 weeks, and primary wave C lasted 38 weeks.
The A-C trend line now has too weak a slope. At this stage, this is now a problem for this wave count, the upper A-C trend line no longer has such a typical look.
Within primary wave D, no part of the zigzag may move beyond its start above 1,357.09.
DAILY CHART
Click chart to enlarge.
This second wave count expects the new wave down may be deeper and longer lasting than the first wave count allows for.
A common length for triangle sub-waves is from 0.8 to 0.85 the length of the prior wave. Primary wave D would reach this range from 1,170 to 1,158.
If primary wave C is correctly labelled as a double zigzag, then primary wave D must be a single zigzag.
Within the single zigzag of primary wave D, intermediate wave (A) is labelled as an incomplete impulse.
Within intermediate wave (A), minor wave 1 will fit as a five wave impulse. While it is possible that minor wave 2 could have been over at the high for the 25th of September, it would be remarkably brief and shallow; the proportions between minor waves 1 and 2 would be very poor.
It is still more likely that minor wave 2 is continuing further as an expanded flat correction. Expanded flats are very common structures. The most common length for their B waves is from 1 to 1.38 times the length of their A waves. Here, minute wave b is now a 1.80 length to minute wave a. This is longer than the most common length but still within allowable limits of up to 2 times the length of minute wave a.
If price continues lower to 1,263 or below, then minute wave b would reach 2 times the length of minute wave a. At that stage, the idea of an expanded flat correction would be discarded based upon a very low probability.
The structure of minute wave b now looks to be complete at the hourly chart level. Here, on the daily chart, it looks like a three wave structure. So far this idea of an expanded flat currently unfolding still has a very good look.
HOURLY CHART
Click chart to enlarge.
If price makes a new high above 1,289.67, then both the alternate hourly chart for the first wave count and this hourly chart for the second wave count will be possible. This wave count expects that upwards movement may be more brief: only minute wave c to end minor wave 2 of an expanded flat.
Expanded flats are very common structures. They can be identified as viable possibilities by looking for weakness within their B waves. Here, minute wave b shows a strong decline in volume and a decline in ATR. This offers some support to this wave count. However, there is no divergence with Stochastics at recent lows to indicate weakness, which is often a feature of B waves within expanded flats (often is not the same as always).
Because minute wave b is longer than 1.618 the length of minute wave a, the appropriate target for minute wave c is calculated using the 2.618 Fibonacci ratio. Minute wave c would be extremely likely to make at least a slight new high above the end of minute wave a at 1,292.62 to avoid a truncation and a very rare running flat correction.
Minor wave 2 may not move beyond the start of minor wave 1 above 1,357.09. This is the price point now which differentiates this second Elliott wave count from the first Elliott wave count.
TECHNICAL ANALYSIS
WEEKLY CHART
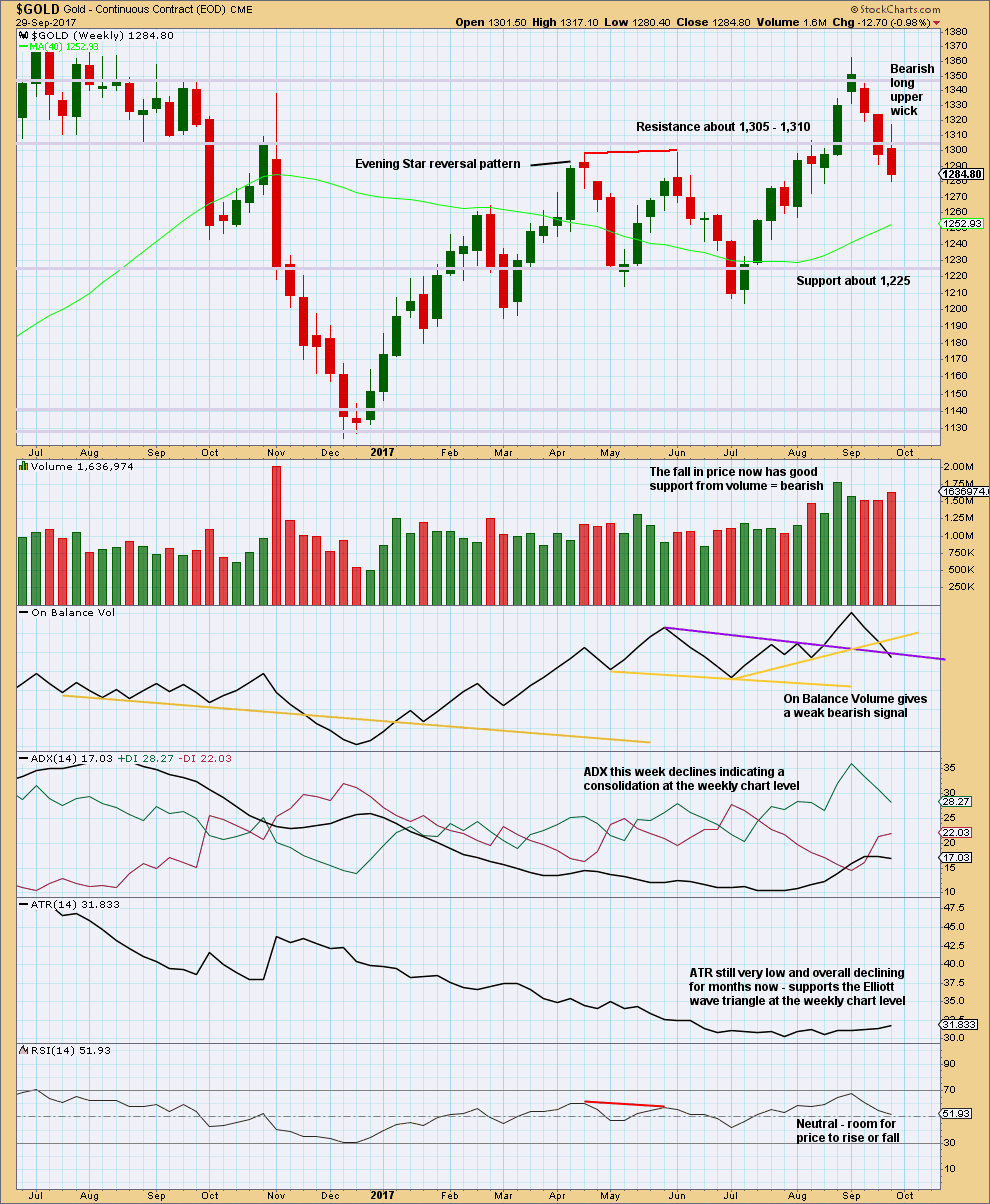
Click chart to enlarge. Chart courtesy of StockCharts.com.
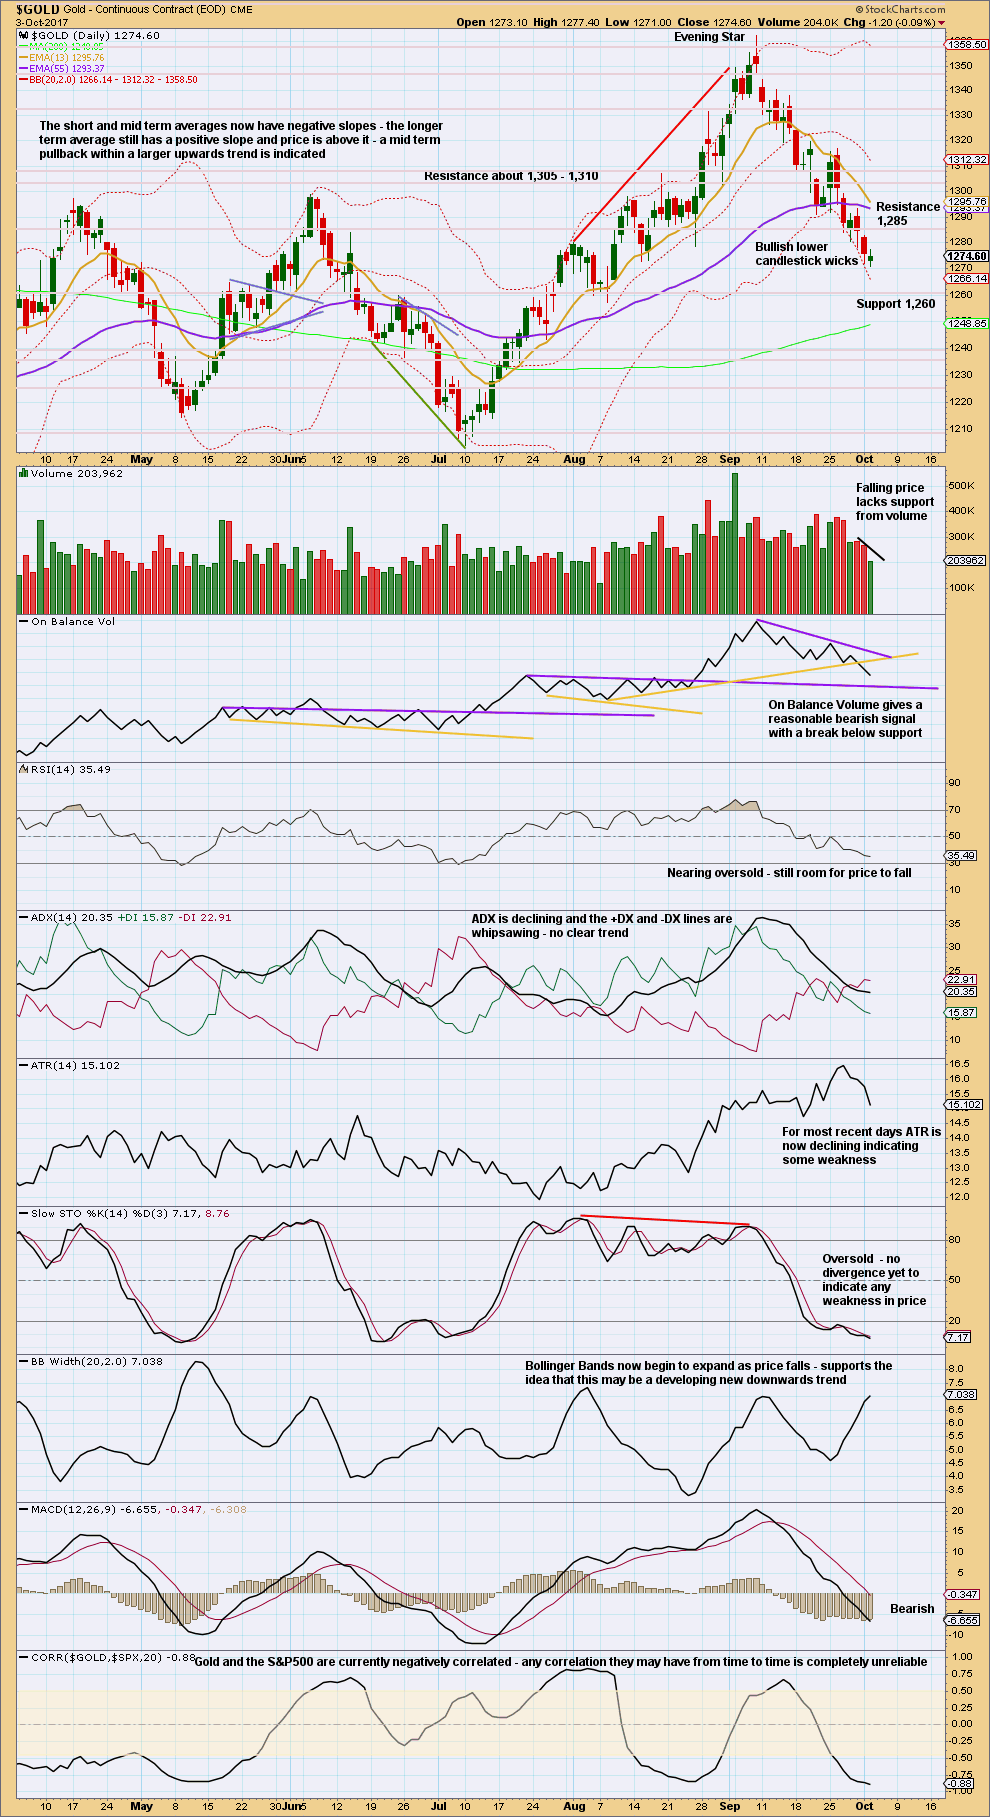
Support of the Elliott wave counts which expect overall more downwards movement this week comes from an increase in volume last week for downwards movement, a bearish upper candlestick wick, and a weak bearish signal now from On Balance Volume.
These signals cannot tell us how far price may fall though. Support and resistance may be used as a guide for this. Next strong support for price is about 1,225.
DAILY CHART
Click chart to enlarge. Chart courtesy of StockCharts.com.
A small spinning top candlestick represents a balance of bulls and bears with indecision today. The balance of volume was downwards and price moved lower, with volume showing another clear decline. There is weakness in this downwards movement. This supports the idea that it may be a B wave, or it may be the end of the pullback.
There is some distance to go before On Balance Volume finds support.
Both RSI and Stochastics indicate that there is still room for price to fall here.
GDX
DAILY CHART
Click chart to enlarge. Chart courtesy of StockCharts.com.
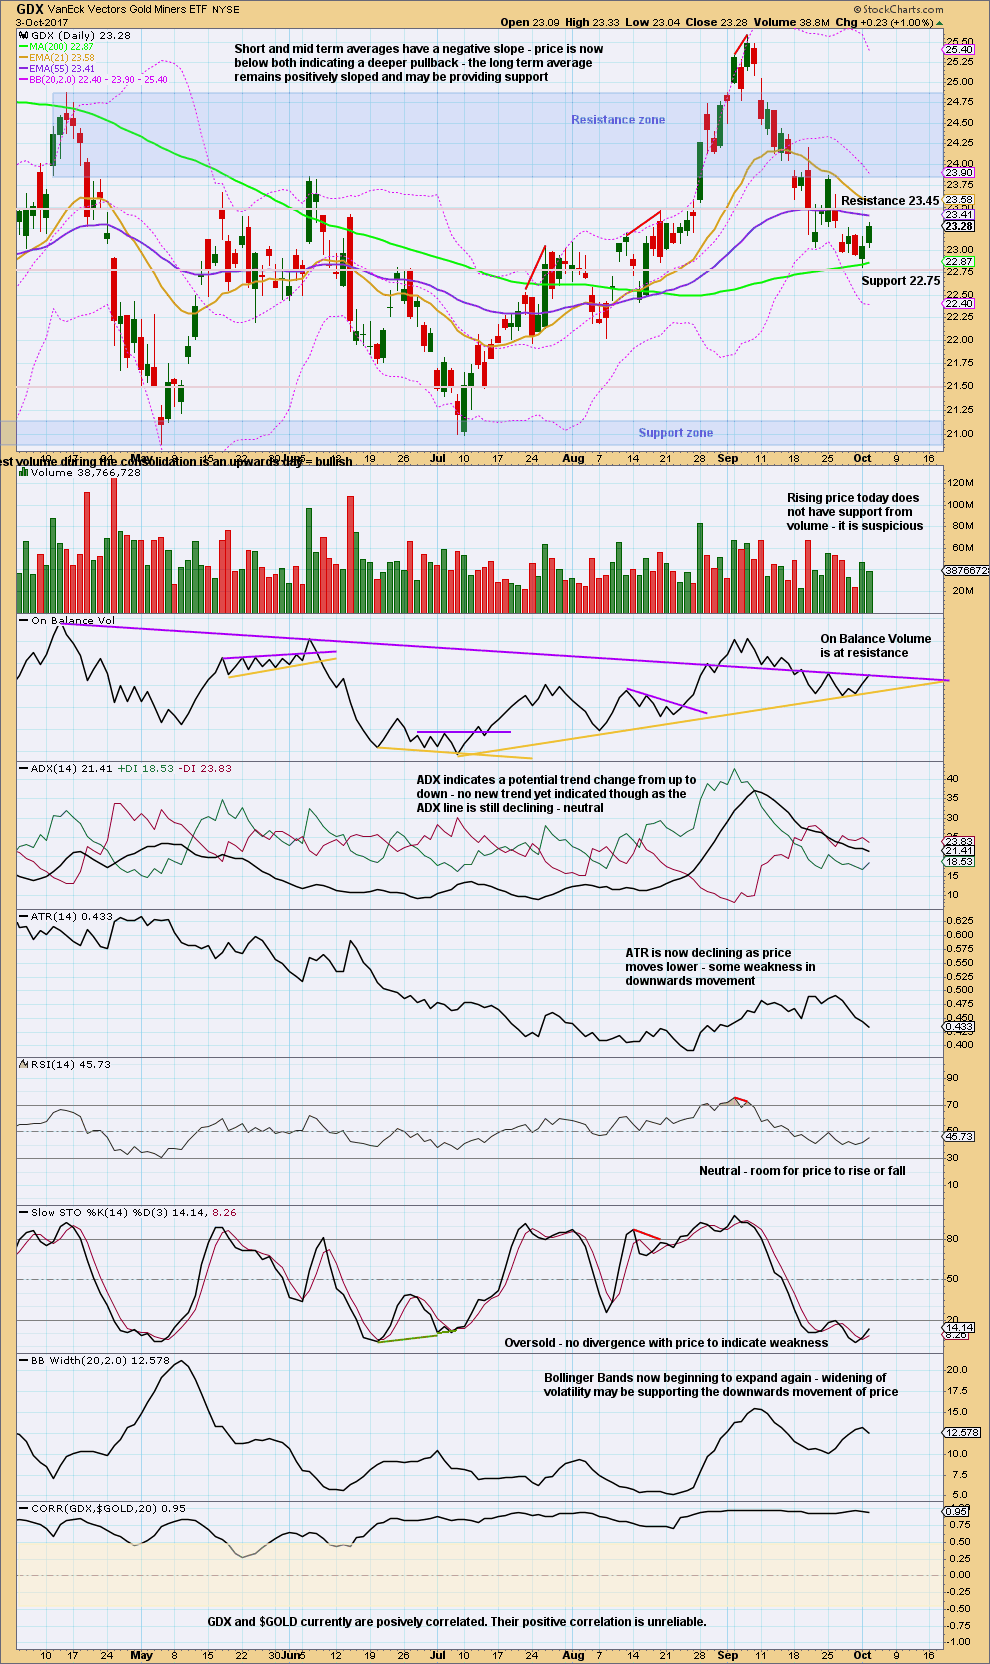
The small bounce today is suspicious. RSI was not oversold at the last low and there was no divergence with price and Stochastics.
Because of this, it looks like this bounce may more likely be a small bounce towards the end of a mid term downwards trend.
Published @ 09:50 p.m. EST.
Oh well the drop stopped without taking out 1270. Expecting an upturn which should remain curtailed under Lara’s invalidation 1289.67 before another drop. Gold price is wobbly; momentum and ROC are still bearish.
Move off the bottom is looking bullish so far
https://www.tradingview.com/x/DtdAkKRG/
Back-test of the breakout. Miners look as if they have broken their downtrend and a bottom is quite possible here for both.
I agree. Time to be long!
Couple of things concern me about switching to long just now. First, from what i can see the buy signal is on shorter term charts, not on the daily yet. Would be jumping the gun and very risky (that’s crazy for me to say given how risky i trade). Second, the COT structure is not altogether friendly at the moment. You have hedge funds liquidating and not anywhere near short enough to create a good squeeze. Although there is room for them to add to longs again, it’s not an ideal time just looking at that. Third, we have payrolls this Friday. If you notice, the consensus number is incredibly low compared to recent previous months. It shouldn’t be too hard to blow that number out. If that number come in even on the normal side, it could cause the USD and market to shoot higher. Gold will fall. Right now, gold is simply hanging on to the 100 DMA, waiting for Friday i think. A lot will depend on that report. i do have to agree that gold stocks have triggered a buy signal, albeit on anemic volume, but that is gold friendly nonetheless. Makes it hard to take a strong view either way
Yep. Legitimate concerns, yet I like what I see in the charts. I think the dollar looks toppy on the daily. It might be completing a 4th wave and is going lower.
Take a look at this chart by Northstar at Goldtent. I don’t know how reliable COT is.
That’s a pretty cool chart Dreamer, thanks! I remember many years ago some analyst tried to set up a service where he would trade solely based on the COT numbers. Was a big fail i think. But in any event, it’s true COT is only a piece of the puzzle, and more of an art than a science. And it’s a few days delayed to boot.
Price has broken through the channel around Minuette waves (a) & (b) of Minute ((y)). I believe this now favors Lara’s Alternate Hourly count that shows the bottom is in.
https://www.tradingview.com/x/ivMNjDk7/
Not too sure if the bottom is in. Ideally Gold should be facing rejection around 1278-79 for a swing low to break below 1268 (minor wave 2 is not over?); if a break above 1278-79 does occur then it should face rejection around 1287(under 1290?). Favoring the first wave count! Let’s see what transpires for today.
How to bring back annotations bar (Trend lines, text etc) on left side on Tradingview?
thanks.
Papudi,
Halfway down on the left hand side of your screen, there should be a little tab to show/hide the tools. You probably hid the tools. Click on the little tab to unhide.
OR…
it could be the scenario in the second hourly chart, the expanded flat
and that’s weird, I don’t see a breach of the channel yet? not with my BarChart data…
Bad hourly data? Doesn’t look like they are going to fix it all.
Lara. Today is the Chinese Mid-Autumn Festival. It is the second largest festive celebrations in Hong Kong after the Chinese New Year. You might not want to miss the fire dragon dance at Causeway Bay, where you stay. It is on every night from 8:15 pm, until the 6th. There are also lantern displays at Victoria Park, some very huge. It is just one MRT stop from Causeway Bay (Google Tai Hang fire dragon dance for location). Enjoy your holidays there; you’ve picked a good time to visit. I was there 2 years ago, and it was a fascinating time. We don’t have that degree of festival stmosphere here in Singapore although the population is predominantly Chinese.
Errata: MTR, not MRT.
Fire dragon parade is at Tai Hang Road.
Lantern display is inside Victoria Park.
Both are within walking distance of Tin Hau MTR station. You might need an evening each for the two events.
It was awesome Alan! I can look down on Victoria park from my hotel, and we did visit the park for the lantern festival last night.
I missed the fire dragon dance darn it, because I’m only now reading your comment the next day….
I’m with a friend who’s lived here for over 20 years so she’s taking me to all the best spots. Last night we dined at Din Tai Fung which was most excellent and so close by… she’s taken me stand up paddle boarding in Stanley and on a city walk here in Hong Kong island… two more days of adventure then I’ll be ready to go home 🙂
Having the time of my life!
Dreamer: only noticed today your comments on the 29th of September post. Thank you so very much for your assistance.
I think there is a solution which may avoid a small truncation at the end of sub-micro wave (3).
When BarChart data for that period is fixed I’ll take a look at it. At this stage though I don’t think it’s going to make any difference to analysis of what should happen next.
No worries. There’s probably a better way to label all those small squiggles…