
The trend was assumed to remain downwards while price remains within the channel. A new low today continues that trend.
Summary: Assume the trend remains down while price remains below 1,272.28 and more importantly while it remains within the channel.
The target for downwards movement is now at 1,256 in the first instance, and 1,239 thereafter.
If upwards movement does break above the channel, then expect it to continue for a few days.
Always trade with stops and invest only 1-5% of equity on any one trade.
New updates to this analysis are in bold.
Last monthly charts for the main wave count are here, another monthly alternate is here, and video is here.
Grand SuperCycle analysis is here.
The wave counts will be labelled first and second. Classic technical analysis will be used to determine which wave count looks to be more likely. In terms of Elliott wave structure the second wave count has a better fit and fewer problems.
FIRST ELLIOTT WAVE COUNT
WEEKLY CHART
Click chart to enlarge.
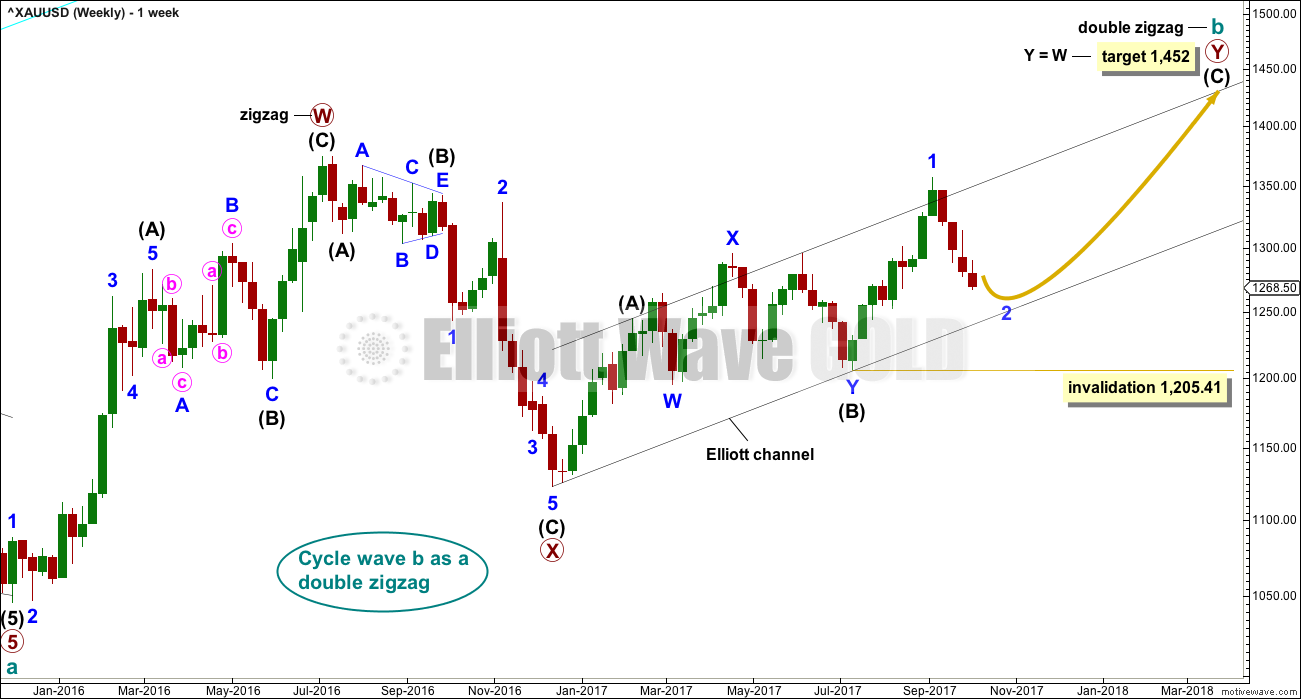
There are more than 23 possible corrective structures that B waves may take, and although cycle wave b still fits well at this stage as a triangle, it may still be another structure. This wave count looks at the possibility that it may be a double zigzag.
If cycle wave b is a double zigzag, then current upwards movement may be part of the second zigzag in the double, labelled primary wave Y.
The target remains the same.
Within intermediate wave (C), no second wave correction may move beyond the start of its first wave below 1,205.41. However, prior to invalidation, this wave count may be discarded if price breaks below the lower edge of the black Elliott channel. If this wave count is correct, then intermediate wave (C) should not break below the Elliott channel which contains the zigzag of primary wave Y upwards.
There are two problems with this wave count which reduce its probability in terms of Elliott wave:
1. Cycle wave b is a double zigzag, but primary wave X within the double is deep and time consuming. While this is possible, it is much more common for X waves within double zigzags to be brief and shallow.
2. Intermediate wave (B) within the zigzag of primary wave Y is a double flat correction. These are extremely rare, even rarer than running flats. The rarity of this structure must further reduce the probability of this wave count.
DAILY CHART
Click chart to enlarge.
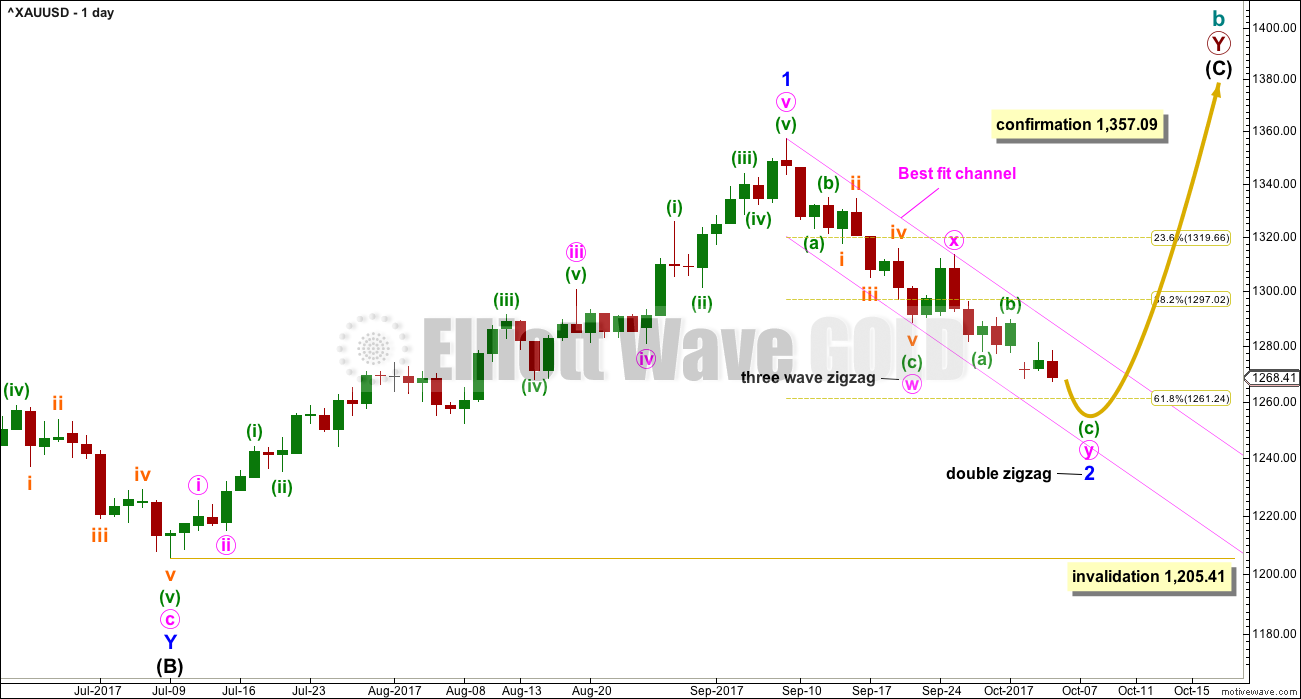
The analysis will focus on the structure of intermediate wave (C). To see details of all the bull movement for this year see daily charts here.
Intermediate wave (C) must be a five wave structure, either an impulse or an ending diagonal. It is unfolding as the more common impulse.
It is possible that minor wave 1 may have been over at the last high and the current pullback may be minor wave 2. Minor wave 2 may not move beyond the start of minor wave 1 below 1,205.41.
Minor wave 2 may not be over and may continue lower. This would see minor wave 2 have a better proportion to minor wave 1 in terms of duration; minor wave 1 lasted 44 days and so far minor wave 2 has lasted only 19 days. If it continues now for another 2 days, it may total a Fibonacci 21.
HOURLY CHART
Click chart to enlarge.
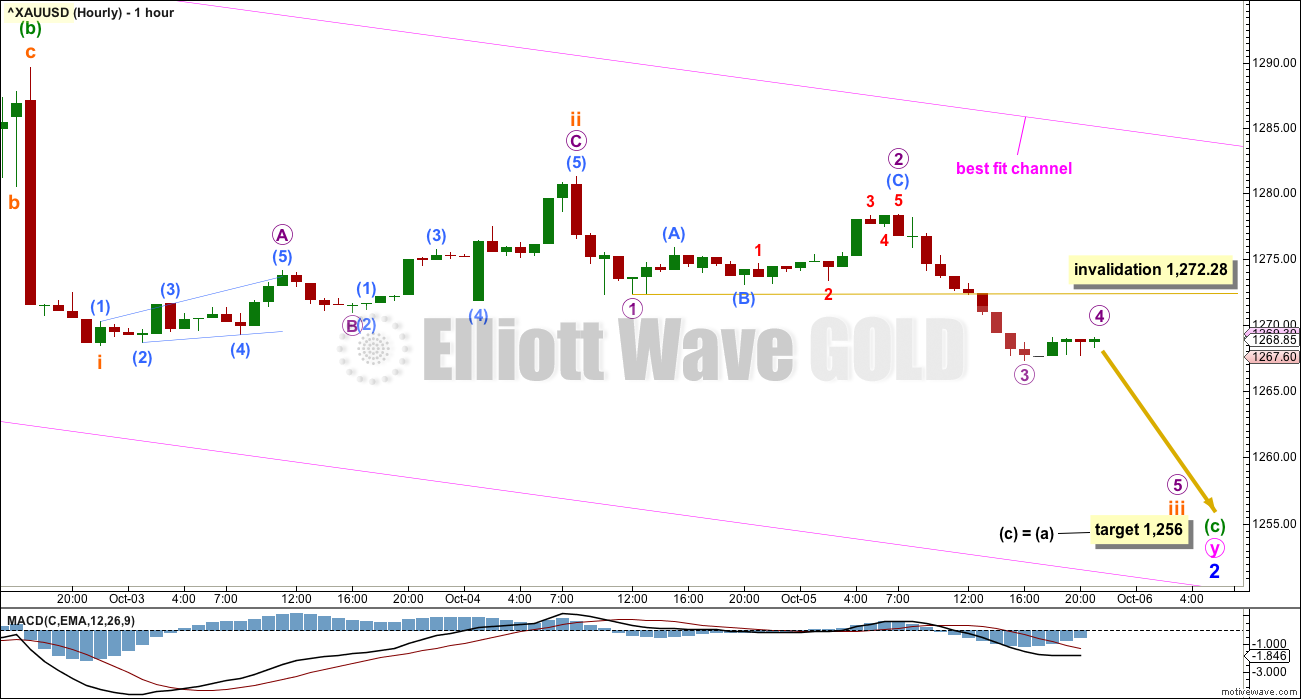
If minuette wave (c) is not complete, then only subminuette waves i and now ii within it may be over. Subminuette wave ii may be a zigzag that may have ended very close to the 0.618 Fibonacci ratio of subminuette wave i.
This hourly wave count now expects another wave down with some increase in momentum for subminuette wave iii. So far subminuette wave iii is weaker than subminuette wave i. This can happen sometimes, but because it is uncommon the probability that this portion of movement is labelled correctly must reduce. The alternate hourly chart below has a better fit with MACD, but it is an alternate because we should always assume the trend remains the same until proven otherwise.
If the target for this hourly wave count is wrong, it may not be low enough.
Subminuette wave iii may only subdivide as a simple impulse. Within it micro wave 4 may not move into micro wave 1 price territory above 1,272.28.
Price remains so far within the best fit channel, copied over from the daily chart. While price remains within that channel, then no confidence in the idea of a low in place for Gold may be had.
ALTERNATE HOURLY CHART
Click chart to enlarge.
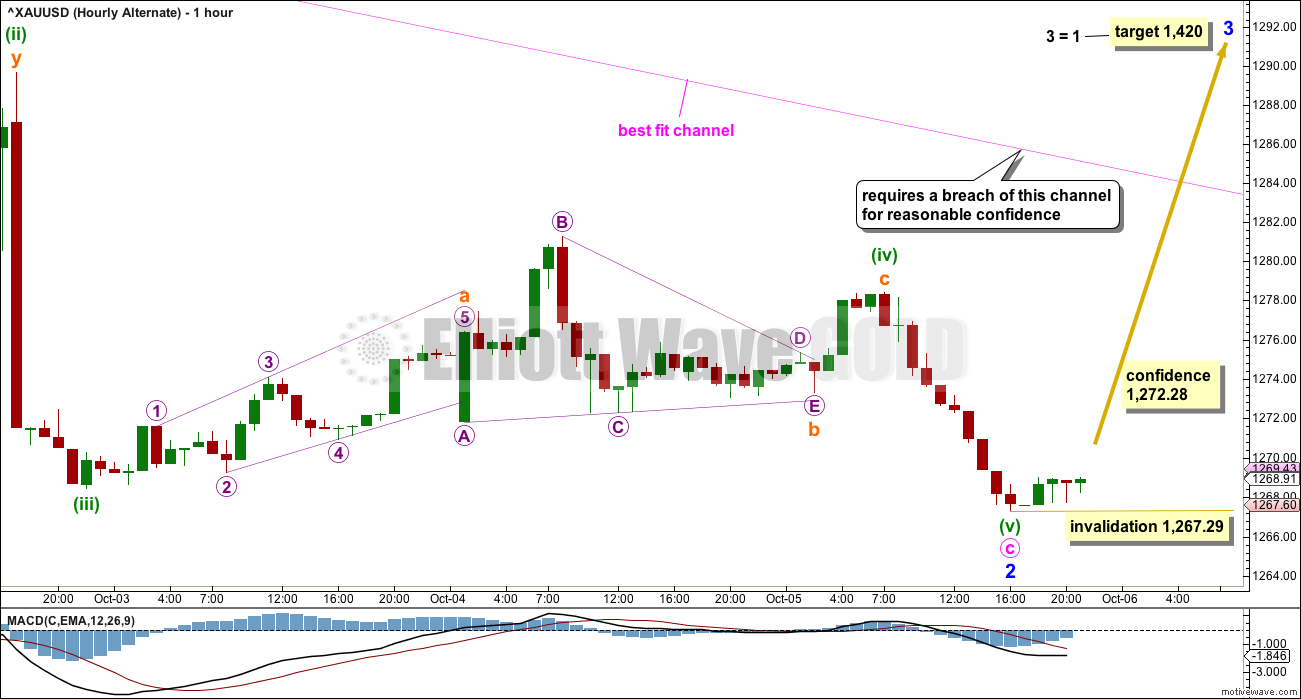
This wave count sees the subdivisions within minor wave 2 as a single zigzag, not a double. Minuette waves a and b are seen in the same position as minute waves w and x on the daily chart.
If minute wave c began at the high of the 26th of September, then it may be completing as an impulse. The choppy overlapping movement which saw BarChart data suffer from a bug may have been minuette wave (ii) within that impulse, seen here on the left hand side of the chart.
Thereafter, minuette wave (iii) may have begun.
This wave count fits neatly with MACD. Minuette wave (iii) exhibits strongest downwards momentum within minute wave c.
Minuette wave (i) may have ended at 1,285.18 and so no part of minuette wave (iv) here overlaps into minuette wave (i) price territory.
This wave count absolutely requires a breach of the best fit channel before any reasonable confidence may be had in it. Only at that stage should a low be expected to be in place.
SECOND ELLIOTT WAVE COUNT
WEEKLY CHART

Click chart to enlarge.
It is still possible that cycle wave b is unfolding as a regular contracting or barrier triangle.
Within a triangle, one sub-wave should be a more complicated multiple, which may be primary wave C. This is the most common sub-wave of the triangle to subdivide into a multiple.
Intermediate wave (Y) now looks like a complete zigzag at the weekly chart level.
Primary wave D of a contracting triangle may not move beyond the end of primary wave B below 1,123.08. Contracting triangles are the most common variety.
Primary wave D of a barrier triangle should end about the same level as primary wave B at 1,123.08, so that the B-D trend line remains essentially flat. This involves some subjectivity; price may move slightly below 1,123.08 and the triangle wave count may remain valid. This is the only Elliott wave rule which is not black and white.
Finally, primary wave E of a contracting or barrier triangle may not move beyond the end of primary wave C above 1,295.65. Primary wave E would most likely fall short of the A-C trend line. But if it does not end there, then it can slightly overshoot that trend line.
Primary wave A lasted 31 weeks, primary wave B lasted 23 weeks, and primary wave C lasted 38 weeks.
The A-C trend line now has too weak a slope. At this stage, this is now a problem for this wave count, the upper A-C trend line no longer has such a typical look.
Within primary wave D, no part of the zigzag may move beyond its start above 1,357.09.
DAILY CHART
Click chart to enlarge.
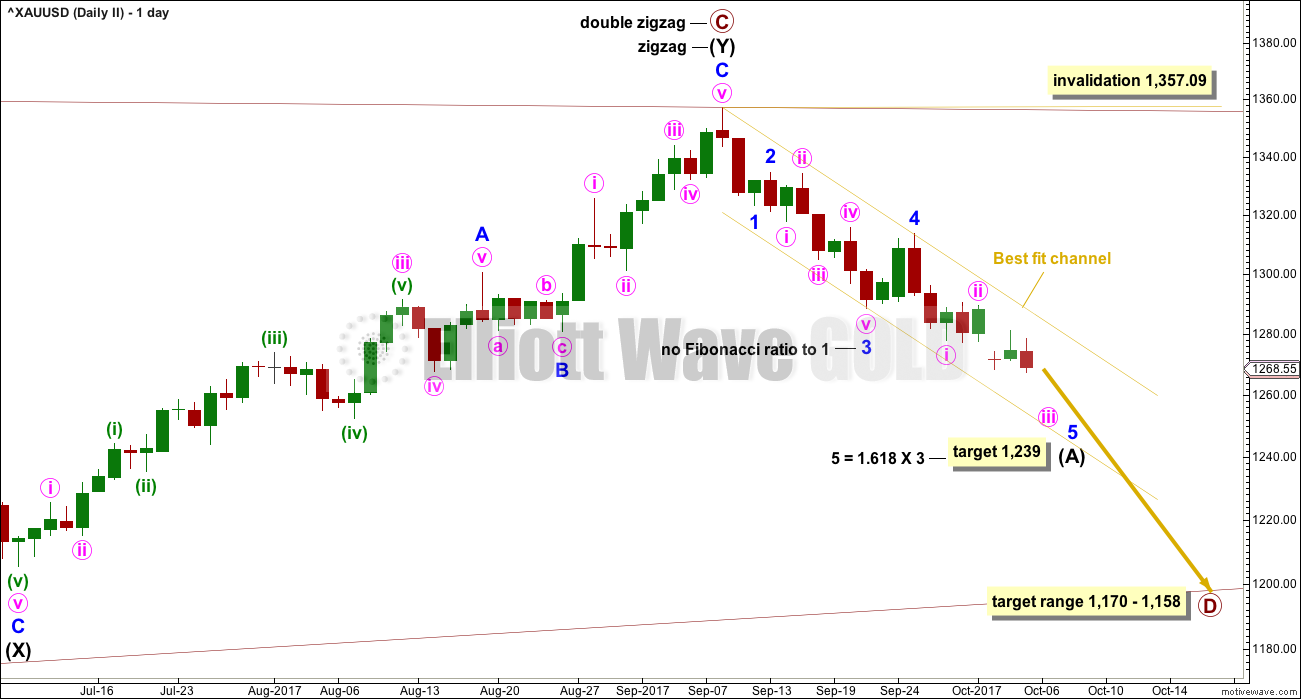
This second wave count expects the new wave down may be deeper and longer lasting than the first wave count allows for.
A common length for triangle sub-waves is from 0.8 to 0.85 the length of the prior wave. Primary wave D would reach this range from 1,170 to 1,158.
If primary wave C is correctly labelled as a double zigzag, then primary wave D must be a single zigzag.
Within the single zigzag of primary wave D, intermediate wave (A) is labelled as an incomplete impulse.
Within intermediate wave (A), minor wave 1 will fit as a five wave impulse. The labelling within this downwards movement is changed today.
Minor waves 1 through to 4 may be complete. Intermediate wave (A) may now be in a final extended fifth wave. It is common for commodities to exhibit strong and extended fifth waves.
HOURLY CHART
Click chart to enlarge.
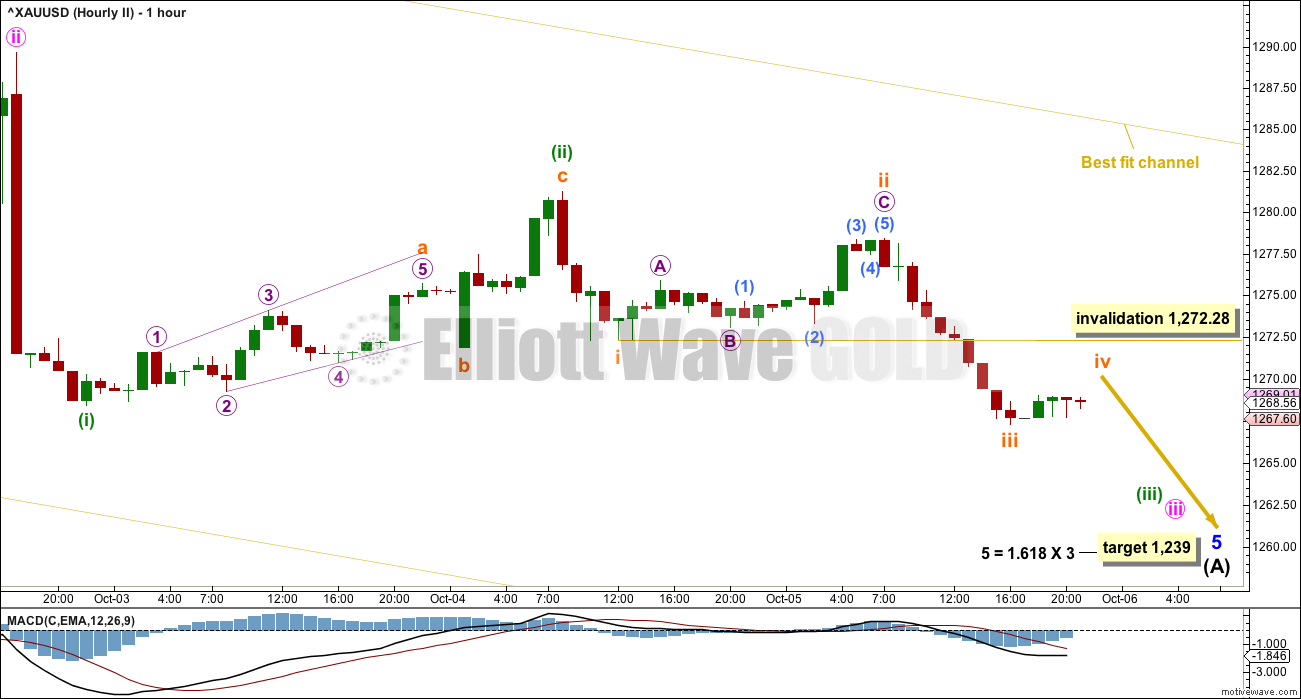
This wave count requires an increase in downwards momentum for the middle of a third wave within the extended wave of minor wave 5.
Within the middle of this wave, subminuette wave iv may not move into subminuette wave i price territory above 1,272.28.
If price does move above this point and then breaks out above the best fit channel, then intermediate wave (A) would be labeled as over and a bounce to last two to three weeks for intermediate wave (B) would be expected.
At that stage, draw a Fibonacci retracement along the length of intermediate wave (A) and use the 0.382 and 0.618 Fibonacci ratios as targets for intermediate wave (B) to end. Each target is equally likely.
TECHNICAL ANALYSIS
WEEKLY CHART
Click chart to enlarge. Chart courtesy of StockCharts.com.
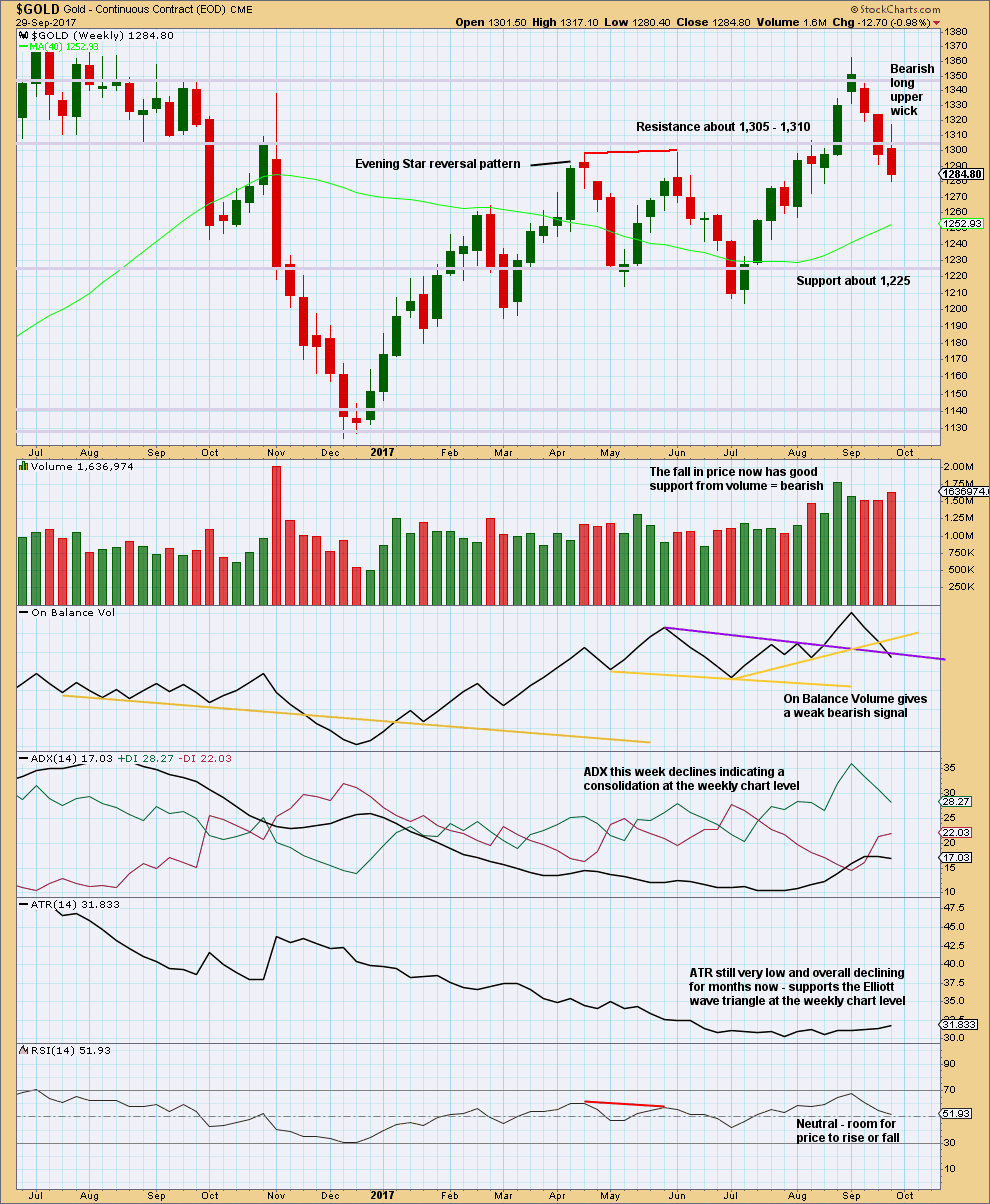
Support of the Elliott wave counts which expect overall more downwards movement this week comes from an increase in volume last week for downwards movement, a bearish upper candlestick wick, and a weak bearish signal now from On Balance Volume.
These signals cannot tell us how far price may fall though. Support and resistance may be used as a guide for this. Next strong support for price is about 1,225.
DAILY CHART
Click chart to enlarge. Chart courtesy of StockCharts.com.
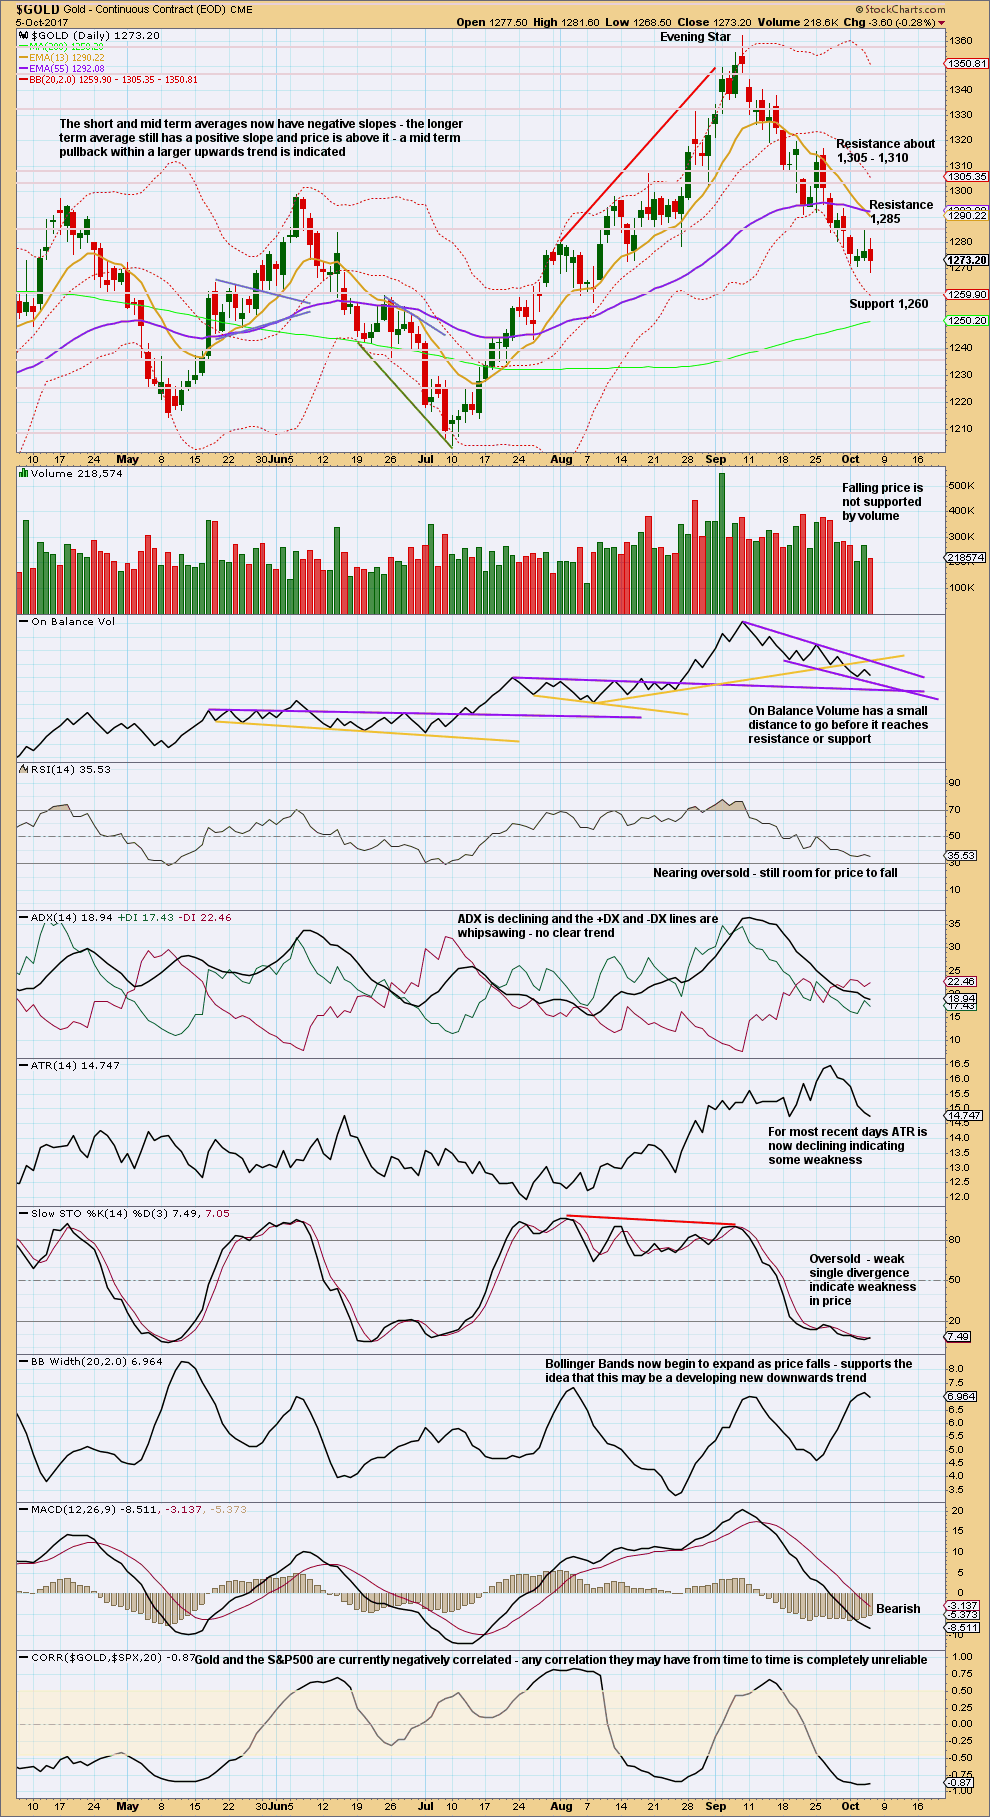
The volume profile today is bullish for the very short term; more support yesterday for upwards movement and now less support today for downwards movement.
On Balance Volume is constrained. The last signal given was bearish.
Divergence today with price and Stochastics is not enough to have any confidence in a low in place. Stochastics may remain extreme for longer and divergence before a turn is usually stronger than this.
There is room still for price to fall here. While weakness is developing, it is not yet clear enough to expect a low.
GDX
DAILY CHART
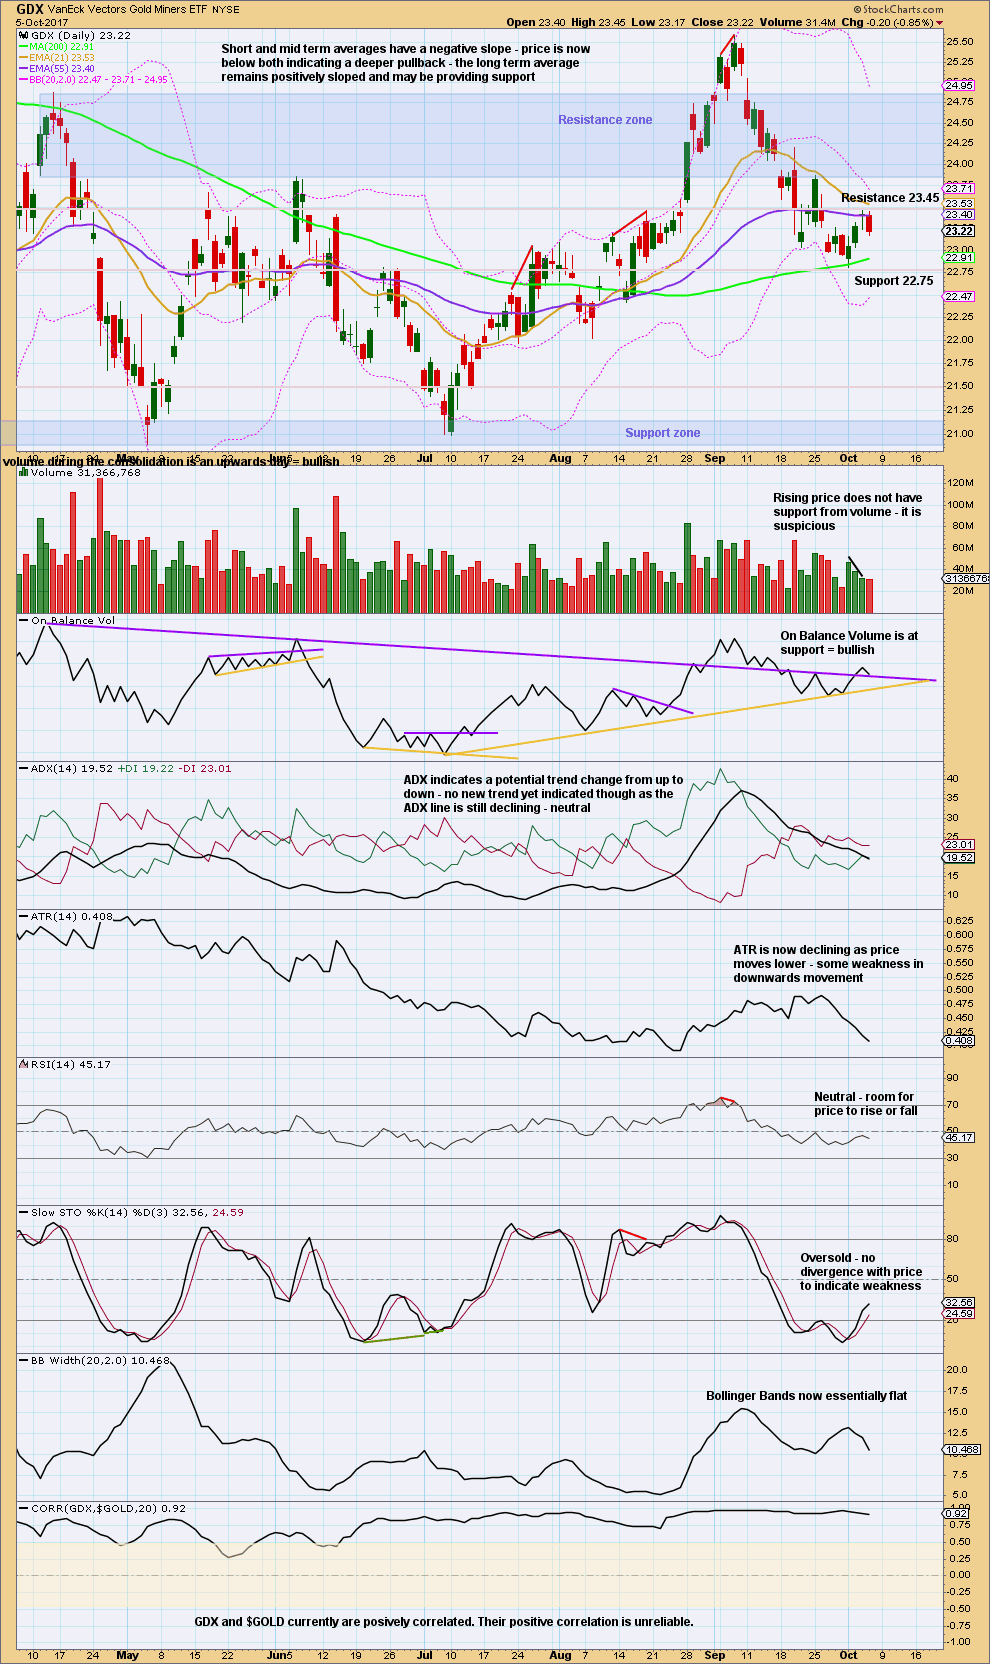
Click chart to enlarge. Chart courtesy of StockCharts.com.
In the short term, the volume profile for GDX is unclear. Both upwards and downwards movement lack support from volume. This bounce may not be quite complete.
Look for resistance about 23.85 if the bounce continues.
The trend remains down. Assume it remains down until proven otherwise. Bounces are an opportunity to join the trend, but manage risk diligently because this trend is extreme.
Like Gold, GDX did not exhibit any divergence with Stochastics at the last low nor did RSI reach oversold. There is room for price to move lower.
Published @ 10:25 p.m. EST.
For Gold, candlestick chart price still below the TLine or 8 EMA. Heikin Ashi chart still shows bearish downtrend. Stochastic only slight divergence. RSI nudging the 40 mark, below 40 being the bearish range. I think the big volume push happened in the morning with not much follow up thereafter. The three indices also took a slight dip at 10 am but mostly recovered over the day. As well, price has only closed barely outside the channel. And last of all, USD is still perched a tad above the 60 RSI, refusing to drop below this bullish range. Thus, Gold on one side pitted against the indices and USD on the other side seem to be evenly matched. In the absence of any stupid moves by the rocket man this Columbus day, hopefully Tuesday next week would shed more light?
JNUG (and therefore all miners ?) seems to have bottomed Monday, with a stronger stochastic divergence.
GDX looks even stronger than gold. A bullish engulfing candle supported by volume, producing a higher low and a higher high. OBV is bullish with a long way to go up before any possible resistance. Looks like the bottom was in last Monday.
I’m flying home to New Zealand today 🙂
I have thoroughly enjoyed my adventure here in Hong Kong, what an amazing city. I’ll be back for sure.
I’m going to have time to get the end of week analysis done before I leave, but it will only work if the video is a little more brief than usual. So I’ll focus on hourly and classic technical analysis.
Back to normal next week everybody, my New Zealand time zone is conducive to checking in and posting hourly chart updates prior to the close of the New York session.
Thank you all for your patience this week while I have not been able to give you all that extra level of support.
My next trip coming up to Tonga has a better time zone.
Glad you had a great trip. You deserve it!
Thank you Dreamer! I had the time of my life actually. The food is amazing, the only reason I’m not leaving heavier is you have to walk everywhere 🙂
I think the locals think I’m a bit of a nutter taking pics of their MTR though LOL But really, it is great design
Welcome back home (your home, NZ). Too bad the holiday is already over, eh!
LOL not sure it was a holiday as I’m still working, but I did have a very fun time 🙂 Thank you David
It sure does look like a low is in for Gold. That is a very strong bullish daily candlestick.
Gold bounced nicely today near the .618 daily retrace. The move up was supported by volume. A bounce in OBV looks bullish along with the nice reversal candle.
Further confirmation is needed to confirm this is not just a bounce. The downtrend line / channel needs to be broken to the upside and OBV needs to break overhead resistance in the coming days. Cautiously bullish and holding over the weekend.
My thoughts exactly Dreamer. Nice to see support from volume, good bullish candlestick and VERY bullish on the hourly off the low. We shall see… now to do alternate EW counts and figure out the price point that will add confidence.
When the first move up from a low is so strong like this, it’s very often the start of something more sustained.
For all that volume, the candle body is relatively short. A lot of the volume went into absorbing the selling?
I should stay long re likely Korea missile over weekend but I am not confident enough to ride out any weekend gappping – my account not big enough.
Anyone else always close at weekend?
That’s a great question Nick. I rarely do. But I think a great number of members here do.
I have access to this market almost 24 hours so it doesn’t matter to me. But if your broker locks you out I can see how that would be a problem.
Looks like bullish reversal candles printing on the daily for metals and miners. Volume looks to be solid if not strong. Miners look like the bottom is in more so than metals since they made a higher low and a higher high today.
Look at the candle and volume today on SLV and the session is not yet over. Bullish 😃
looks like an overlap of i and iv on all holy no?
bottom in i think
thoughts?
Gold went down to new lows as expected today after the NFP release and now is reversing back up. Miners did not make new lows. Looks like the low last Monday for miners may be the bottom. I also see a slightly different way to count this last drop in gold. Optimistic that the bottom may be in for gold today.
Hi! Imo nothing more than a Bullish reversal for Bearish continuation. Risk: A break above 1278 targets 1281-84
All in all, that was pretty cool this morning. I never would have expected such a crappy payroll report, and then when we got it, i never would have expected gold to head down on that. I guess they were caring more about the unemployment and wage rate, and maybe thinking these numbers were one off due to the hurricanes. I don’t understand though are all the jobs being created in Florida and Texas? Anyway, covered shorts but did not go long. I think this could be more NK jitters again, but gold is too hot to call at the moment. I will sit on the sidelines at least until end of the day, and likely will be flat this weekend for first time in a long time. I do note that gold is now treating the 100 DMA as resistance, is still on a sell signal in my book, and NK news hasn’t to date had any staying power. They might do something on Monday though. Unpredictable for the very short term at the moment and we might just go kinda sideways for a bit i think. Looking for a re-entry to short but not right away. Will see
Eli, you were right to wait for the NFP report for gold, but today sure looks like a bottom. I thinks miners bottomed last Monday.
Indeed Dreamer, it is set up for sure. GDX and SLV both printing very nice candles and on decent volume (for gold stocks, I prefer to monitor NUGT JNUG DUST and JDST volume i think they are better gauges). GLD also looking promising on decent volume and may close above 100 DMA. I’m still not ready to go long yet. I may miss a nice move. Have decided to remain on sidelines and wait until Monday to see what happens as i don’t trust the bull case yet based on the GLD daily chart (and weekly chart for that matter) and COT report out just now with open interest decreasing yet again.
Not unusual for the miners to bottom before gold. Still possible for gold to go lower and the miners to hold the recent low. Sure looks like reversal today though.
Gold Ichimoku Daily Analysis
Data as at 5 am ET, October 6
=========================
Gold price has almost fallen to the bottom cloud boundary at 1265.51. At the same time it is nearing an important Fibonacci support, 1263.35, being the 61.8% retrace of the rise from 1205.41 to 1357.09. The ingredients for a reversal are there. It just might need some time as the tenkan-sen is still below the kijun-sen. Today could still be a day of consolidation. I would expect the trading volume to be light, being the eve of a long weekend in America.
However, if prices do break cloud support, the next stop would be at 1237.87, the 78.6% retrace. This would mean a deeper than usual second wave, but then many strong uptrends begin with a deep pullback.
My expectations are for the reversal to take place early next week. Monday is a US holiday, but the markets are not affected, only probably thinner volume. Furthermore, the Chinese market would resume trading after a one-week hiatus, and substantial changes should occur. Also, there are rumours perpetrated by the CIA of a possible provocation from the Rocket Man. The day after, October 10, happens to be the anniversary of the founding of the current political party, and what better way to celebrate it than with a big bang, at the same time taunting the hapless Dotard to boot. He will be fuming mad, but then America could do nothing, except for some wild rhetoric — all sound and fury, signifying nothing.
Ha ha, rocket man and dotard !!
The miners showed some strength today as gold made new lows and the miners did not. There’s still room for the miners to fall a little more and not make new lows while gold continues lower to new lows. This may be a sign that the bottom for gold is near.