The target for downwards movement was 1,256. Price has reached 1,260.72, 4.42 short of the target.
Summary: A low may be in place at least for the mid term for Gold. A breach of the channel on the hourly charts is required for confidence in this view. The fist target at 1,297, then 1,319 or possibly as high as 1,412.
Always trade with stops and invest only 1-5% of equity on any one trade.
New updates to this analysis are in bold.
Last monthly charts for the main wave count are here, another monthly alternate is here, and video is here.
Grand SuperCycle analysis is here.
The wave counts will be labelled first and second. Classic technical analysis will be used to determine which wave count looks to be more likely. In terms of Elliott wave structure the second wave count has a better fit and fewer problems.
FIRST ELLIOTT WAVE COUNT
WEEKLY CHART
There are more than 23 possible corrective structures that B waves may take, and although cycle wave b still fits well at this stage as a triangle, it may still be another structure. This wave count looks at the possibility that it may be a double zigzag.
If cycle wave b is a double zigzag, then current upwards movement may be part of the second zigzag in the double, labelled primary wave Y.
The target remains the same.
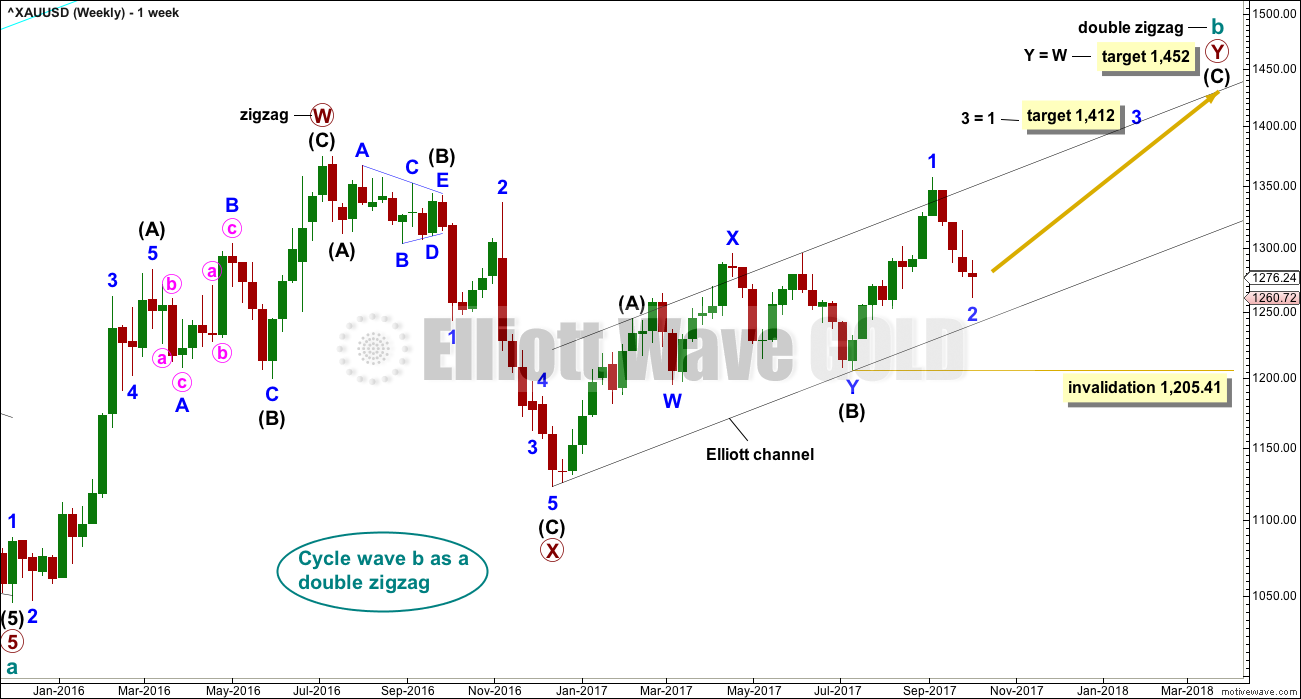
Within intermediate wave (C), no second wave correction may move beyond the start of its first wave below 1,205.41. However, prior to invalidation, this wave count may be discarded if price breaks below the lower edge of the black Elliott channel. If this wave count is correct, then intermediate wave (C) should not break below the Elliott channel which contains the zigzag of primary wave Y upwards.
There are two problems with this wave count which reduce its probability in terms of Elliott wave:
1. Cycle wave b is a double zigzag, but primary wave X within the double is deep and time consuming. While this is possible, it is much more common for X waves within double zigzags to be brief and shallow.
2. Intermediate wave (B) within the zigzag of primary wave Y is a double flat correction. These are extremely rare, even rarer than running flats. The rarity of this structure must further reduce the probability of this wave count.
DAILY CHART
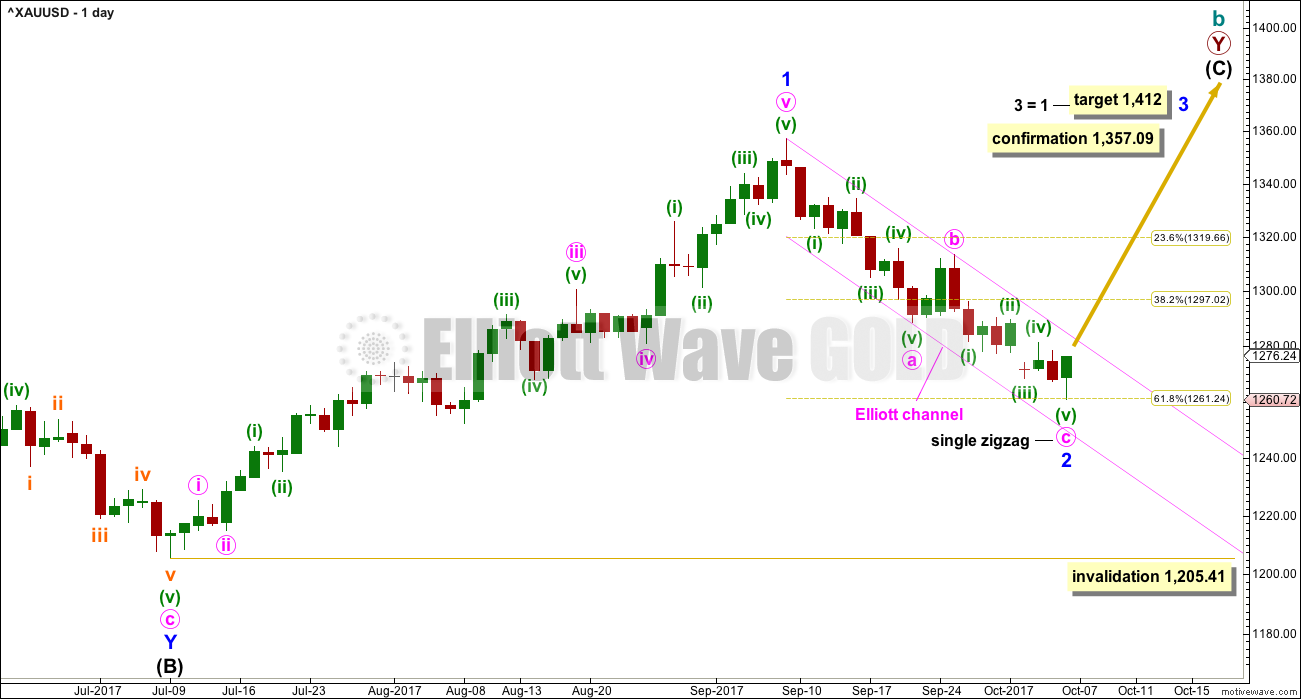
The analysis will focus on the structure of intermediate wave (C). To see details of all the bull movement for this year see daily charts here.
Intermediate wave (C) must be a five wave structure, either an impulse or an ending diagonal. It is unfolding as the more common impulse.
It is possible that minor waves 1 and now 2 may both be over. Minor wave 2 may have ended very close to the 0.618 Fibonacci ratio. If it continues lower, then minor wave 2 may not move beyond the start of minor wave 1 below 1,205.41.
Minor wave 1 lasted 44 days and minor wave 2 may have lasted 20 days, just one short of a Fibonacci 21.
HOURLY CHART
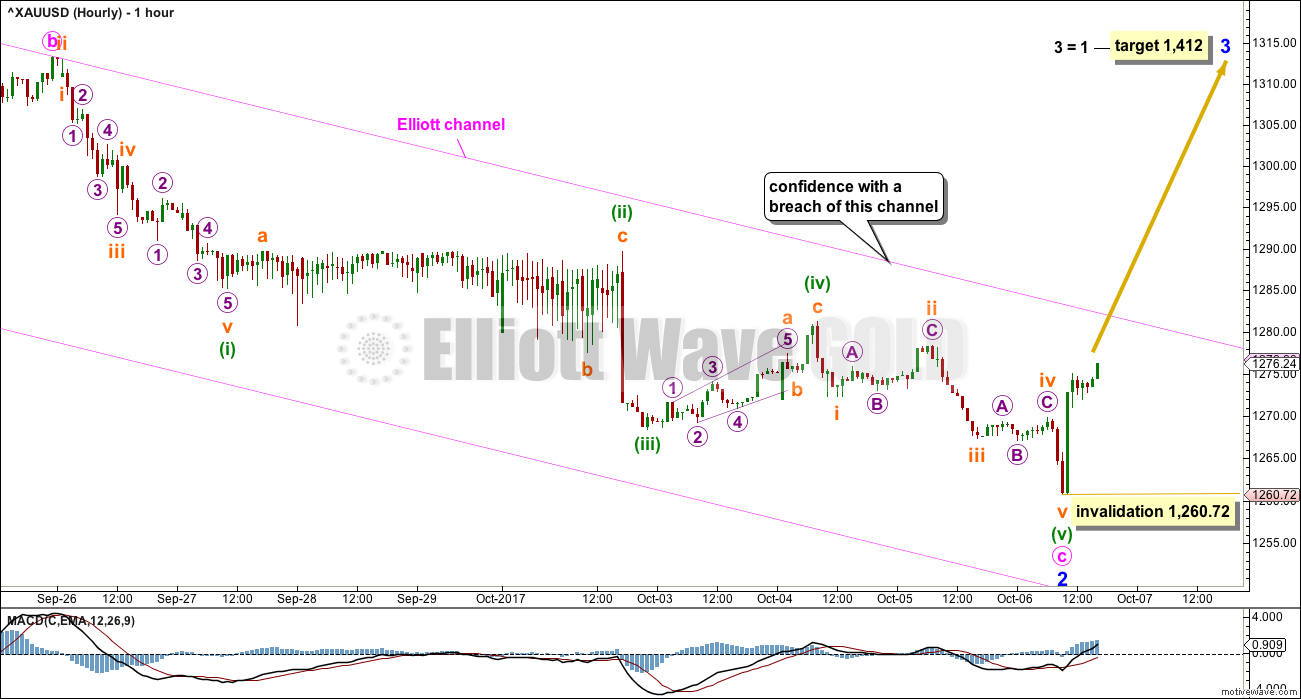
The hourly charts show the whole of minute wave c as a five wave impulse.
Minuette wave (ii) may have been some kind of flat or combination. Minuette wave (iv) does not overlap into minuette wave (i) price territory, so all Elliott wave rules are met.
Minuette wave (iii) exhibits strongest momentum.
Within minor wave 3, no second wave correction may move beyond its start below 1,260.72.
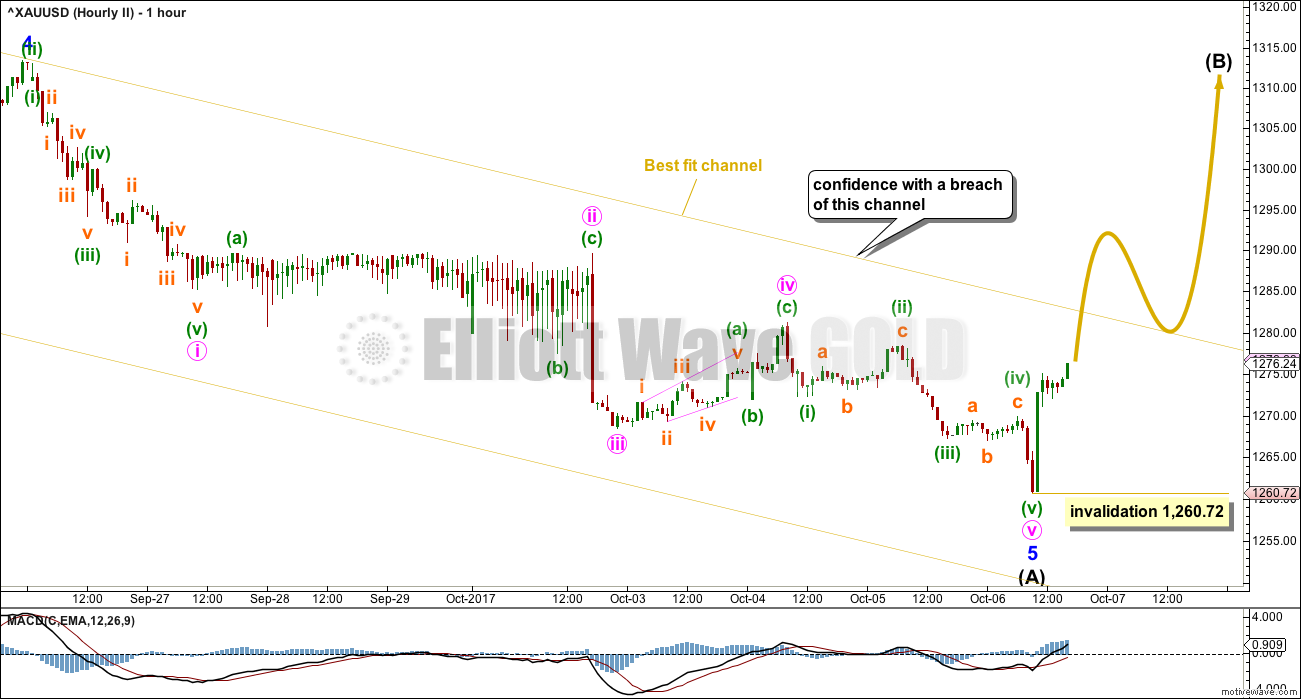
This wave count requires a breach of the channel to provide strong confidence that a low is in place.
The Fibonacci ratio of equality is used for the target for minor wave 3 because minor wave 1 was a long extension.
ALTERNATE HOURLY CHART
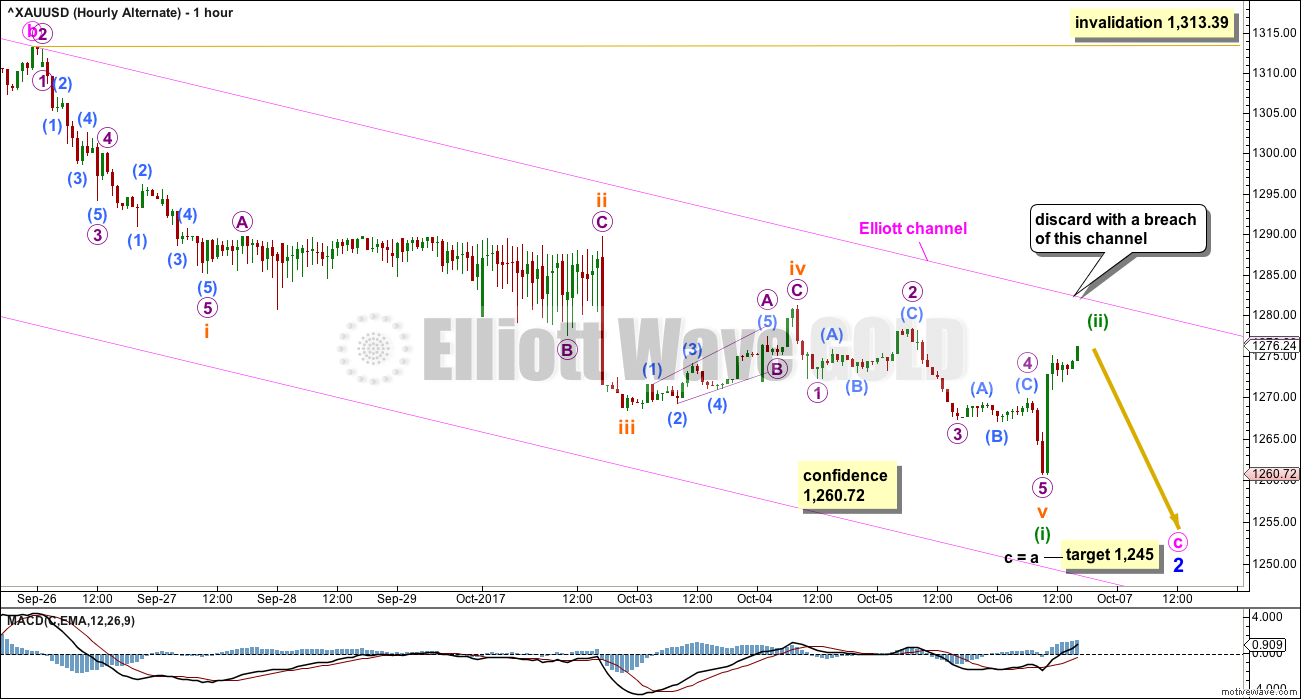
This alternate simply moves the degree of labelling within minute wave c all down one degree.
Because minuette wave (iii) within minute wave c is slightly shorter than minuette wave (i), and minuette wave (v) is shorter still, an alternate cannot be used which moves only the degree of labelling within the fifth wave down one degree. That would see any target violate the Elliott wave rule that states a third wave may not be the shortest.
This alternate has a target that looks to be not low enough. If price remains within the channel and continues lower, then when there is more structure within minute wave c the target would be recalculated.
SECOND ELLIOTT WAVE COUNT
WEEKLY CHART
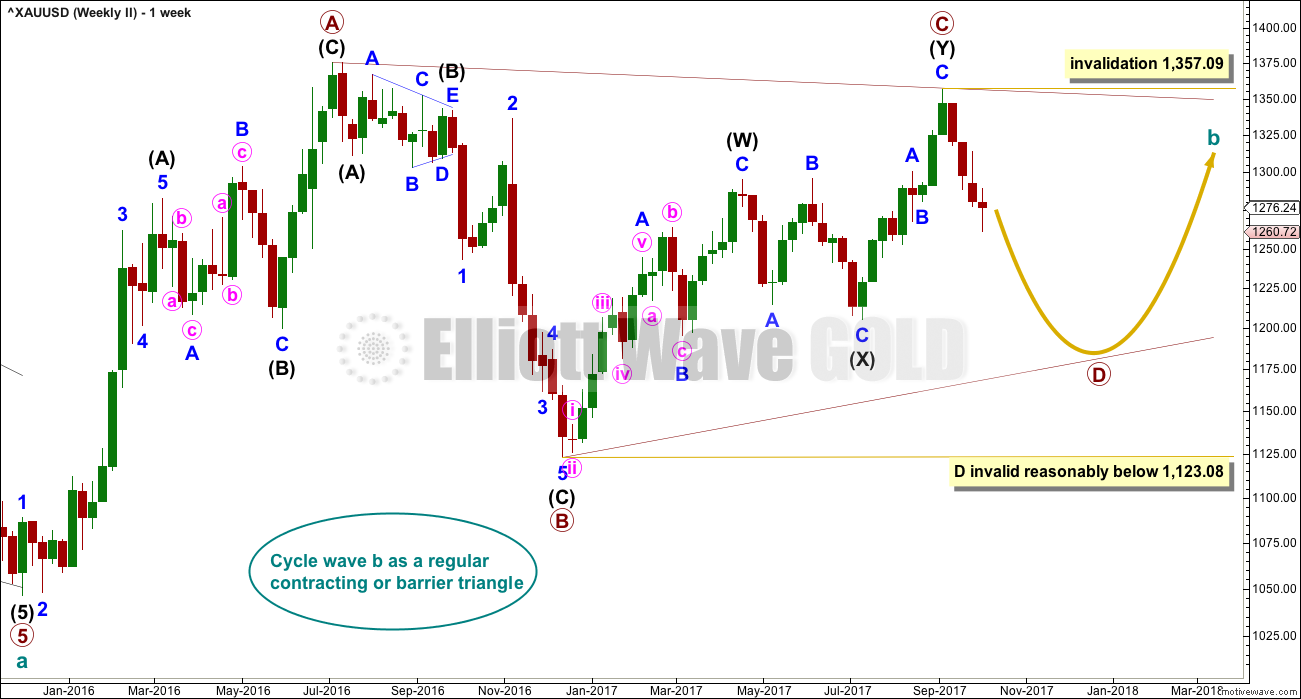
It is still possible that cycle wave b is unfolding as a regular contracting or barrier triangle.
Within a triangle, one sub-wave should be a more complicated multiple, which may be primary wave C. This is the most common sub-wave of the triangle to subdivide into a multiple.
Intermediate wave (Y) now looks like a complete zigzag at the weekly chart level.
Primary wave D of a contracting triangle may not move beyond the end of primary wave B below 1,123.08. Contracting triangles are the most common variety.
Primary wave D of a barrier triangle should end about the same level as primary wave B at 1,123.08, so that the B-D trend line remains essentially flat. This involves some subjectivity; price may move slightly below 1,123.08 and the triangle wave count may remain valid. This is the only Elliott wave rule which is not black and white.
Finally, primary wave E of a contracting or barrier triangle may not move beyond the end of primary wave C above 1,295.65. Primary wave E would most likely fall short of the A-C trend line. But if it does not end there, then it can slightly overshoot that trend line.
Primary wave A lasted 31 weeks, primary wave B lasted 23 weeks, and primary wave C lasted 38 weeks.
The A-C trend line now has too weak a slope. At this stage, this is now a problem for this wave count, the upper A-C trend line no longer has such a typical look.
Within primary wave D, no part of the zigzag may move beyond its start above 1,357.09.
DAILY CHART
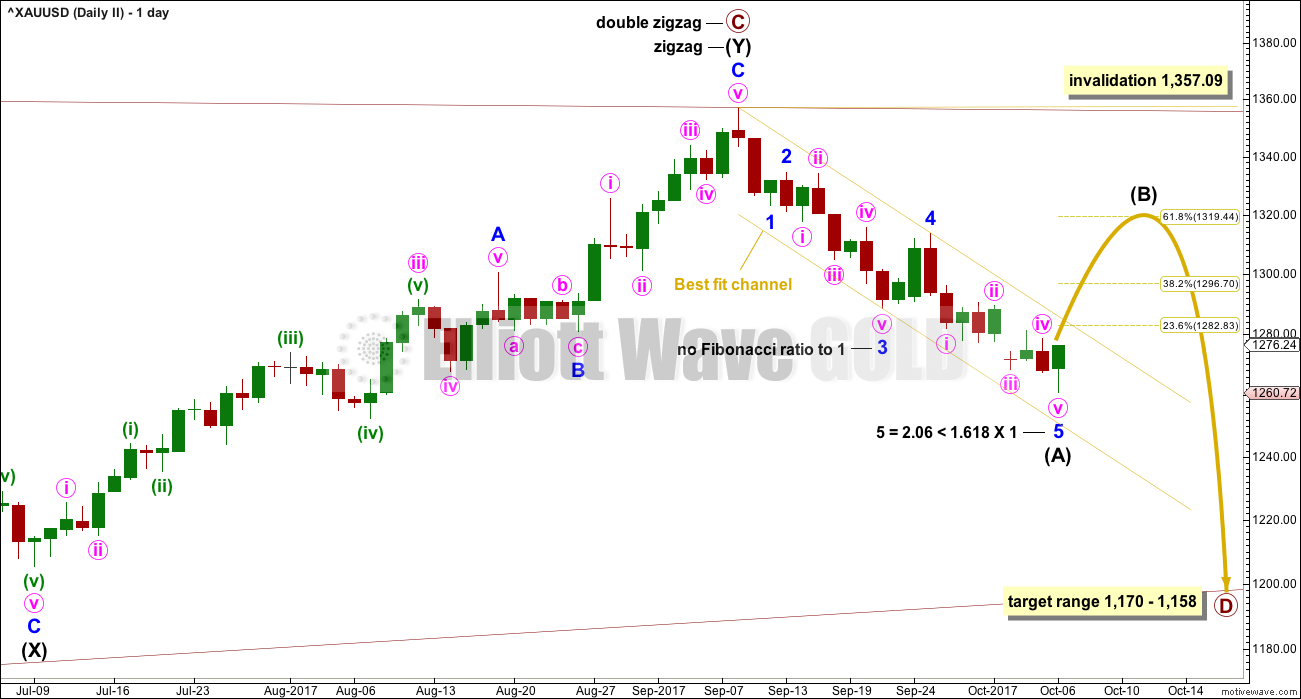
This second wave count expects the new wave down may be deeper and longer lasting than the first wave count allows for.
A common length for triangle sub-waves is from 0.8 to 0.85 the length of the prior wave. Primary wave D would reach this range from 1,170 to 1,158.
If primary wave C is correctly labelled as a double zigzag, then primary wave D must be a single zigzag.
Within the single zigzag of primary wave D, intermediate wave (A) is labelled as a complete impulse.
Intermediate wave (A) lasted 20 days, just one short of a Fibonacci 21. Intermediate wave (B) may be about the same duration, so that this wave count has good proportions, or it may be longer because B waves tend to be more complicated and time consuming.
Intermediate wave (B) may be a sharp upwards zigzag, or it may be a choppy overlapping consolidation as a flat, triangle or combination.
HOURLY CHART
This wave count also now requires a breach of the channel for confidence. The first target for intermediate wave (B) would be the 0.382 Fibonacci ratio of intermediate wave (A) about 1,297. Thereafter, the 0.618 Fibonacci ratio would be the next target about 1,319. Both targets are equally as likely. B waves exhibit huge variety in structure and price behaviour; there is no typical Fibonacci ratio for them to retrace.
Within the first five up, no second wave correction may move beyond the start of its first wave below 1,260.72.
TECHNICAL ANALYSIS
WEEKLY CHART
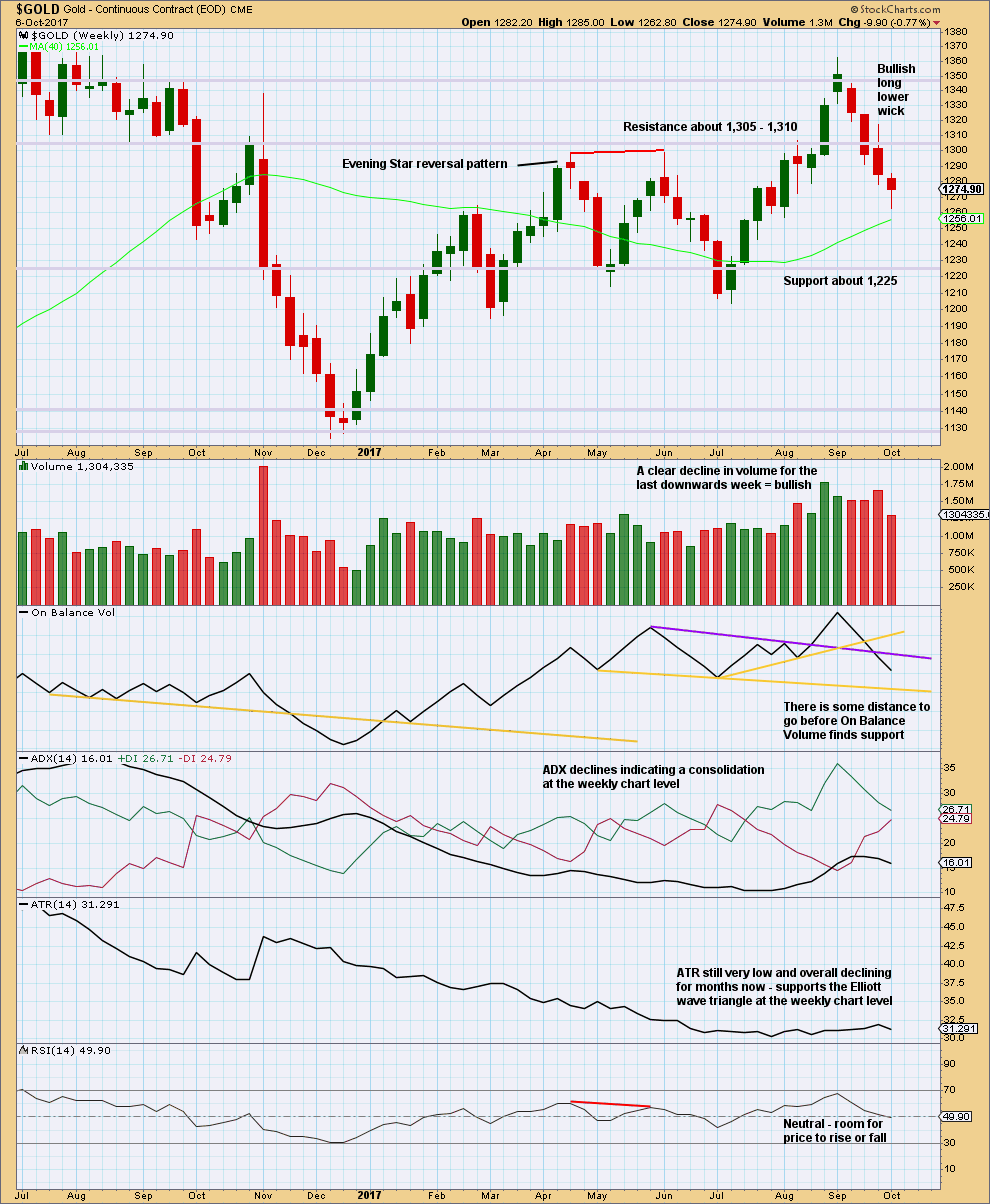
Click chart to enlarge. Chart courtesy of StockCharts.com.
The candlestick for this week is not a Hammer reversal pattern. The lower shadow must be at minimum twice the length of the real body and this one falls short. The long lower wick is still bullish though.
The lower wick with a decline in volume for downwards movement this week does look like at least an interim low is in place.
DAILY CHART
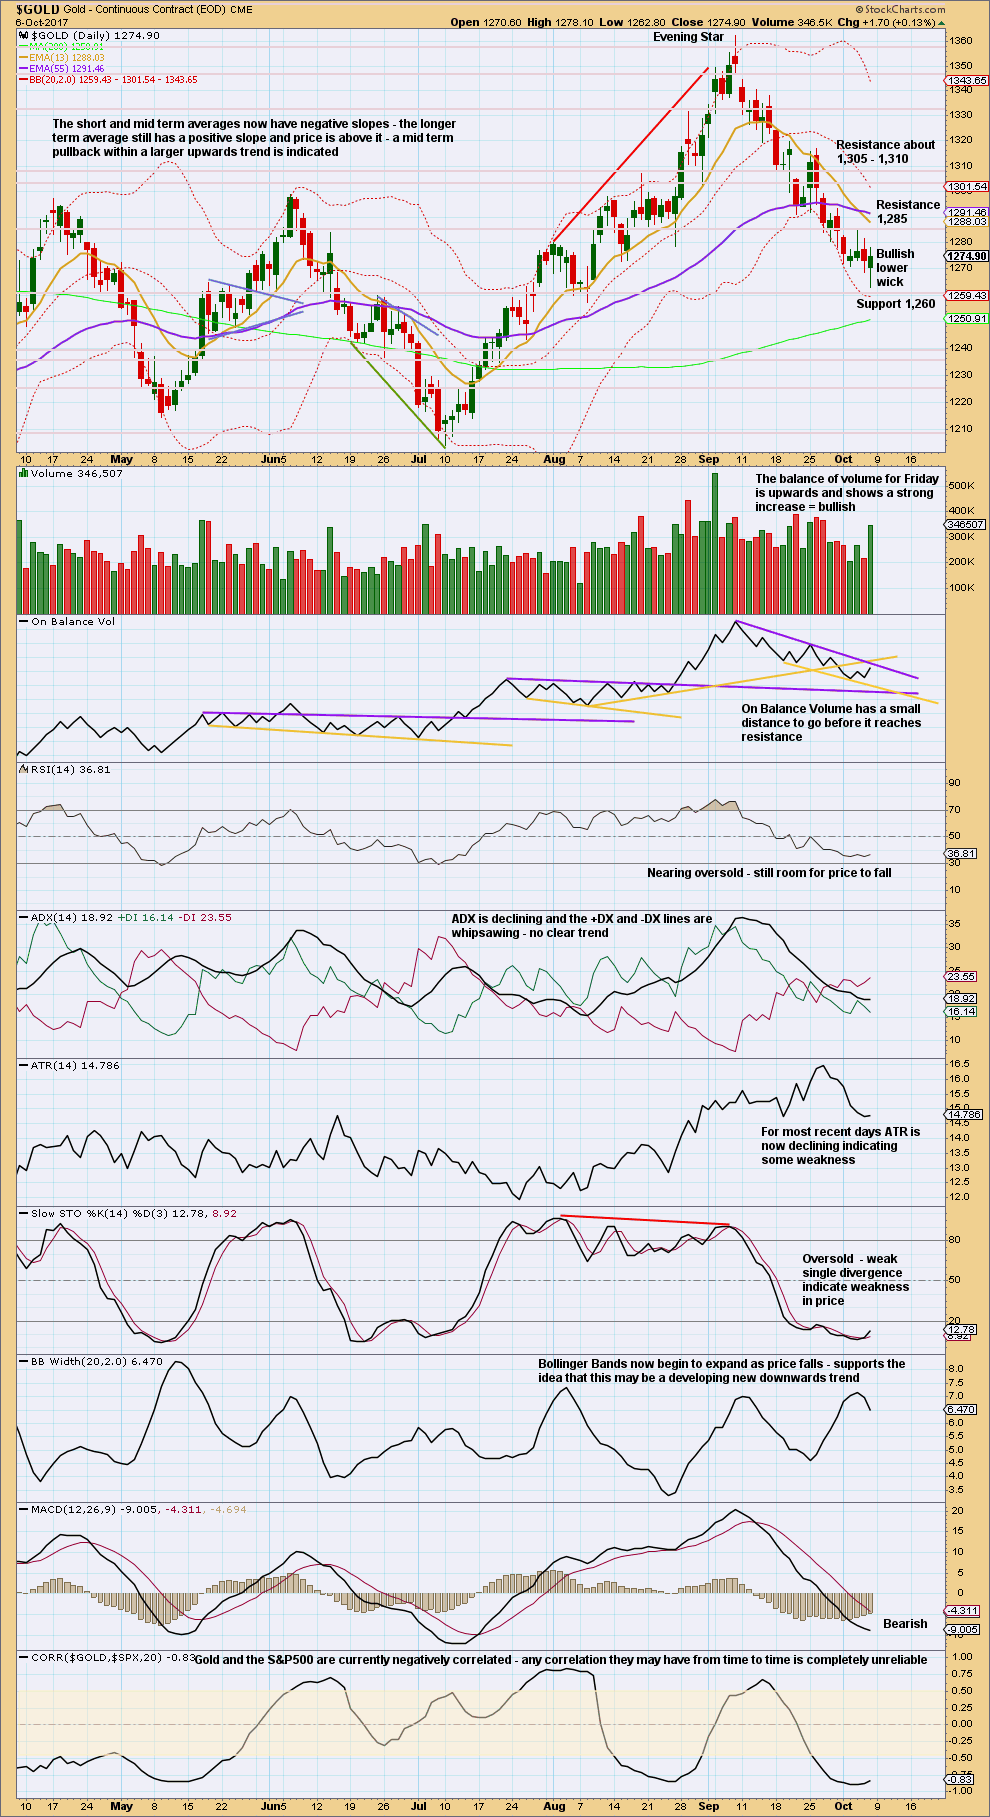
Click chart to enlarge. Chart courtesy of StockCharts.com.
A strong increase in volume for a day with the balance of volume upwards is bullish; in conjunction with a long lower candlestick wick, this looks like a low may now be in place at least for the short or mid term.
On Balance Volume is nearing resistance. This may serve to halt a rise in price and force a bounce to be more shallow.
The bottom line today for this analysis is a low is indicated as possible, but the channel on the hourly charts needs to be breached before confidence may be had in this view.
GDX
DAILY CHART
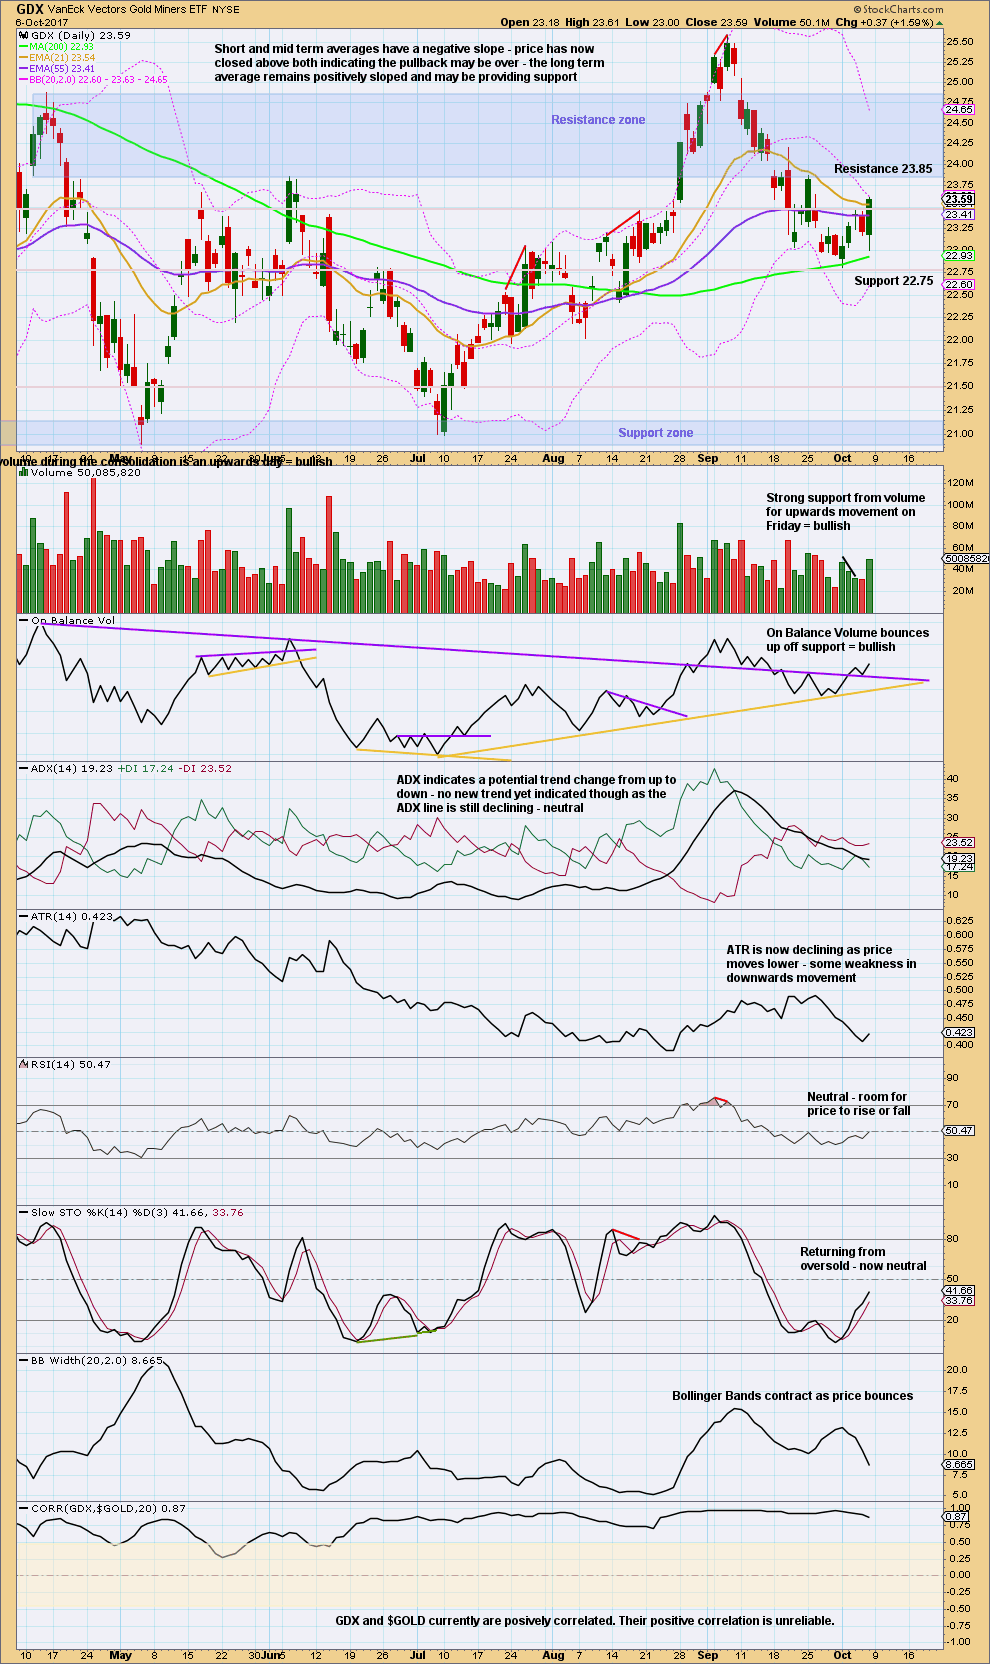
Click chart to enlarge. Chart courtesy of StockCharts.com.
The strong bullish candlestick for Friday is not a bullish reversal signal because it is not coming at the end of a downwards trend but instead comes within an upwards movement, which may or may not be a new bullish trend. But it is very bullish.
The long lower wick is bullish.
The last two signals from On Balance Volume are bullish. Give this indicator weight here. This supports the idea that a low is now in place for GDX.
Published @ 08:47 p.m. EST.

updated hourly II chart:
we have a breach of the channel and so may have confidence now that a low at least for the short / mid term is in for Gold
price spent some time in minute ii sitting about the upper trend line for a back test, that was an opportunity for a leisurely entry to go long folks
still not too bad a time, it has a long way up to go
there may be another big backtest in another day or so for minor B or minor 2 (depending on which wave count is correct at the daily chart level)
but for now, up and away!
Bitcoin
Lara you may ask Cesar to update/correct this step x step intro to b/s BTC.
My understanding of buying btc is as follows:
Correct me if I have missed a step.
1) First down load a wallet. That will establish your wallet ID.
2) Open an account with an exchange at Bitstamp/Coinbase/….
3) Wire transfer some money in you currency to fund the account.
4) Now ready to buy btc once fund shows up in account.
5) Once the btc bot & shows up in account one can send the btc to wallet a address.
6) BTC will safely reside in one’s wallet on computer or smart phone.
7) If you want to sell the btc than send partial btc to your btc exchange account address.
8) Once the btc shows up in your account on exchange one can sell the btc in the market.
And To buy and to sell BTC for cash, consider alternatives as:
http://www.uphold.com
http://www.bitquick.co
Disclaimer: I have not used these sites. Please explore.
awesome! thank you so much Papudi
Yes, I think that’s how it works from my understanding…. but I’ll ask Cesar to read and add his comment as he’s the one who’s done the research for us (us as in he and I that is)
Here’s the daily look:
https://www.tradingview.com/x/EfuaioQt/
How to get back annotation back on tradingview platform? I lost it?
Halfway down on the left side look for a little tab to click on. You must have hid the tools.
Dreamer,
Im excited that you are showing 30 for GDX by end of October. Do your charts reflect time?
Thanks,
Jennifer
I haven’t published this count in a while. Despite the deep wave E of the triangle, I think this count has a good look and meets all EW rules. If it is correct, price should move up strongly in a Minor degree 3rd wave for the next 3-4 weeks. You won’t want to miss this move.
https://www.tradingview.com/x/h5Nc8yhO/
Bullish hourly breakout!!!
https://www.tradingview.com/x/hItNALCe/
looking good dreamer. Missed my chance on Friday, so just watching for now. It hurts a lot to do so lol. I’ve decided to take a small shot at a market short instead, even though i have maybe the worst track record ever in trading SPY. Let’s see
Alan/Dreamer/And others:
One of the BEST bicoin people on the planet is ANDREA ANTONOPULOUS ! I advise you to listen to him ! Ideally subscribe to his channel and listen to ALL he says about BTC: it will blow your mind ! Here is the link:
https://youtu.be/l1si5ZWLgy0
More later.
Thanks Papudi. I was really ambivalent about bitcoin until the bankster Dimon started bad-mouthing it. His bank was busily scooping up bitcoin all the while he was trying to talk it down! 🙂
Thank you so much, Papudi. That is a fascinating introduction to the digital currency, a paradigm shift from the controlled and regulated fiat money that we use today.
Alan/Verne
Thanks.
When this speech was recorded market Cap was 14 billion but today it is $76 billion.
https://coinmarketcap.com/
Lara, any thoughts on this? 403 is not a fib #, but it seems to work here. I like the targets.
It looks a bit speculative, but it is entirely feasible.
Just a little deviation from our discussion of gold.
==============================
BitCoin Ichimoku Analysis
Data as at market close of October 6
==============================
I was feeling a bit energetic and in wanting something better to do, decided to take a look at BitCoin. I was intrigued by the volatility of this wild animal over the past couple of months. In the first half of September, BTC dropped from a high of 4792.27 to a low of 3505.71 in just a matter of two weeks. The next fortnight saw a rebound to 4383.51. Overall, in September, BTC has lost about 25% so far but made a huge recovery. So, what would the future hold?
Looking at the long-term trend, I surmise that we are now nearing the end of a cycle wave. The final drop is underway from 4792.27. The low of 3505.71 is the W wave, and the current rebound constitutes part of the X wave. I expect the X wave to end around 4540-4670. If the price breaks above this level with high momentum, it could make an expanded flat. A rejection, resulting in a dip lower, would see prices drop in 5 waves to a region most likely in the 2600s. That would wrap up the current cycle wave. I think this would play out by the end of the year. The next cycle wave may bring new highs, eclipsing the 4792.27 high. It would be a very lucrative trade, possibly more than 100% gains, and that very fast.
From an Ichimoku perspective, the tenkan-sen has just crossed the kijun-sen, indicating that the X wave will continue rising in the near-term. Price agrees as it sits above both lines. The kumo is green all the way until at least mid-November.
I’ve not traded BTC yet, but the technicals do indicate a killer gain. Anyone know a good and reliable trading house for BTC? I’ll greatly appreciate that.
Perhaps Lara could give us her enlightened views. Mine was done in somewhat of a hurry, and I could jolly well be completely out of whack. Yet, as I see it, this could be a trade of a lifetime, very profitable, and that very quickly — a trader’s dream.
I’m in agreement Alan.
I’ll be updating my BTC analysis over the weekend, and so thank you so much for adding your EW ideas and your Ichimoku analysis.
This could indeed be the trade of a lifetime, but the key is finding the right entry point because it is so highly volatile
so the rewards could be absolutely huge, but the risk is pretty big too
Cesar did some research and chose to open an account with BitStamp, I will ask him if he could please post a comment on how it works (I have not looked at it yet because we’re not ready to buy) in the BTC analysis when I do it
Thanks Lara for going out of the way to do a BTC analysis. I gratly appreciate that.
I wonder if CMC trades BitCoin, possibly BTC/USD or some other pair. I haven’t tried them as my trades are mainly with ETFs.
Alan,
My knowledge of Bitcoin trading is just from reading, although that may change at some point. Like you, I have been waiting for this large correction to play out. I don’t think you can trade any crypto currency through traditional brokers unless you use the one ETF that’s available now. Coinbase is one well known site for Cryptos.
If you don’t want to deal with a new account, and the required “wallets”, you can use the ETF, GBTC. Volume looks low, but may be sufficient given the high per share price. The ETF has it’s downfalls such as some tracking error and the limitations of trading traditional market hours when Bitcoin trades 24/7
I think Papudi is pretty knowledgeable on Bitcoin.
my CMC platform doesn’t have a BTC option 🙁
Thats why we opened a BitStamp account
If I may go back to the leaving positions open over the weekend point, does anyone know of any brokers which stay open over the weekend, which would avoid any gapping issues?
Lara is your broker specific to NZ?
Yes, I’m using CMC Markets and they don’t take clients in the USA 🙁
CMC Singapore likewise trades from 0600 Monday to 0400 Saturday, with a break from 0500-0600 on Tuesdays through Friday. So, most traders don’t leave positions open over the weekend. They don’t trade ETFs though.