
Last Elliott wave analysis expected upwards movement from Gold to begin the new week, which is exactly what has happened.
Summary: For the very short term, look out for a small pullback to about 1,277 – 1,275. Thereafter, look for the new upwards trend to continue.
The fist target is at 1,297, then 1,319 or possibly as high as 1,412.
This pullback may offer an entry opportunity to go long. Always trade with stops and invest only 1-5% of equity on any one trade.
New updates to this analysis are in bold.
Last monthly charts for the main wave count are here, another monthly alternate is here, and video is here.
Grand SuperCycle analysis is here.
The wave counts will be labelled first and second. Classic technical analysis will be used to determine which wave count looks to be more likely. In terms of Elliott wave structure the second wave count has a better fit and fewer problems.
FIRST ELLIOTT WAVE COUNT
WEEKLY CHART
Click chart to enlarge.
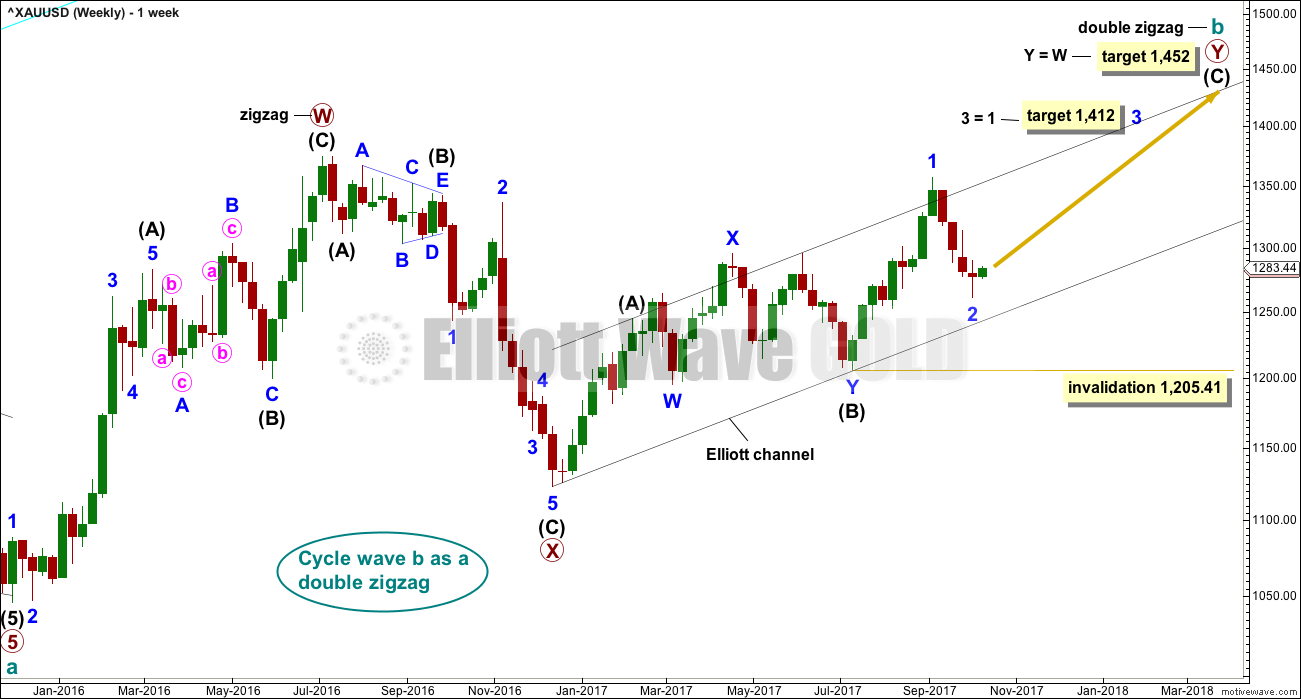
There are more than 23 possible corrective structures that B waves may take, and although cycle wave b still fits well at this stage as a triangle, it may still be another structure. This wave count looks at the possibility that it may be a double zigzag.
If cycle wave b is a double zigzag, then current upwards movement may be part of the second zigzag in the double, labelled primary wave Y.
The target remains the same.
Within intermediate wave (C), no second wave correction may move beyond the start of its first wave below 1,205.41. However, prior to invalidation, this wave count may be discarded if price breaks below the lower edge of the black Elliott channel. If this wave count is correct, then intermediate wave (C) should not break below the Elliott channel which contains the zigzag of primary wave Y upwards.
There are two problems with this wave count which reduce its probability in terms of Elliott wave:
1. Cycle wave b is a double zigzag, but primary wave X within the double is deep and time consuming. While this is possible, it is much more common for X waves within double zigzags to be brief and shallow.
2. Intermediate wave (B) within the zigzag of primary wave Y is a double flat correction. These are extremely rare, even rarer than running flats. The rarity of this structure must further reduce the probability of this wave count.
DAILY CHART
Click chart to enlarge.
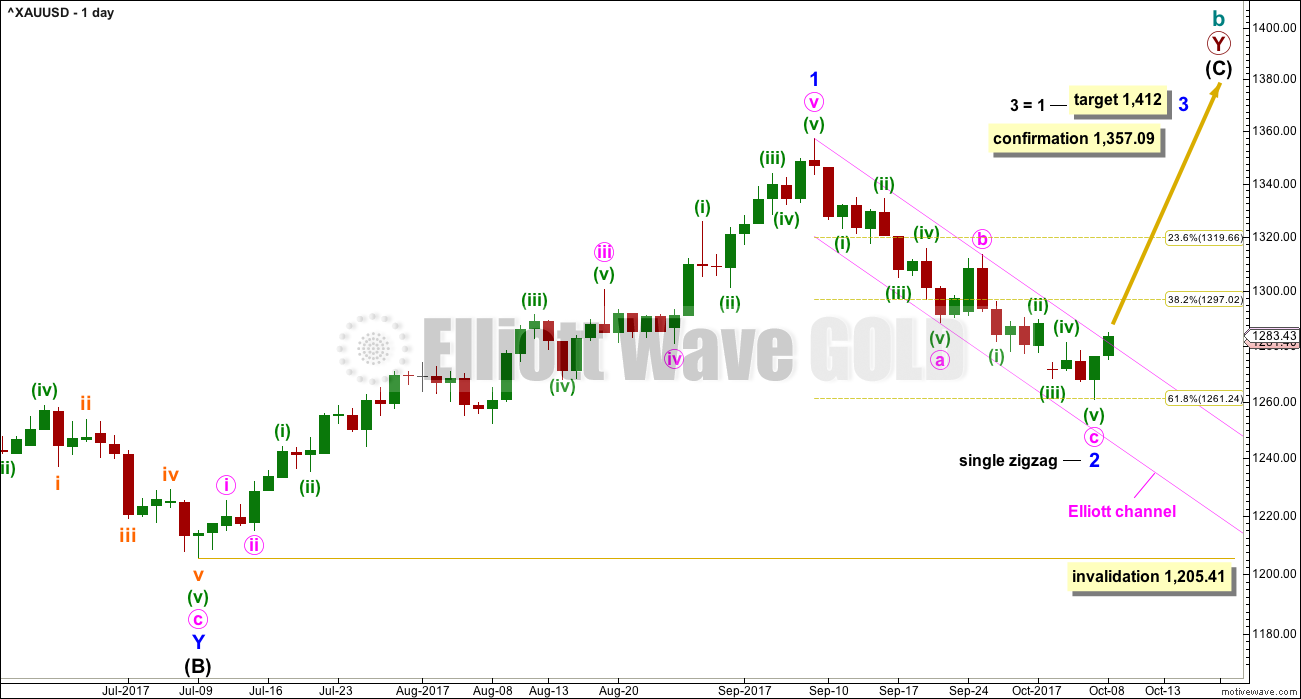
The analysis will focus on the structure of intermediate wave (C). To see details of all the bull movement for this year see daily charts here.
Intermediate wave (C) must be a five wave structure, either an impulse or an ending diagonal. It is unfolding as the more common impulse.
It is possible that minor waves 1 and now 2 may both be over. Minor wave 2 may have ended very close to the 0.618 Fibonacci ratio. If it continues lower, then minor wave 2 may not move beyond the start of minor wave 1 below 1,205.41.
Minor wave 1 lasted 44 days and minor wave 2 may have lasted 20 days, just one short of a Fibonacci 21.
HOURLY CHART
Click chart to enlarge.
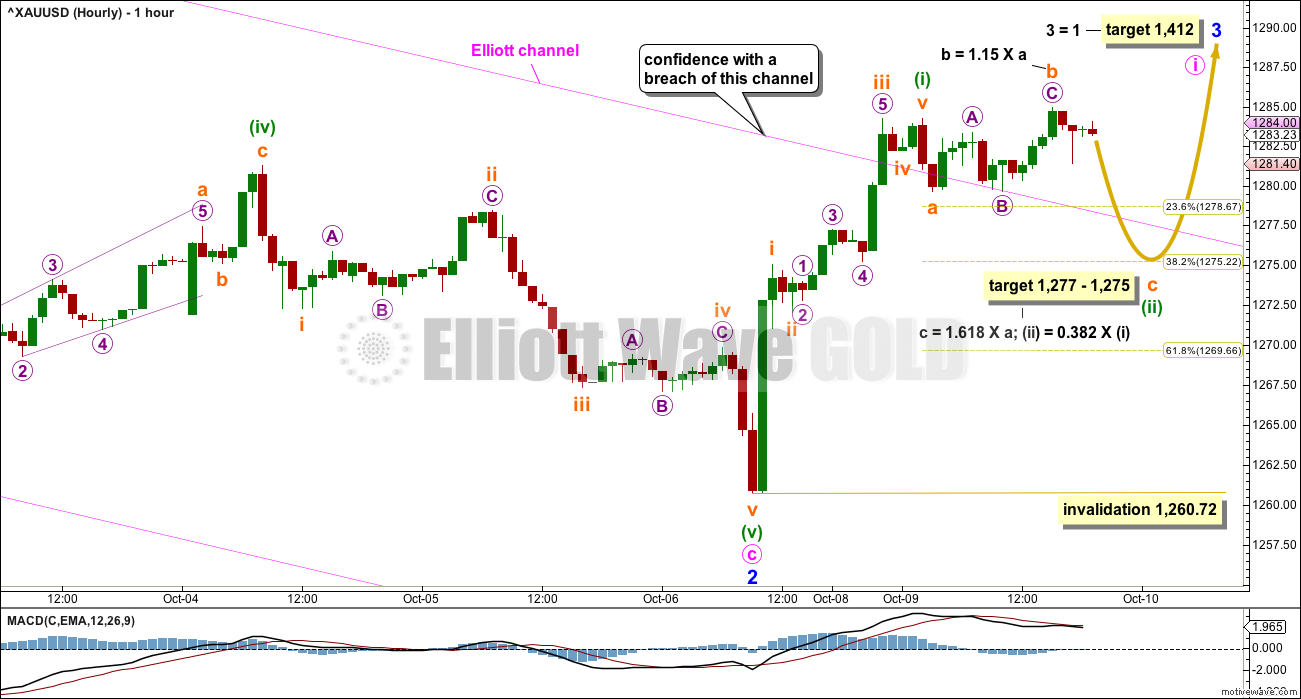
Hourly charts today focus on new upwards movement.
A first five up looks to be complete. This should be followed by a three down. When considering weakness today in upwards movement, it looks like a small downwards reaction may develop here. This may be a small second wave correction.
The upper edge of the pink Elliott channel may now provide support. This may force minuette wave (ii) to be more shallow than normal for a second wave. Minuette wave (ii) may be unfolding as a very common expanded flat correction.
The target is calculated at two wave degrees and should have a reasonable probability.
Minuette wave (ii) may not move beyond the start of minuette wave (i) below 1,260.72.
When the small correction of minuette wave (ii) is complete, then upwards movement should exhibit an increase in momentum and have support from volume.
SECOND ELLIOTT WAVE COUNT
WEEKLY CHART
Click chart to enlarge.
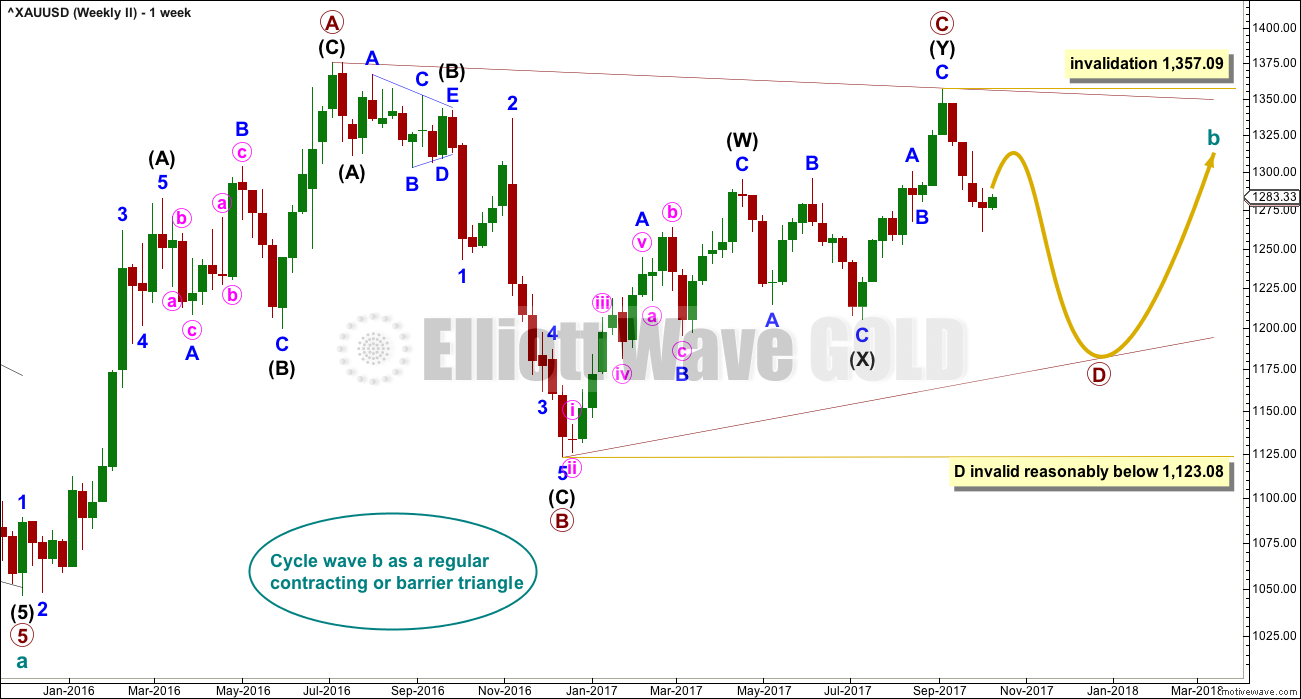
It is still possible that cycle wave b is unfolding as a regular contracting or barrier triangle.
Within a triangle, one sub-wave should be a more complicated multiple, which may be primary wave C. This is the most common sub-wave of the triangle to subdivide into a multiple.
Intermediate wave (Y) now looks like a complete zigzag at the weekly chart level.
Primary wave D of a contracting triangle may not move beyond the end of primary wave B below 1,123.08. Contracting triangles are the most common variety.
Primary wave D of a barrier triangle should end about the same level as primary wave B at 1,123.08, so that the B-D trend line remains essentially flat. This involves some subjectivity; price may move slightly below 1,123.08 and the triangle wave count may remain valid. This is the only Elliott wave rule which is not black and white.
Finally, primary wave E of a contracting or barrier triangle may not move beyond the end of primary wave C above 1,295.65. Primary wave E would most likely fall short of the A-C trend line. But if it does not end there, then it can slightly overshoot that trend line.
Primary wave A lasted 31 weeks, primary wave B lasted 23 weeks, and primary wave C lasted 38 weeks.
The A-C trend line now has too weak a slope. At this stage, this is now a problem for this wave count, the upper A-C trend line no longer has such a typical look.
Within primary wave D, no part of the zigzag may move beyond its start above 1,357.09.
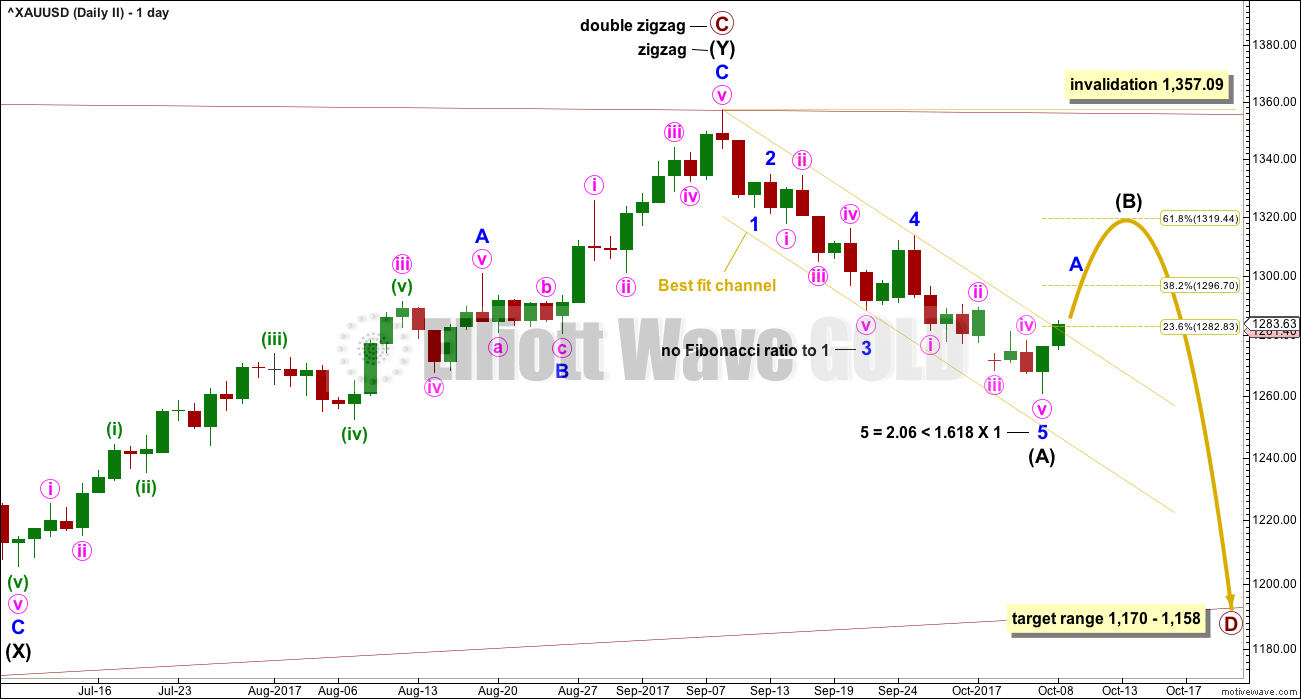
DAILY CHART
Click chart to enlarge.
This second wave count expects the new wave down may be deeper and longer lasting than the first wave count allows for.
A common length for triangle sub-waves is from 0.8 to 0.85 the length of the prior wave. Primary wave D would reach this range from 1,170 to 1,158.
If primary wave C is correctly labelled as a double zigzag, then primary wave D must be a single zigzag.
Within the single zigzag of primary wave D, intermediate wave (A) is labelled as a complete impulse.
Intermediate wave (A) lasted 20 days, just one short of a Fibonacci 21. Intermediate wave (B) may be about the same duration, so that this wave count has good proportions, or it may be longer because B waves tend to be more complicated and time consuming.
Intermediate wave (B) may be a sharp upwards zigzag, or it may be a choppy overlapping consolidation as a flat, triangle or combination.
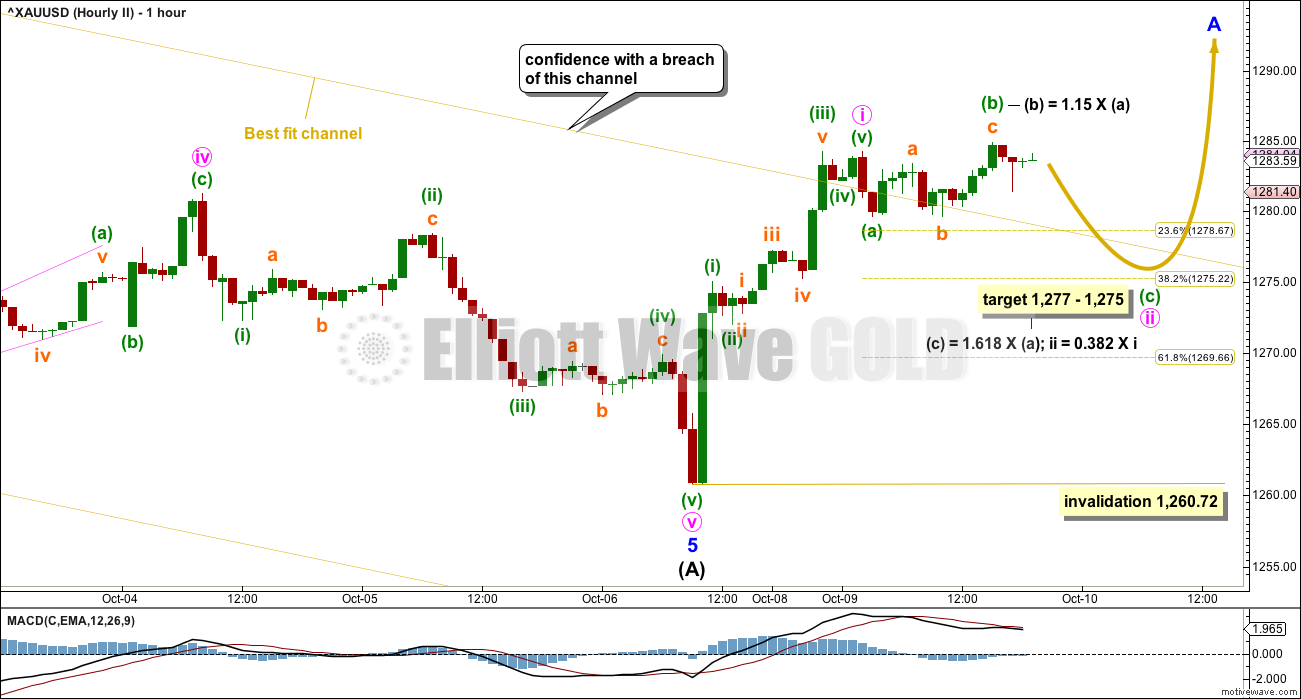
HOURLY CHART
Click chart to enlarge.
Minor wave A may subdivide as a five wave structure if intermediate wave (B) unfolds as an impulse. Minor wave A may also subdivide as a zigzag or flat correction if intermediate wave (B) unfolds as a flat, combination or triangle.
A movement at intermediate degree should begin with a five up at the hourly chart level. At this time, this may be incomplete; only wave 1 of the first five up may be complete.
The labelling within intermediate wave (B), including the degree of labelling, may change as it unfolds. It is impossible to tell until at or near to completion of intermediate wave (B) what structure it has taken.
B waves should exhibit weakness. If upwards movement over this next week exhibits any of the following, then a B wave may be the reason: lack of support from volume, declining ATR, divergence with price and Stochastics, or divergence with price and RSI.
The first target for intermediate wave (B) would be the 0.382 Fibonacci ratio of intermediate wave (A) about 1,297. Thereafter, the 0.618 Fibonacci ratio would be the next target about 1,319. Both targets are equally as likely. B waves exhibit huge variety in structure and price behaviour; there is no typical Fibonacci ratio for them to retrace.
TECHNICAL ANALYSIS
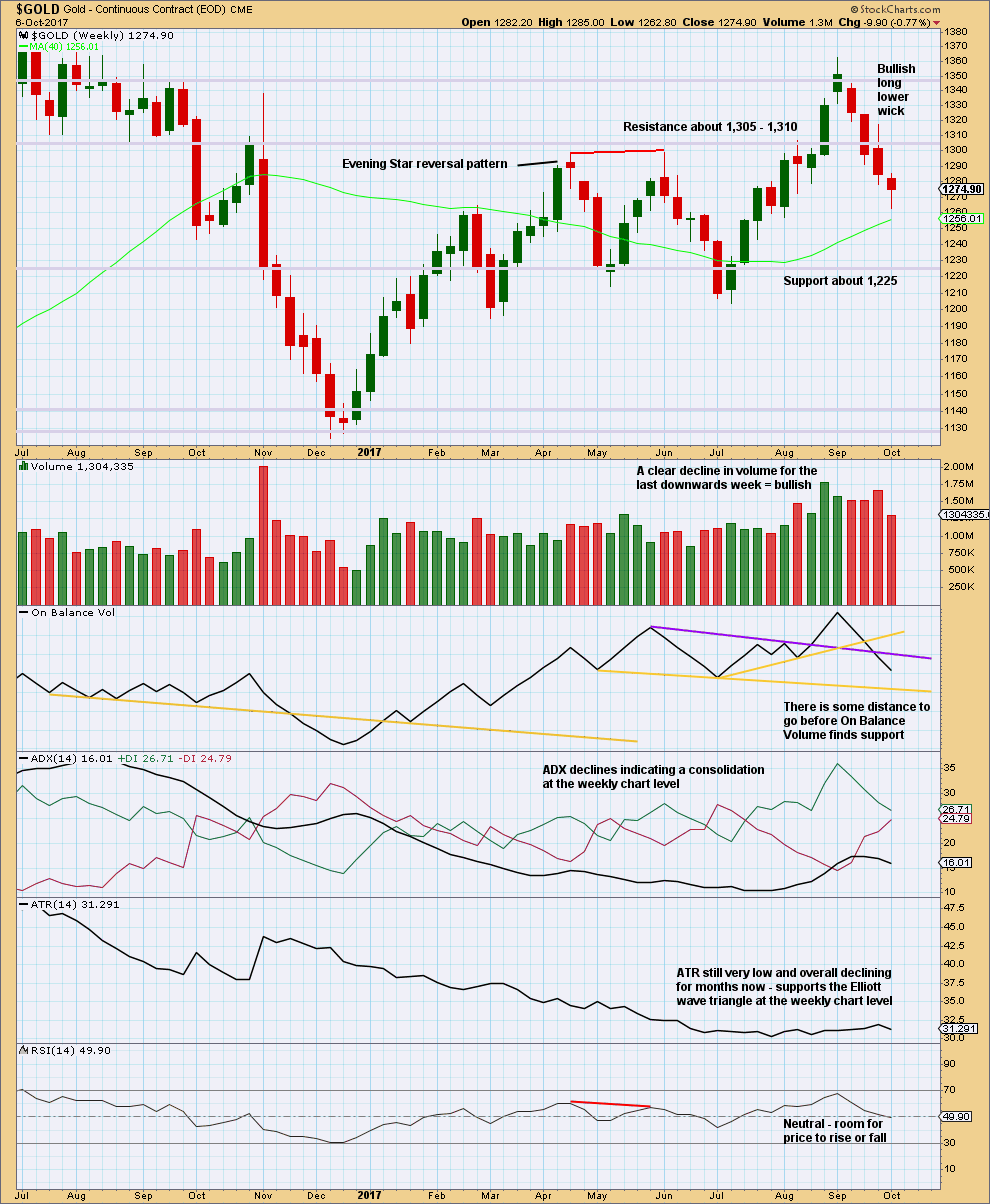
WEEKLY CHART
Click chart to enlarge. Chart courtesy of StockCharts.com.
The candlestick for last week is not a Hammer reversal pattern. The lower shadow must be at minimum twice the length of the real body and this one falls short. The long lower wick is still bullish though.
The lower wick with a decline in volume for downwards movement last week does look like at least an interim low is in place.
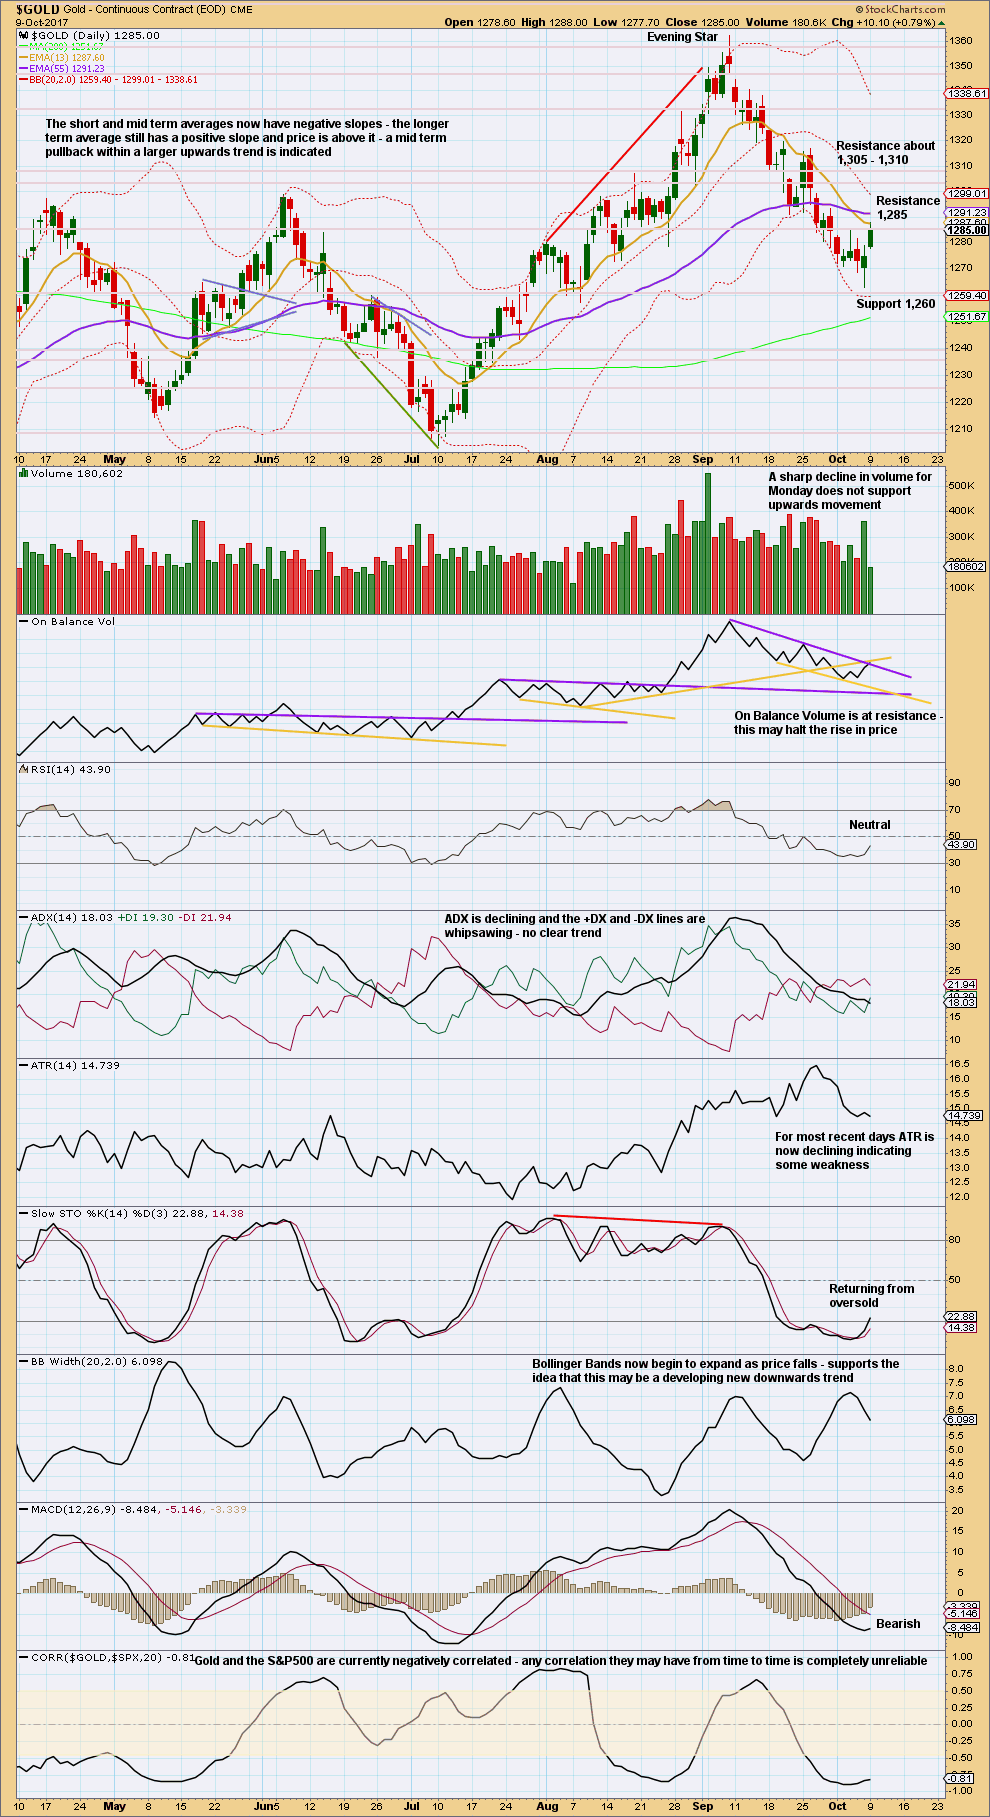
DAILY CHART
Click chart to enlarge. Chart courtesy of StockCharts.com.
A downwards day tomorrow is suggested by a sharp decline in volume today, a slightly long upper candlestick wick, and resistance for On Balance Volume. Look for support about 1,260.
GDX
DAILY CHART
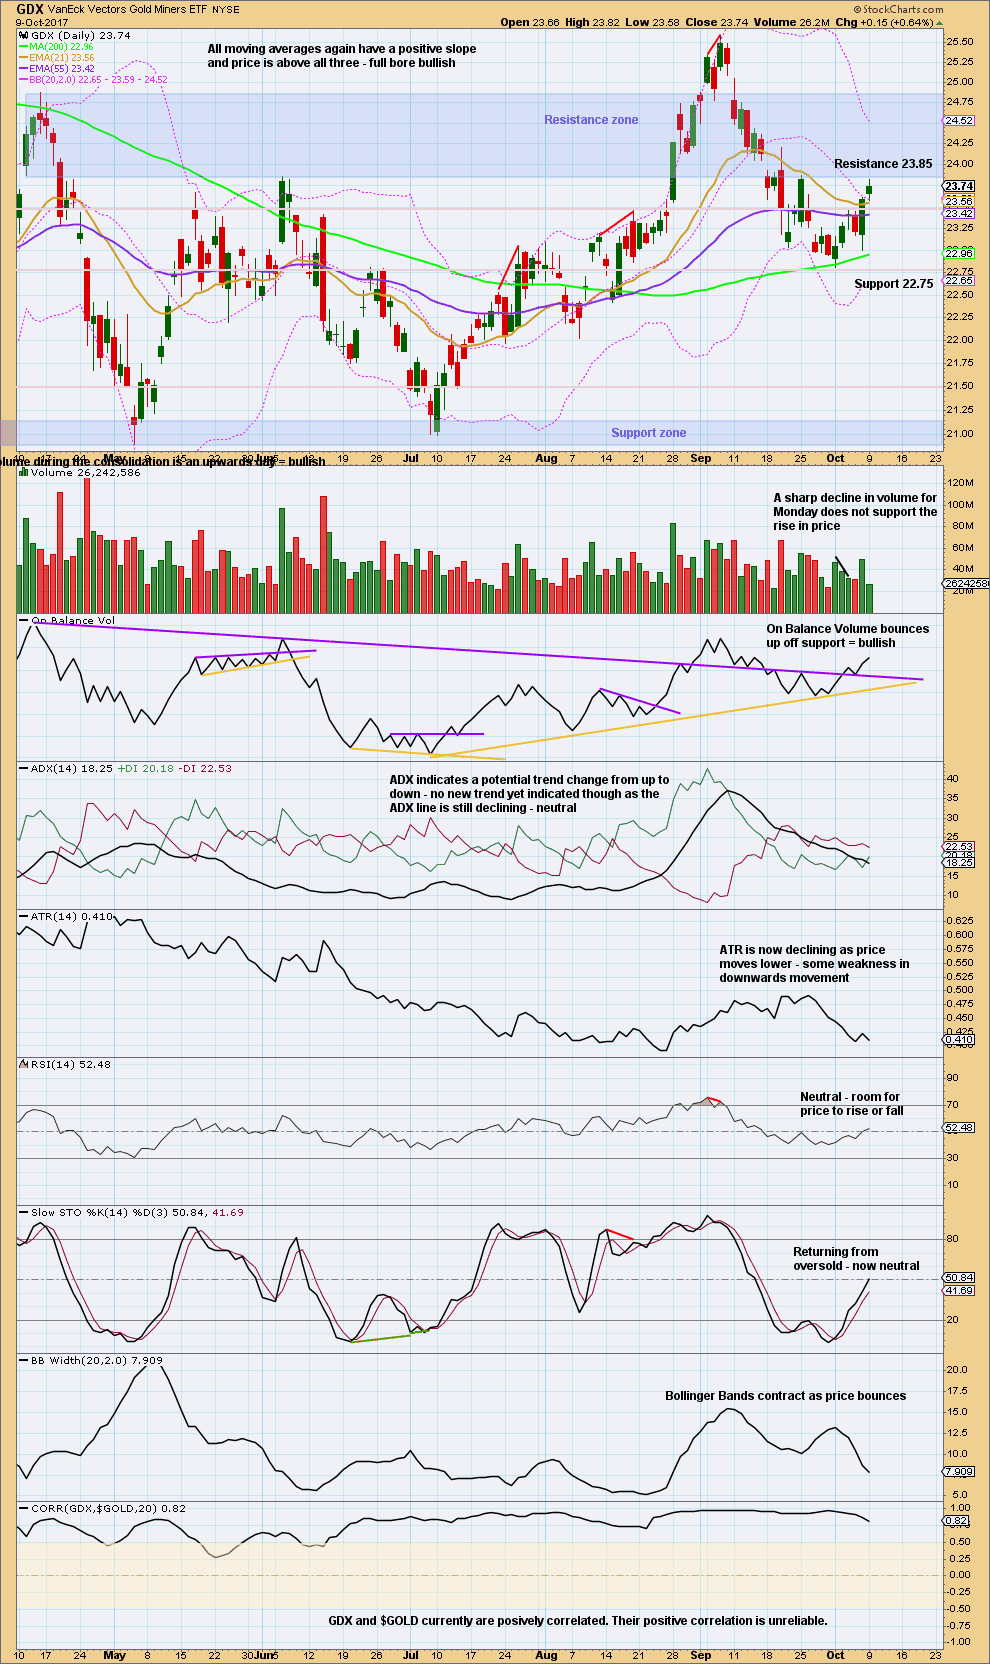
Click chart to enlarge. Chart courtesy of StockCharts.com.
A small spinning top candlestick and a sharp decline in volume today suggest a downwards day tomorrow also for GDX.
The purple trend line on On Balance Volume may offer support now and force any pullback here to be relatively shallow.
Published @ 08:35 p.m. EST.
So far so good, except we didn’t see another pullback to again test support at the yellow line.
If my labelling here is correct then minute iii is shorter than minute i. This will limit minute v to no longer than equality with minute iii at 1,302.33, which is a very strong area of resistance now.
OR…
I need to move the degree of labelling within minute iii down one degree and this is only minuette (i) of minute iii impulse. Which is why the invalidation point is at the start of minute iii and not the high of minute i. If this is only another first wave which should be labelled minuette (i) then the current small pullback should be labelled minuette (ii) and it may not move beyond the start of minuette (i) below 1,279.62.
Either way, the five up is incomplete. Look for more upwards movement. It may end prior to 1,302.33.
When a five up is done we shall be expecting a more time consuming pullback or consolidation for a second or B wave. The invalidation point for that idea will be all the way back down at 1,260.72. If anyone is not positioned long yet that should offer a good entry point. But it does required quite a lot of patience.
JNUG/NUGT/JDST/DUST combo used to move 8%-10% with 10-12 points move in gold till last year. No easy money money this year 🙂
You think that’s bad, try shorting the stock market lolol. When there is a legitimate sell signal, it just goes sideways instead of down. There is no such thing as down for SPY.
Add another trade to the loss column for me there. Coming back to gold where I can at least make some money once in a while lol
Sadly this has been the case for quite some time. The equities markets have become a place of smoke and mirrors where it is difficult to distinguish the real from the contrived. All kinds of signals appear to be broken with a feverish determination on the part of central banks to arrest every attempt to correct by this market. The illusion will eventually end and true price discovery will re-assert itself.
Yeah it’s just in a massive bull market, and who knows it might be entering a parabolic vertical stage like many analysts are saying. I’m not so sure about that, but in hindsight, it was a foolish move. It was a bet against the major trend, even if it was just for a quick swing. The only thing i did right was keep the loss very small. But i’m going to stay away from there for a while. Again lol
The stock market is in a very good bull trend. Trading with the trend is much easier to make money than trying to trade the small counter trend movements within it.
One possible scenario
https://www.tradingview.com/x/bRWagd7g/
Thanks. Looks good to me.
Yep. Me too.
Now that the gold price has broken above the 4-hour cloud, it gives confidence of an uptrend. Prices would test the top cloud boundary when it pulls back in Subminuette 2, and I reckon it would be a good entry point. I myself will continue to load up on my longs there. Good luck folks.
Ichimoku Gold Daily Analysis
Data as at 5:15 am ET, October 10
============================
Gold price continues to rise, moving past 1288.88, the point at which Subminuette B = 2 times Subminuette A. Both Lara’s counts have probably to be reworked. I think that Minuette 2 had been a rather quick ABC completing at 1279.62, the point which Lara placed her Subminuette B. The current rise is part of Minuette 3. The whole structure for Minuette 3 can also be brought down one degree such that the current rise is part of Subminuette 1. The implications of this is that there is no further drop in a second wave; prices will continue to rise all the way from here.
Let’s look at the technicals for some clues. The 4-hour Ichimoku chart shows that the tenkan-sen has crossed strongly above the kijun-sen. Prices are trading above these two lines and they would next be testing the cloud resistance (top cloud boundary) at 1290.86. Breaking above the 4-hour cloud will be an important short-term confirmation. Strong support is at the bottom cloud boundary, 1275.94.
It is my belief that the next leg up towards 1400/1420/1450 has already begun. I surmise also that the target will be reached before the end of November. It could be earlier if Rocket Man and Dotard cranked the war machine. Rocket Man could be playing mind games: October 9 came and went and there was nary a sign of a missile. Perhaps he is playing the same strategy as the market: when everyone expects an event to happen, it will always be the exact opposite.
Alan,
I agree with you that a strong Minor degree 3rd wave up is in progress. Similar to you, I see the next 3-4 weeks moving up strongly to the 1,400+ target where Minor 4 will arrive.
This is a great timeframe to buy and hold. Unfortunately too many are gun shy due to all the sideways movement over the last year + and will miss this move up or will try to daytrade it and get left behind on some big overnight moves to the upside.
Thanks for your analysis. Much appreciated!
Thanks Dreamer. I’m glad that we think alike.
The miners have taken the lead in the uptrend, which is the classical start of a bull run. Third waves are the best for trading, and I agree with you that this is a relatively short timeframe to collect profits.
Alan,
I am not disagreeing with you or questioning you. I am just seeking knowledge.
I have read the same sentiment, miners lead gold, on other forums, and somebody else said this a few days ago on this forum as well. May I bug you to help me understand the logic behind this, please?
If iPhone price goes up, then Apple shares could be expected to go up, because Apple will make larger profits. Similar fashion, gold should go up first and then miners should go up, correct? However, in reality, everywhere they say that miners (producers) lead gold (product)? Why?
Thank you very much.
Lara,
Education idea: Setting targets and when is it appropriate to look at extended targets, say above 1.618…
Thanks,
Thanks Dreamer! Another excellent idea 🙂
Thank you Dreamer. Yes, please and thank you Lara.
It seems Lara is spot on: https://www.edelsoninstitute.com/gold-silver/next-buying-opportunity-in-precious-metals-gold/?sc=WAV-E
So far so good…
I would prefer the second Elliott wave count actually. It still looks like a large triangle is completing.
Thx for sharing this interesting post. I found cycle analysis is also quite useful, but it requires certain level of expertise to do it right…