
A breach of the channel on the 4th of October on the main daily Elliott wave count indicated a deeper pullback was most likely underway. Thereafter, price has moved lower as the alternate Elliott wave count expected.
Summary: Oil may have had a trend change. The next wave down has a target at 34.38 in the first instance, and it may be as low as 13.00. It should last several months.
New updates to this analysis are in bold.
MONTHLY ELLIOTT WAVE COUNT
Click chart to enlarge.
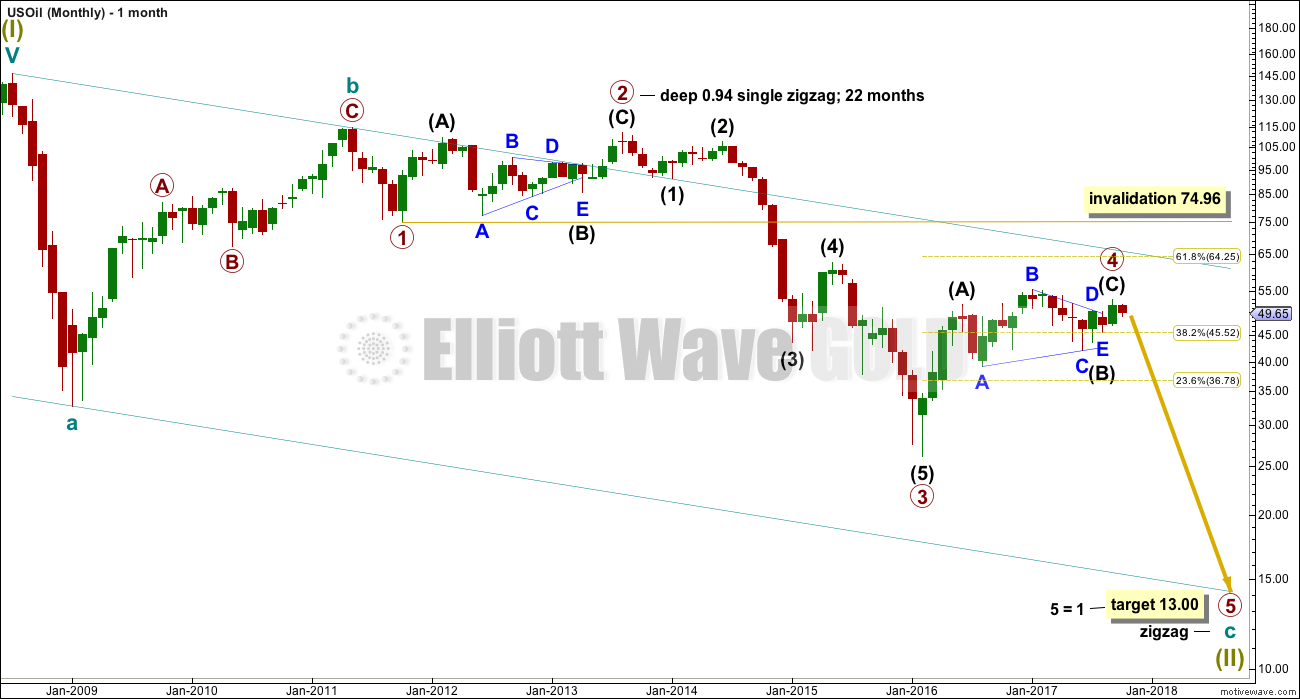
Within the bear market, cycle wave b is seen as ending in May 2011. Thereafter, a five wave structure downwards for cycle wave c begins.
Primary wave 1 is a short impulse lasting five months. Primary wave 2 is a very deep 0.94 zigzag lasting 22 months. Primary wave 3 is a complete impulse with no Fibonacci ratio to primary wave 1. It lasted 30 months.
There is alternation in depth with primary wave 2 very deep and primary wave 4 relatively shallow. There is inadequate alternation in structure, both are zigzags. So far primary wave 4 has lasted 19 months. So far there is good proportion between primary waves 2 and 4.
Primary wave 4 may not move into primary wave 1 price territory above 74.96.
WEEKLY ELLIOTT WAVE COUNT
Click chart to enlarge.
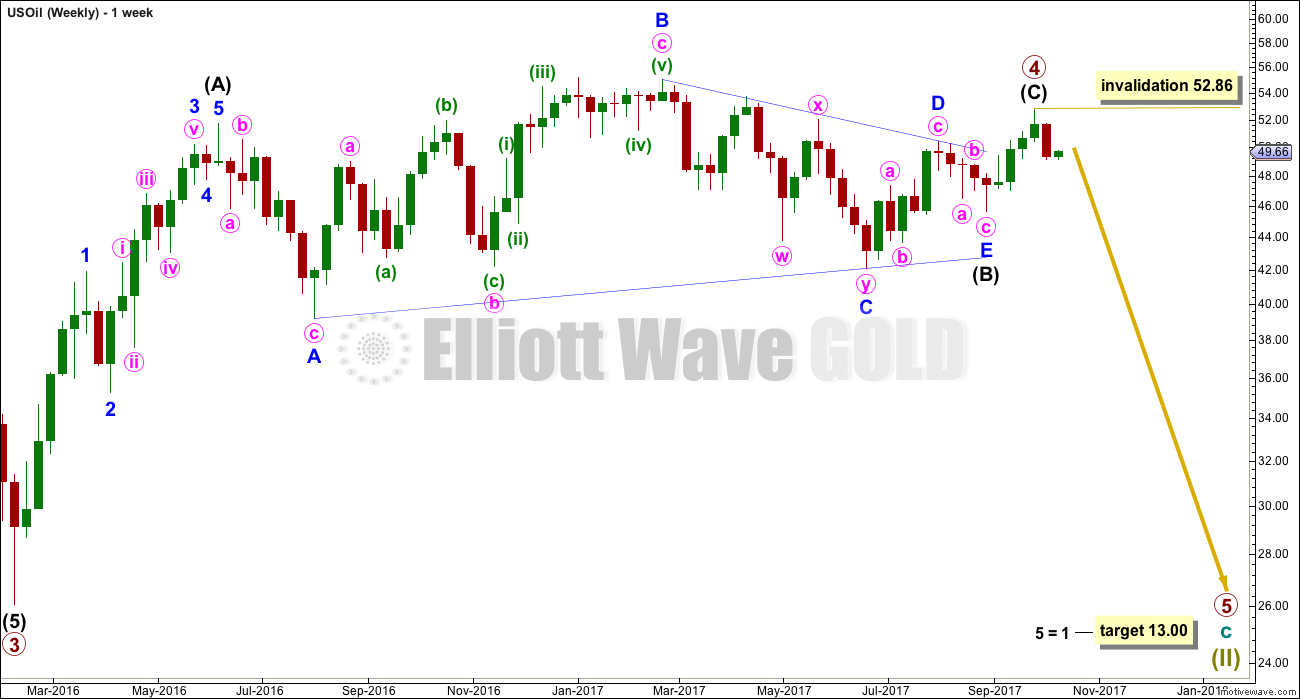
This wave count now sees primary wave 4 now complete as a relatively shallow zigzag. Primary wave 2 lasted 22 months. If primary wave 4 is over at the last high, it would have lasted 19 months giving the wave count good proportions at the weekly and monthly chart levels.
Intermediate wave (A) will subdivide as a five wave impulse. Intermediate wave (B) fits as a running contracting triangle. Intermediate wave (C) has moved above the end of intermediate wave (A) at 51.67 avoiding a truncation. There is no Fibonacci ratio between intermediate waves (A) and (C).
Within primary wave 5, no second wave correction may move beyond its start above 52.86.
The target uses the most common Fibonacci ratio for a fifth wave, so it should have a reasonable probability.
DAILY ELLIOTT WAVE COUNT
Click chart to enlarge.
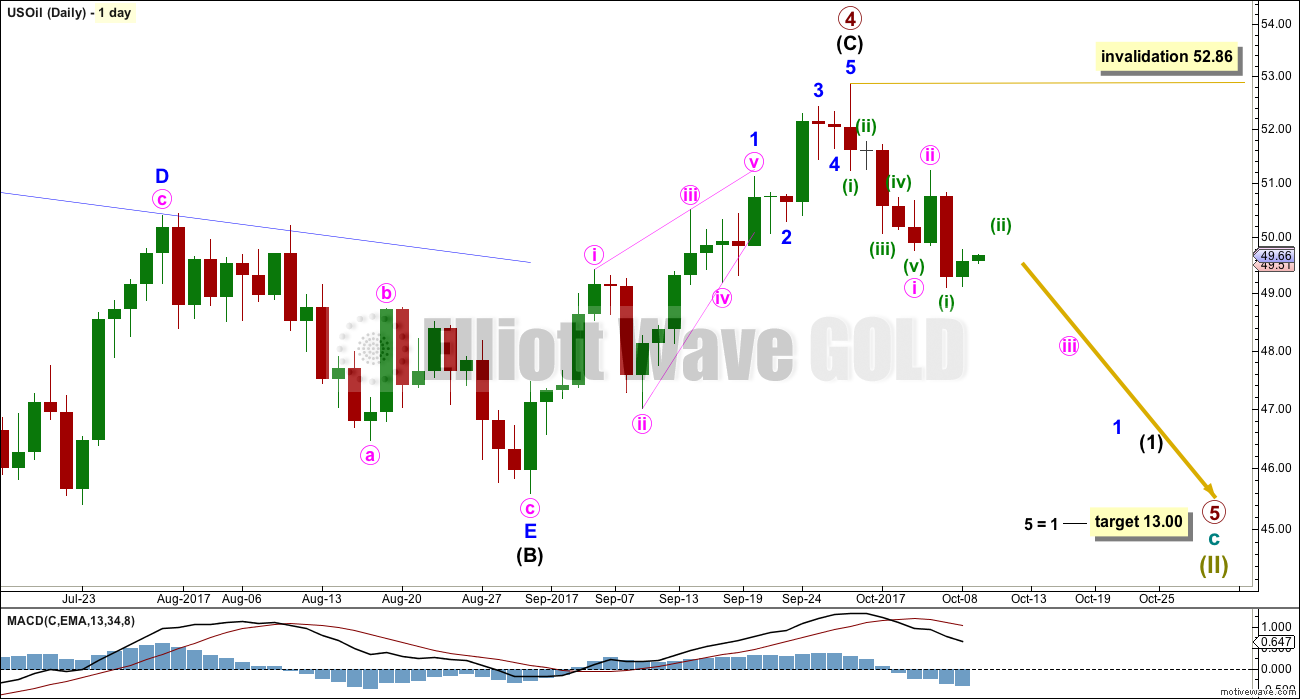
Intermediate wave (C) may be seen as a complete five wave structure.
The first wave is incomplete within primary wave 5 down. No second wave correction may move beyond its start above 52.86.
ALTERNATE WEEKLY ELLIOTT WAVE COUNT
Click chart to enlarge.
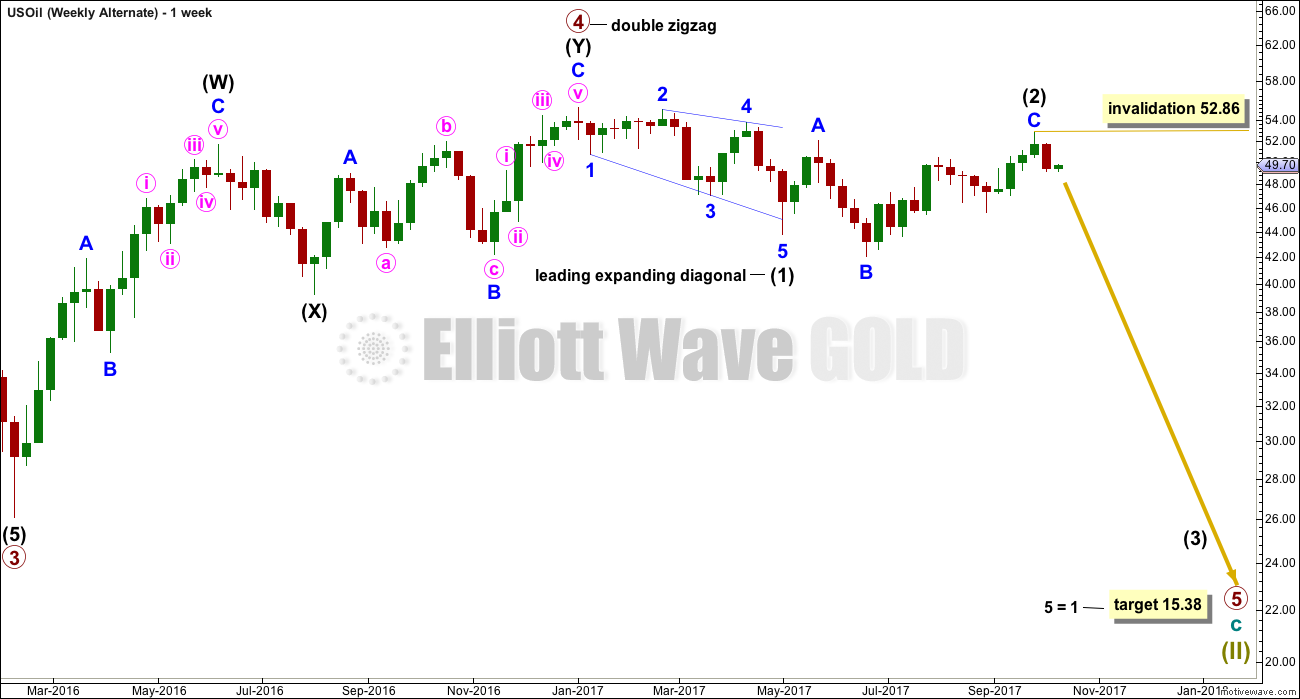
This alternate wave count considers the possibility that primary wave 4 ended earlier.
Primary wave 5 may have begun with a leading expanding diagonal for intermediate wave (1). Intermediate wave (2) may be a complete expanded flat correction.
Within intermediate wave (3), no second wave correction may make a new high above its start above 52.86.
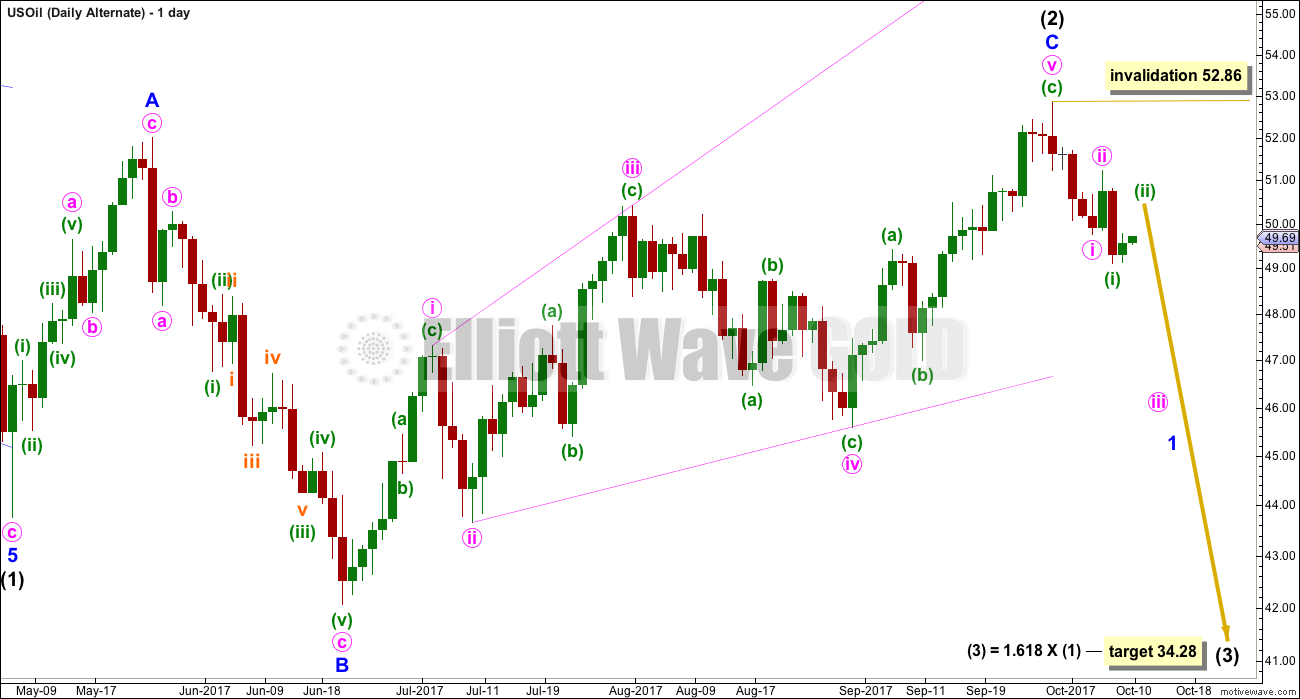
ALTERNATE DAILY ELLIOTT WAVE COUNT
Click chart to enlarge.
Intermediate wave (2) fits so far as an expanded flat correction that may now be complete.
Minor wave C may be another expanding diagonal, this one ending. Within ending diagonals, all sub-waves must subdivide as zigzags and the fourth wave should overlap first wave price territory.
Minute wave v must be longer than minute wave iii within an expanding diagonal, so that the rule regarding wave lengths is met. This rule is met.
Minor wave C has moved above the end of minor wave A at 52.00 avoiding a truncation and a very rare running flat.
The most common Fibonacci ratio is used to calculate a target for intermediate wave (3).
TECHNICAL ANALYSIS
DAILY CHART
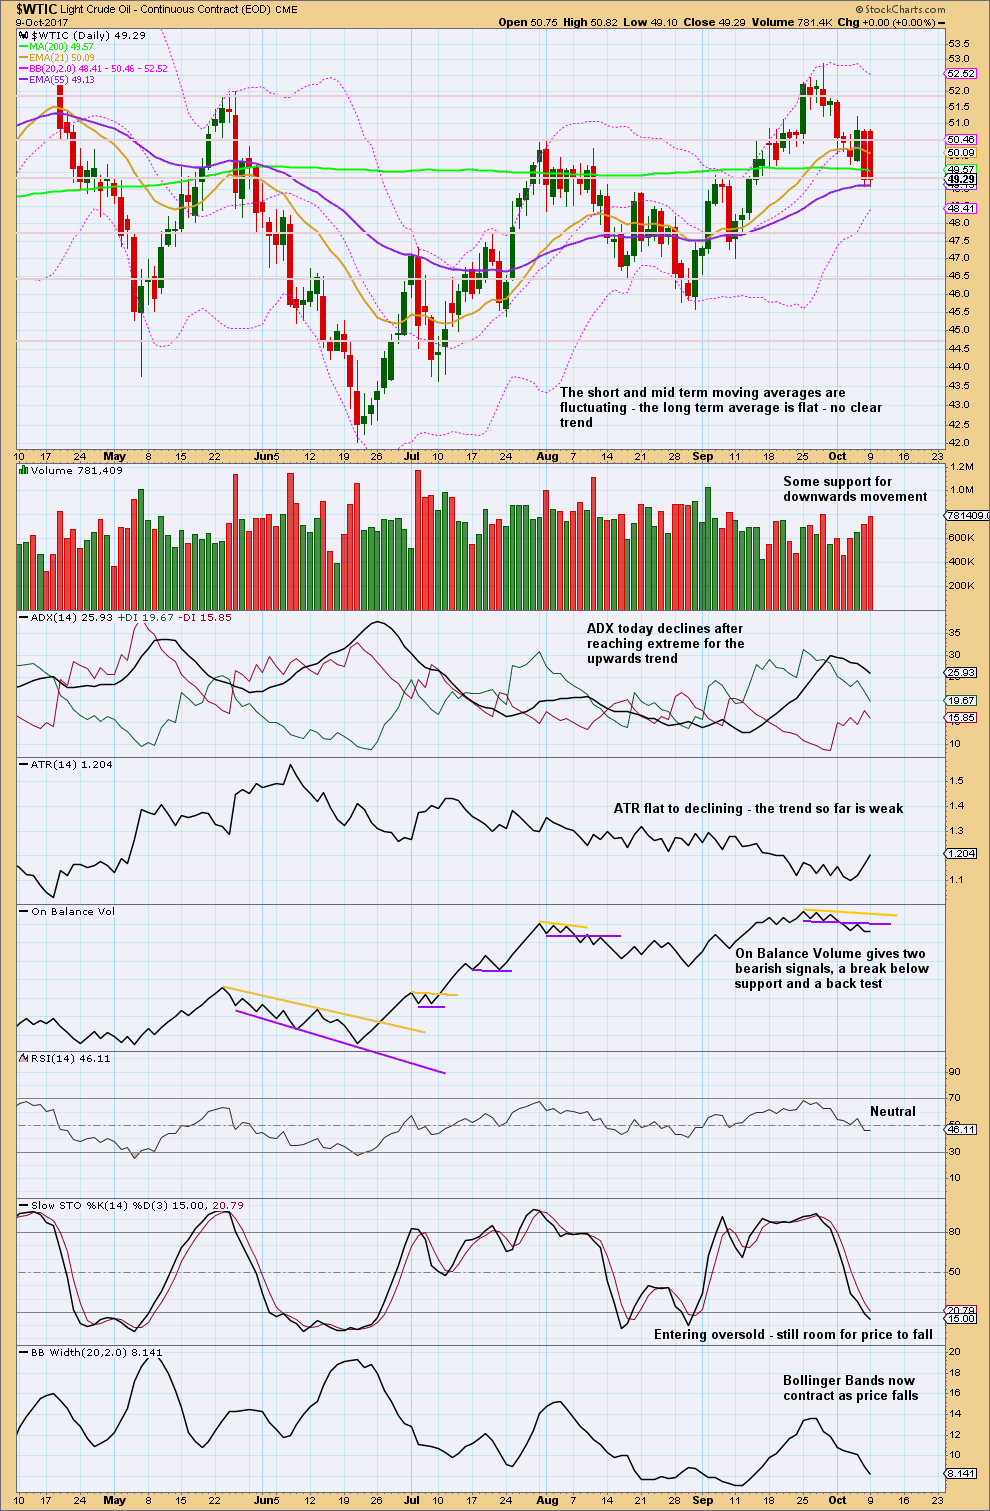
Click chart to enlarge. Chart courtesy of StockCharts.com.
Give weight to the last two bearish signals from On Balance Volume. This supports the Elliott wave analysis.
Stochastics may remain extreme for reasonable periods of time. Only when it is oversold for a while and then exhibits some clear divergence with price should it be taken as a strong warning a low may be in place. Especially if RSI is also oversold. That is not the case here.
VOLATILITY INDEX
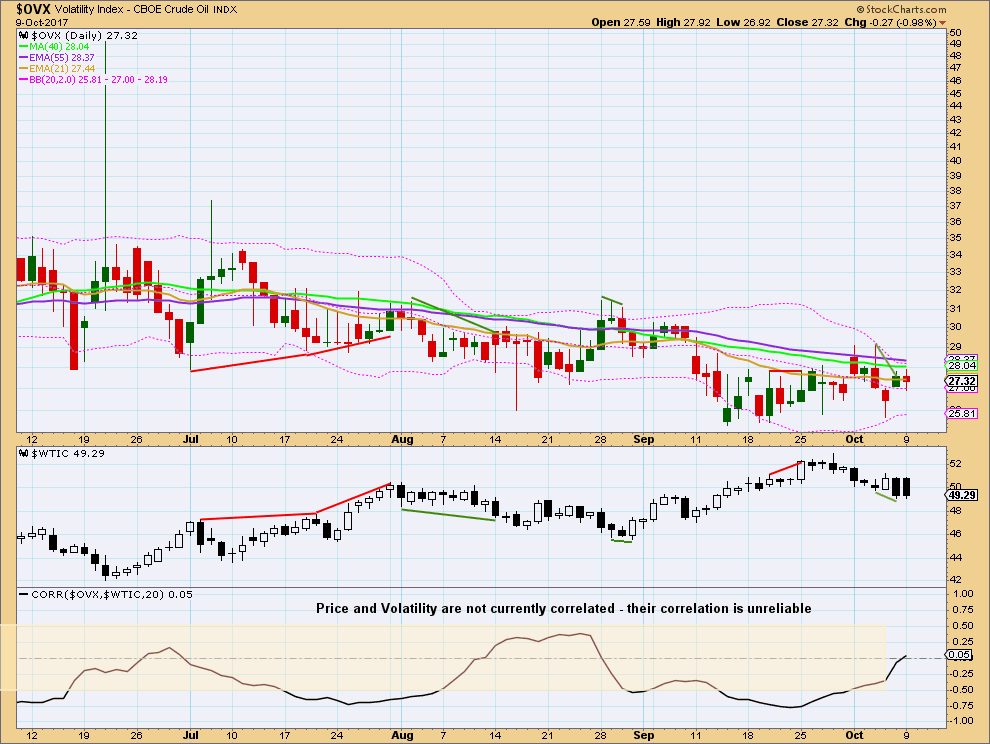
Click chart to enlarge. Chart courtesy of StockCharts.com.
There is some divergence between price and volatility: price made a new low yesterday, but it did not come with a normal corresponding increase in volatility. This is bullish. Look for a bounce here.
Published @ 04:51 a.m. EST.
I agree with the triangle (B) interpretation over the past year in WTI but am not certain if the thrust from the triangle is completed yet. However, Brent did spike to a new recovery high and the rest of the petroleum complex (unleaded, heating oil) did also. Does this impact anyone’s thinking, i.e. WTI is likely to join the rest in new recovery highs or that it may be a bearish divergence?