
A very small range weekly candlestick has moved price sideways and very slightly higher.
Summary: A downwards breakout is still expected. Expect resistance about 52.90 and support about 49.10.
The target for the next wave down is at 15.38 or 13.00. This target is some months away.
Members may either wait for a breakout from the small consolidation before entering short, or open a hedge with stops just beyond support and resistance. If hedging, ensure that the total risk is no more than 1-5% of equity. Always trade with stops.
New updates to this analysis are in bold.
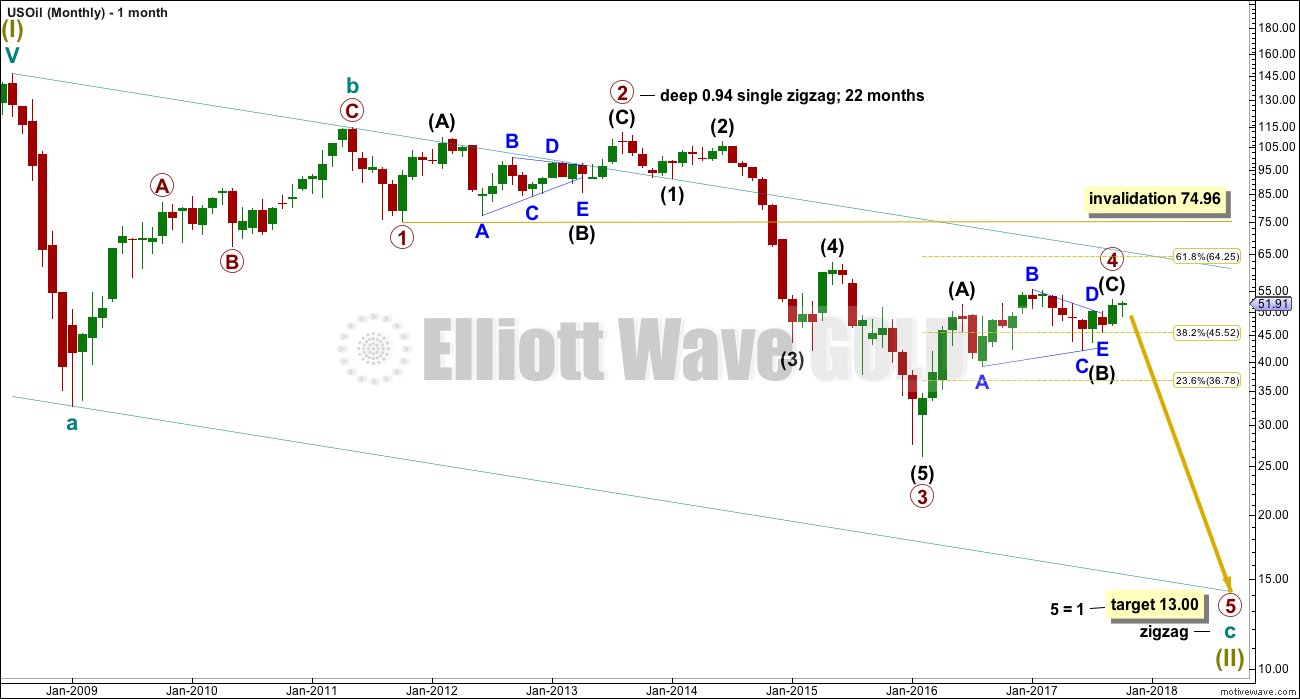
MONTHLY ELLIOTT WAVE COUNT
Click chart to enlarge.
Within the bear market, cycle wave b is seen as ending in May 2011. Thereafter, a five wave structure downwards for cycle wave c begins.
Primary wave 1 is a short impulse lasting five months. Primary wave 2 is a very deep 0.94 zigzag lasting 22 months. Primary wave 3 is a complete impulse with no Fibonacci ratio to primary wave 1. It lasted 30 months.
There is alternation in depth with primary wave 2 very deep and primary wave 4 relatively shallow. There is inadequate alternation in structure, both are zigzags. So far primary wave 4 has lasted 19 months. So far there is good proportion between primary waves 2 and 4.
Primary wave 4 may not move into primary wave 1 price territory above 74.96.
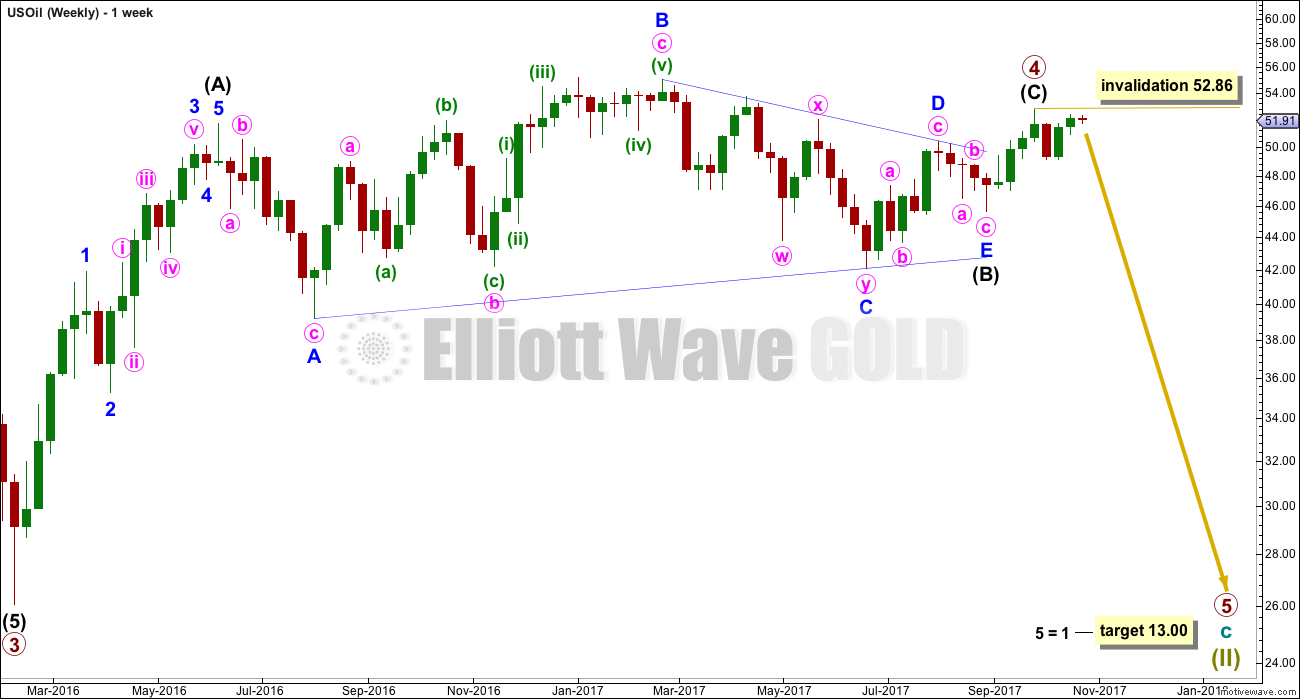
WEEKLY ELLIOTT WAVE COUNT
Click chart to enlarge.
This wave count now sees primary wave 4 now complete as a relatively shallow zigzag. Primary wave 2 lasted 22 months. If primary wave 4 is over at the last high, it would have lasted 19 months giving the wave count good proportions at the weekly and monthly chart levels.
Intermediate wave (A) will subdivide as a five wave impulse. Intermediate wave (B) fits as a running contracting triangle. Intermediate wave (C) has moved above the end of intermediate wave (A) at 51.67 avoiding a truncation. There is no Fibonacci ratio between intermediate waves (A) and (C).
Within primary wave 5, no second wave correction may move beyond its start above 52.86.
The target uses the most common Fibonacci ratio for a fifth wave, so it should have a reasonable probability.
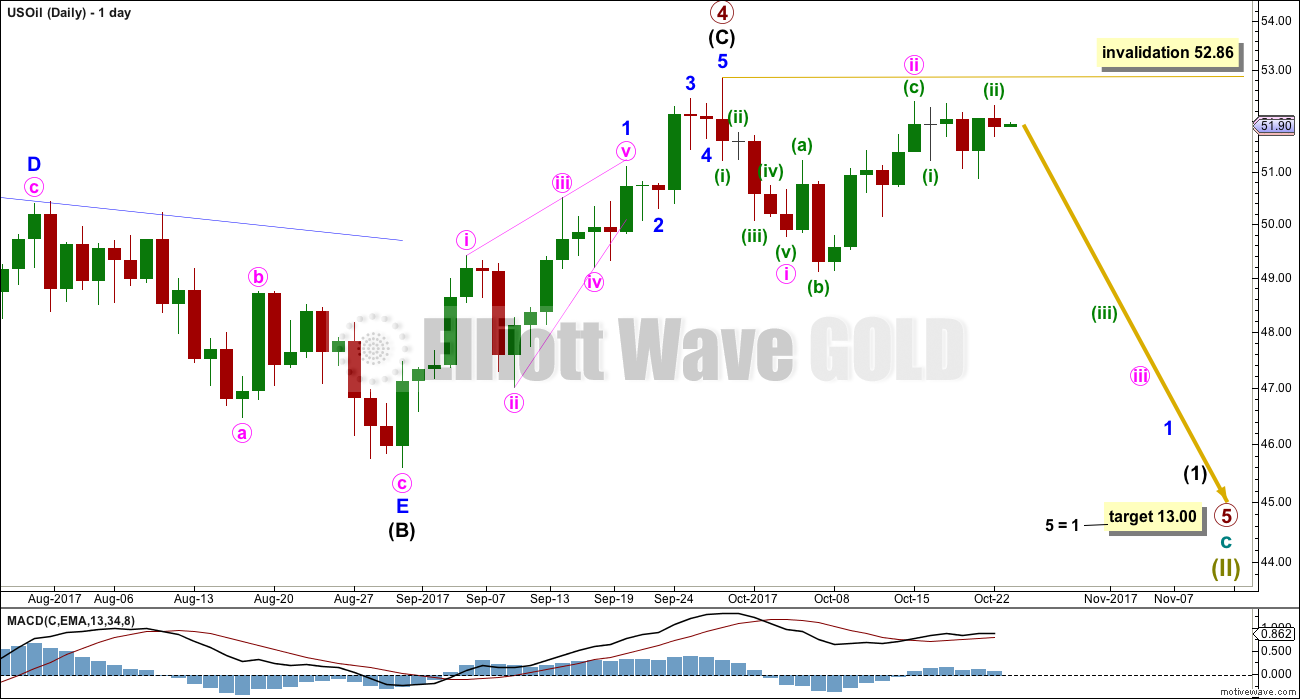
DAILY ELLIOTT WAVE COUNT
Click chart to enlarge.
Intermediate wave (C) may be seen as a complete five wave structure.
A move at primary degree should begin with a five down on the daily chart. This may be complete if minute wave i ends at the low labelled and not at the last swing low.
Minute wave ii may be a very common expanded flat correction. The structure may be complete, or it may need one slight new high.
Minute wave ii may not move beyond the start of minute wave i above 52.86.
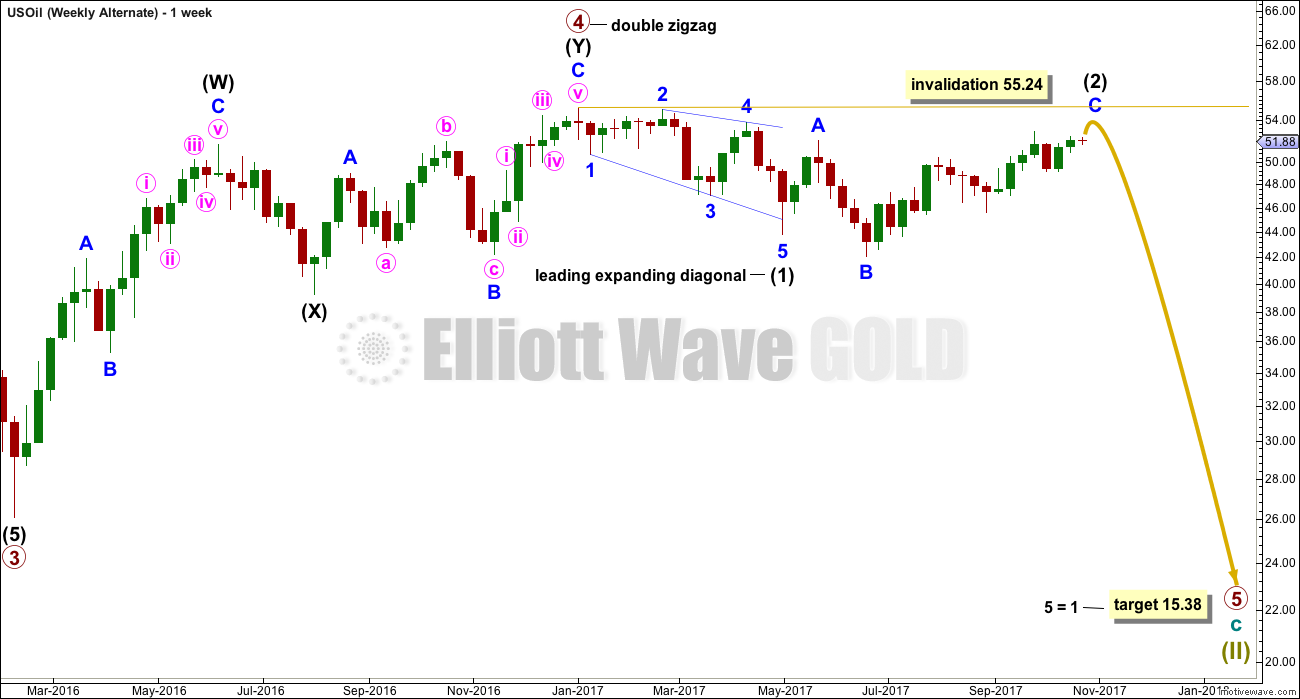
ALTERNATE WEEKLY ELLIOTT WAVE COUNT
Click chart to enlarge.
This alternate wave count considers the possibility that primary wave 4 ended earlier.
Primary wave 5 may have begun with a leading expanding diagonal for intermediate wave (1). Intermediate wave (2) may be an expanded flat correction.
Intermediate wave (2) may not move beyond the start of intermediate wave (1) above 55.24.
ALTERNATE DAILY ELLIOTT WAVE COUNT
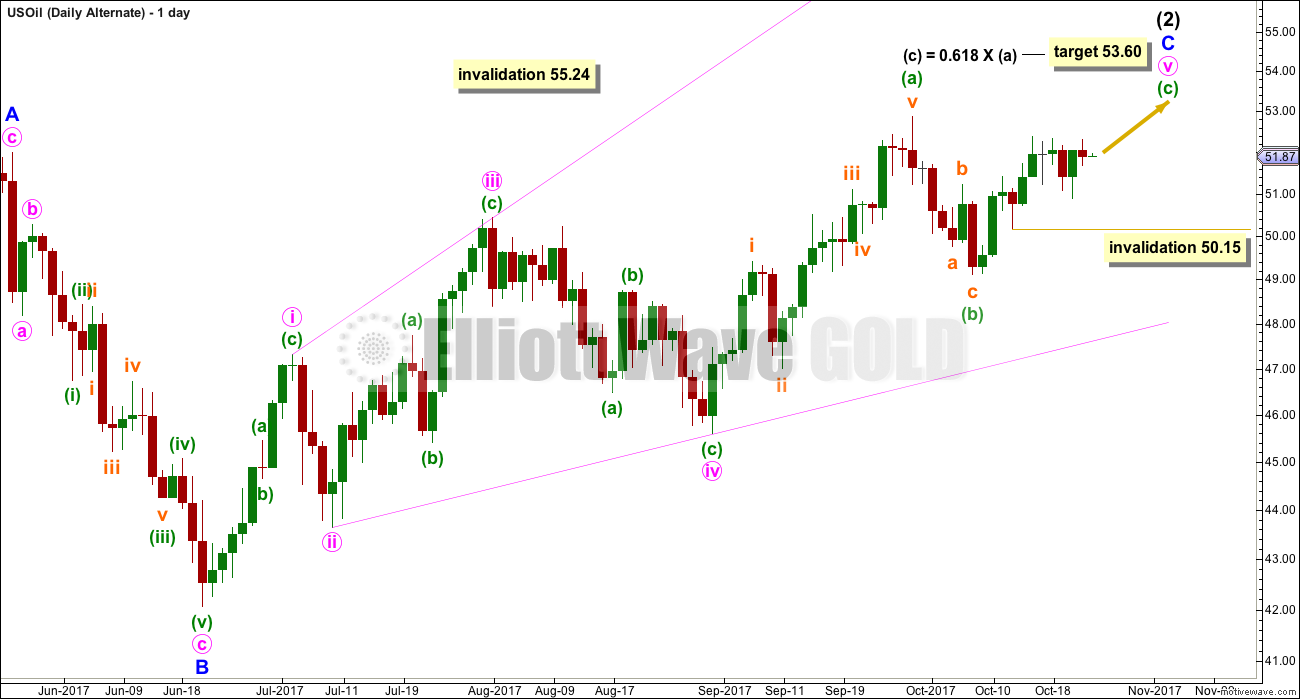
Click chart to enlarge.
Intermediate wave (2) fits so far as an expanded flat correction that may be incomplete.
Minor wave C may be another expanding diagonal, this one ending. Within ending diagonals, all sub-waves must subdivide as zigzags and the fourth wave should overlap first wave price territory.
Minute wave v must be longer than minute wave iii within an expanding diagonal, so that the rule regarding wave lengths is met. This rule is met.
Minor wave C has moved above the end of minor wave A at 52.00 avoiding a truncation and a very rare running flat.
To avoid a truncation minuette wave (c) should move above the end of minuette wave (a) at 52.86.
TECHNICAL ANALYSIS
DAILY CHART
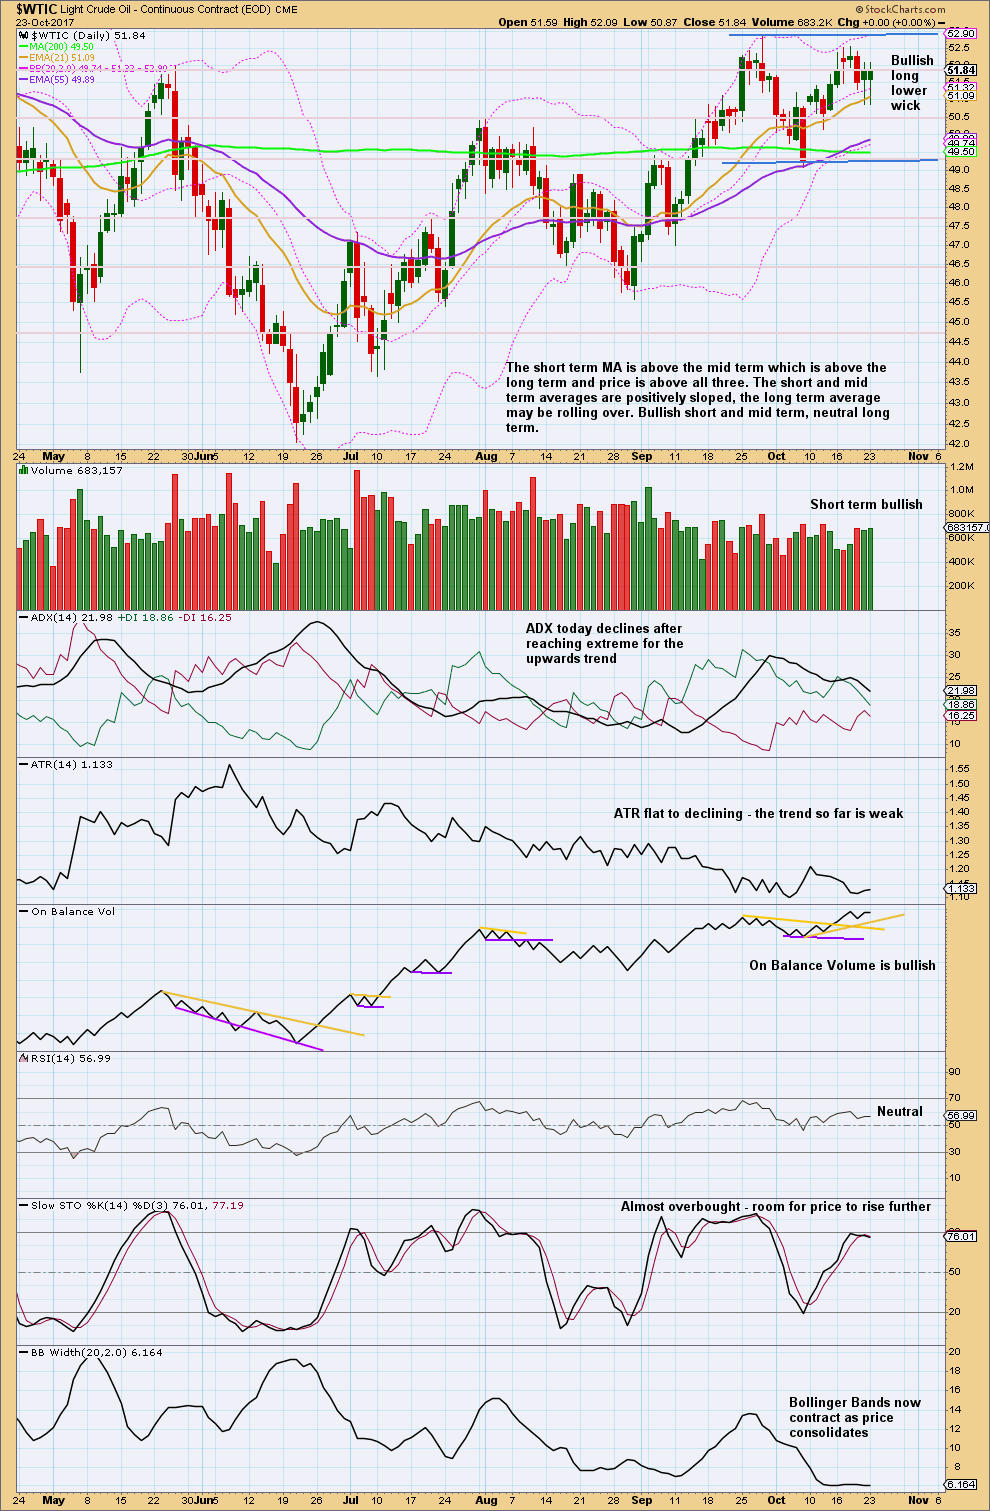
Click chart to enlarge. Chart courtesy of StockCharts.com.
Price is consolidating with support and resistance as shown on the chart with blue lines. During this consolidation, it is two downwards days of 6th and 12th of October that have strongest volume, suggesting a downwards breakout is more likely than upwards.
VOLATILITY INDEX
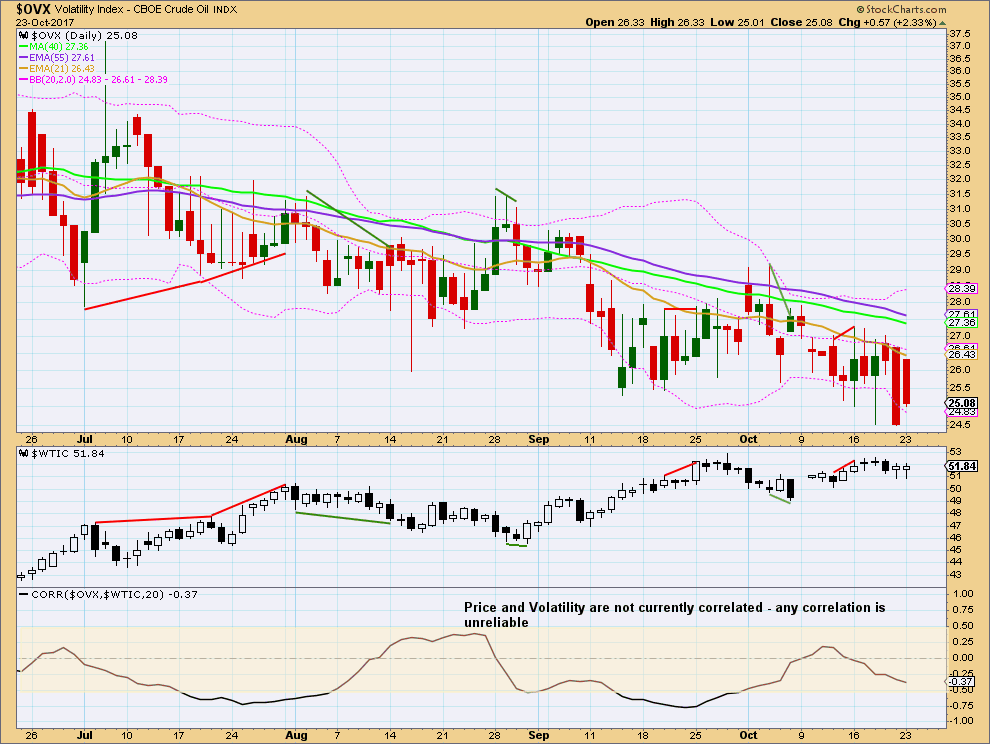
Click chart to enlarge. Chart courtesy of StockCharts.com.
There is no short term divergence between price and volatility this week.
Published @ 10:10 p.m. EST.
Looks like the alternate is in play, if a bearish count is still in play. A big move up today… will have to wait and see. But for anyone wanting to go short, this would be a good opportunity.
I’m going to wait until the next oil inventory reports to make a move though…
Is the main count invalidated yesterday with high of 52,86$?
No one trades OIL?
I am looking for an opportunity to SHORT
Plenty of members do trade Oil. I too am looking for an entry opportunity, but for the short term it should be long.