
A classic upwards breakout was seen two days ago. The main Elliott wave count is changed. The alternate Elliott wave count remains the same.
Summary: Look for upwards movement to continue now until about 61.42. For the very short term, look for price to curve back down to find support at prior resistance around 53.00.
A new low now below 49.11 would be a strong indication that upwards movement is over and the next big wave down has begun. If that happens, then a target would be calculated and would most likely be below 20.
New updates to this analysis are in bold.
MONTHLY ELLIOTT WAVE COUNT
Click chart to enlarge.
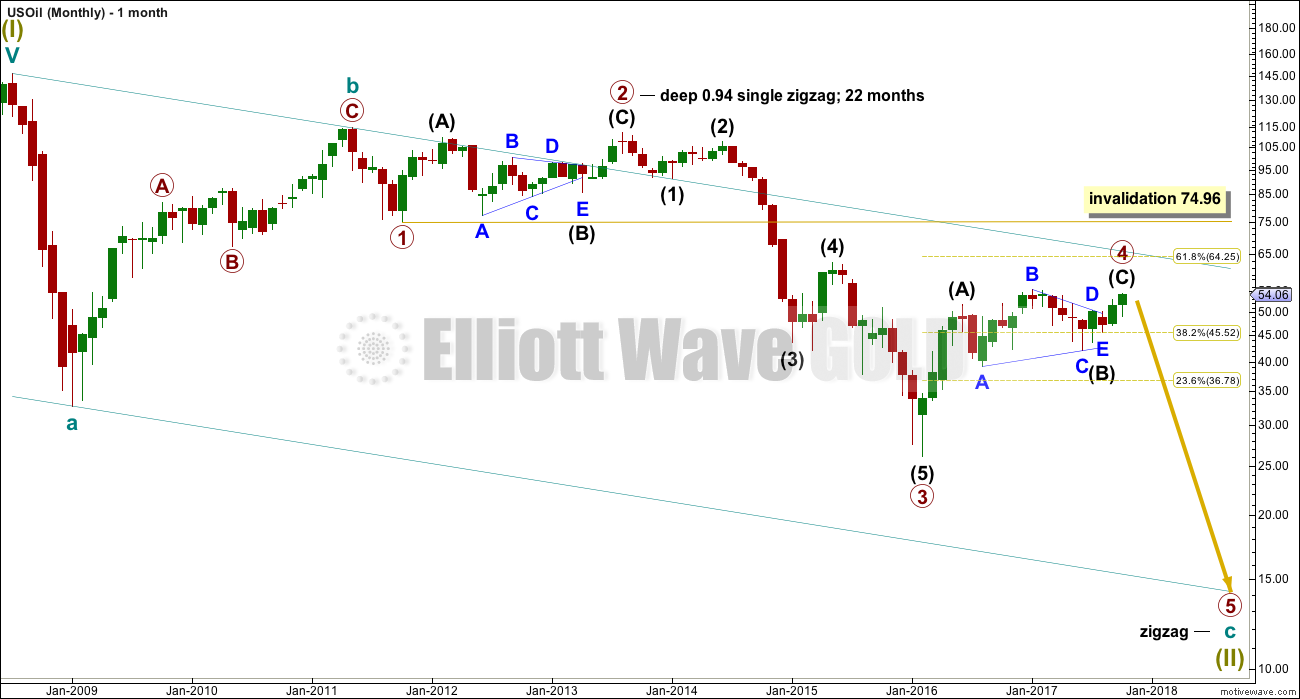
Within the bear market, cycle wave b is seen as ending in May 2011. Thereafter, a five wave structure downwards for cycle wave c begins.
Primary wave 1 is a short impulse lasting five months. Primary wave 2 is a very deep 0.94 zigzag lasting 22 months. Primary wave 3 is a complete impulse with no Fibonacci ratio to primary wave 1. It lasted 30 months.
There is alternation in depth with primary wave 2 very deep and primary wave 4 relatively shallow. There is inadequate alternation in structure, both are zigzags. So far primary wave 4 has lasted 20 months. So far there is good proportion between primary waves 2 and 4.
Primary wave 4 may not move into primary wave 1 price territory above 74.96.
WEEKLY ELLIOTT WAVE COUNT
Click chart to enlarge.
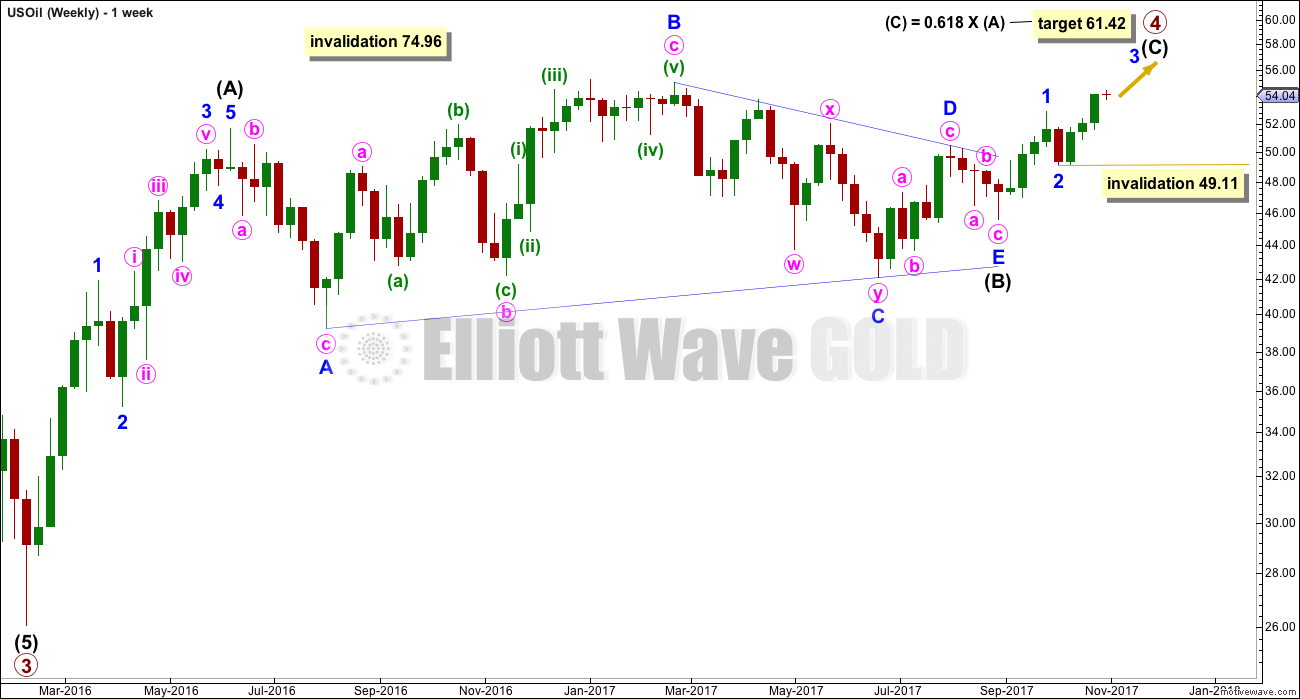
A new high and an invalidation of how this wave count was labelled last week has necessitated relabelling of this wave count. Primary wave 4 cannot now be over at the last high.
Intermediate wave (C) must subdivide as a five wave structure, either an impulse or an ending diagonal. Within intermediate wave (C), minor waves 1 and 2 may be complete. Within minor wave 3, no second wave correction may move beyond the start of its first wave below 49.11.
When intermediate wave (C) may again be seen as complete, then a trend change would again be expected and a target for primary wave 5 downwards would again be calculated. At this stage, for this wave count, a target cannot be calculated for it to end because the start of primary wave 5 is not known.
DAILY ELLIOTT WAVE COUNT
Click chart to enlarge.
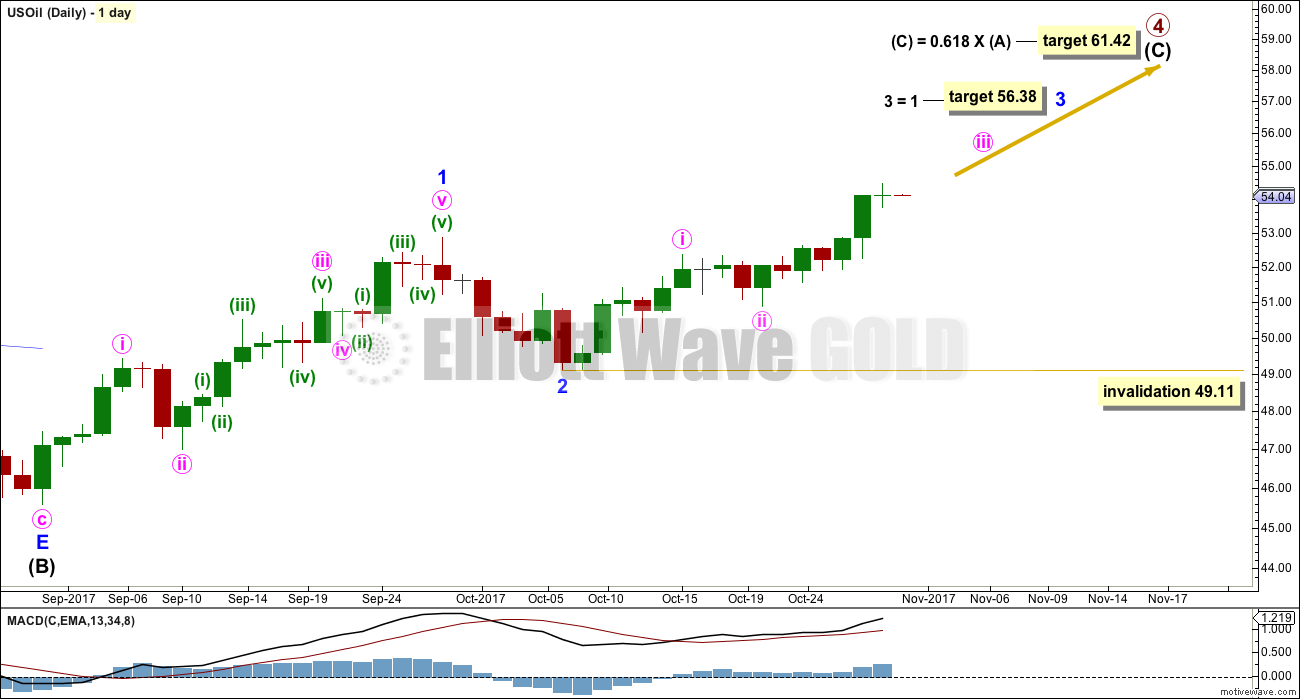
Intermediate wave (C) must complete as a five wave structure. For this wave count, it looks like a possible impulse.
The target for minor wave 3 is equality in length with minor wave 1, because minor wave 2 was relatively shallow and it fits with the higher target for intermediate wave (C) to end.
ALTERNATE WEEKLY ELLIOTT WAVE COUNT
Click chart to enlarge.
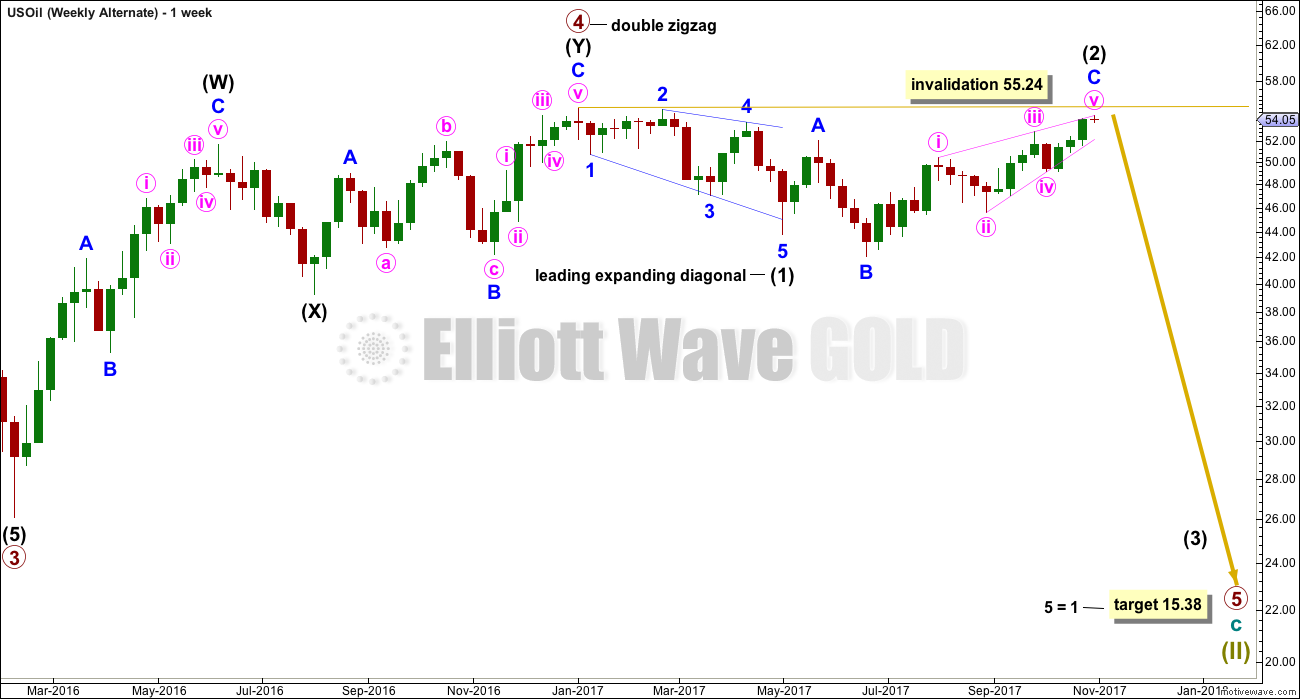
This alternate wave count considers the possibility that primary wave 4 ended earlier.
Primary wave 5 may have begun with a leading expanding diagonal for intermediate wave (1). Intermediate wave (2) may be an expanded flat correction.
Intermediate wave (2) may not move beyond the start of intermediate wave (1) above 55.24.
ALTERNATE DAILY ELLIOTT WAVE COUNT
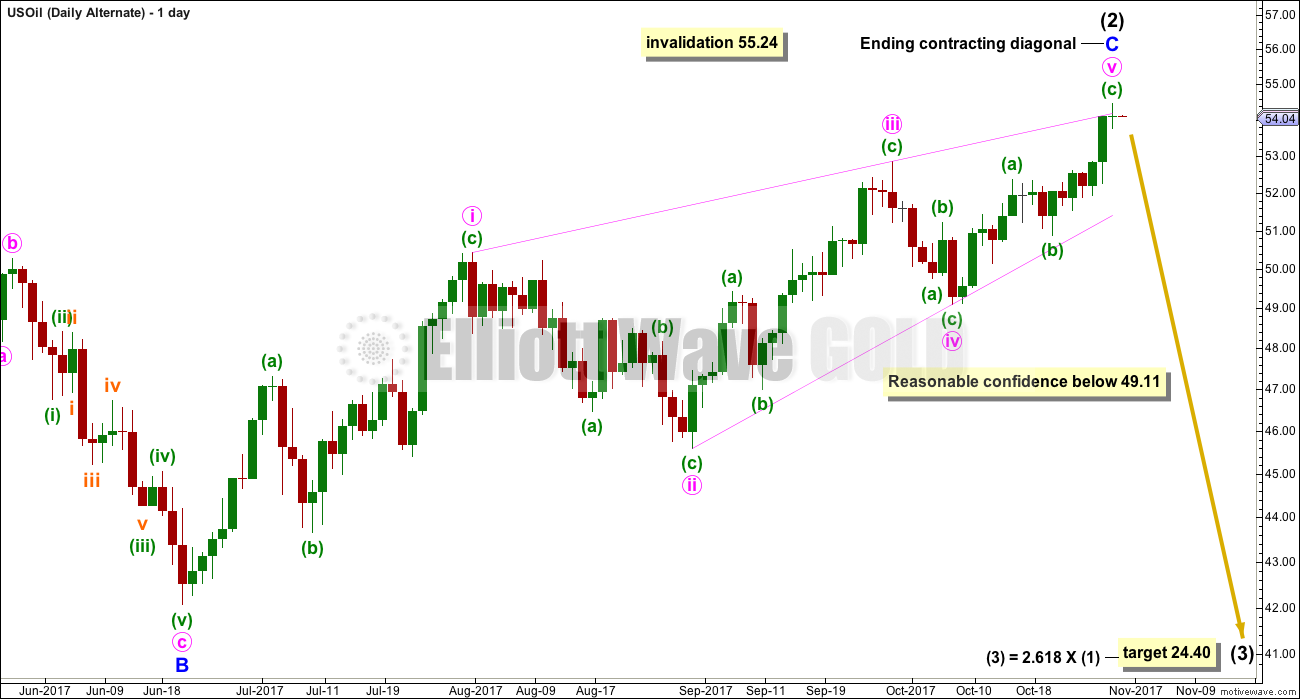
Click chart to enlarge.
Intermediate wave (2) fits so far as an expanded flat correction that may be complete.
Minor wave C may be an ending contracting diagonal. Within ending diagonals, all sub-waves must subdivide as zigzags and the fourth wave should overlap first wave price territory.
The final fifth wave of the diagonal now shows a small overshoot of the i-iii trend line, giving a very typical look. This wave count now expects an imminent violent downwards reversal. Movements following ending diagonals are normally very strong.
Minor wave C has moved above the end of minor wave A at 52.00 avoiding a truncation and a very rare running flat.
The target for intermediate wave (3) is calculated with the 2.618 Fibonacci ratio because intermediate wave (1) was very short and intermediate wave (2) was very deep.
TECHNICAL ANALYSIS
DAILY CHART
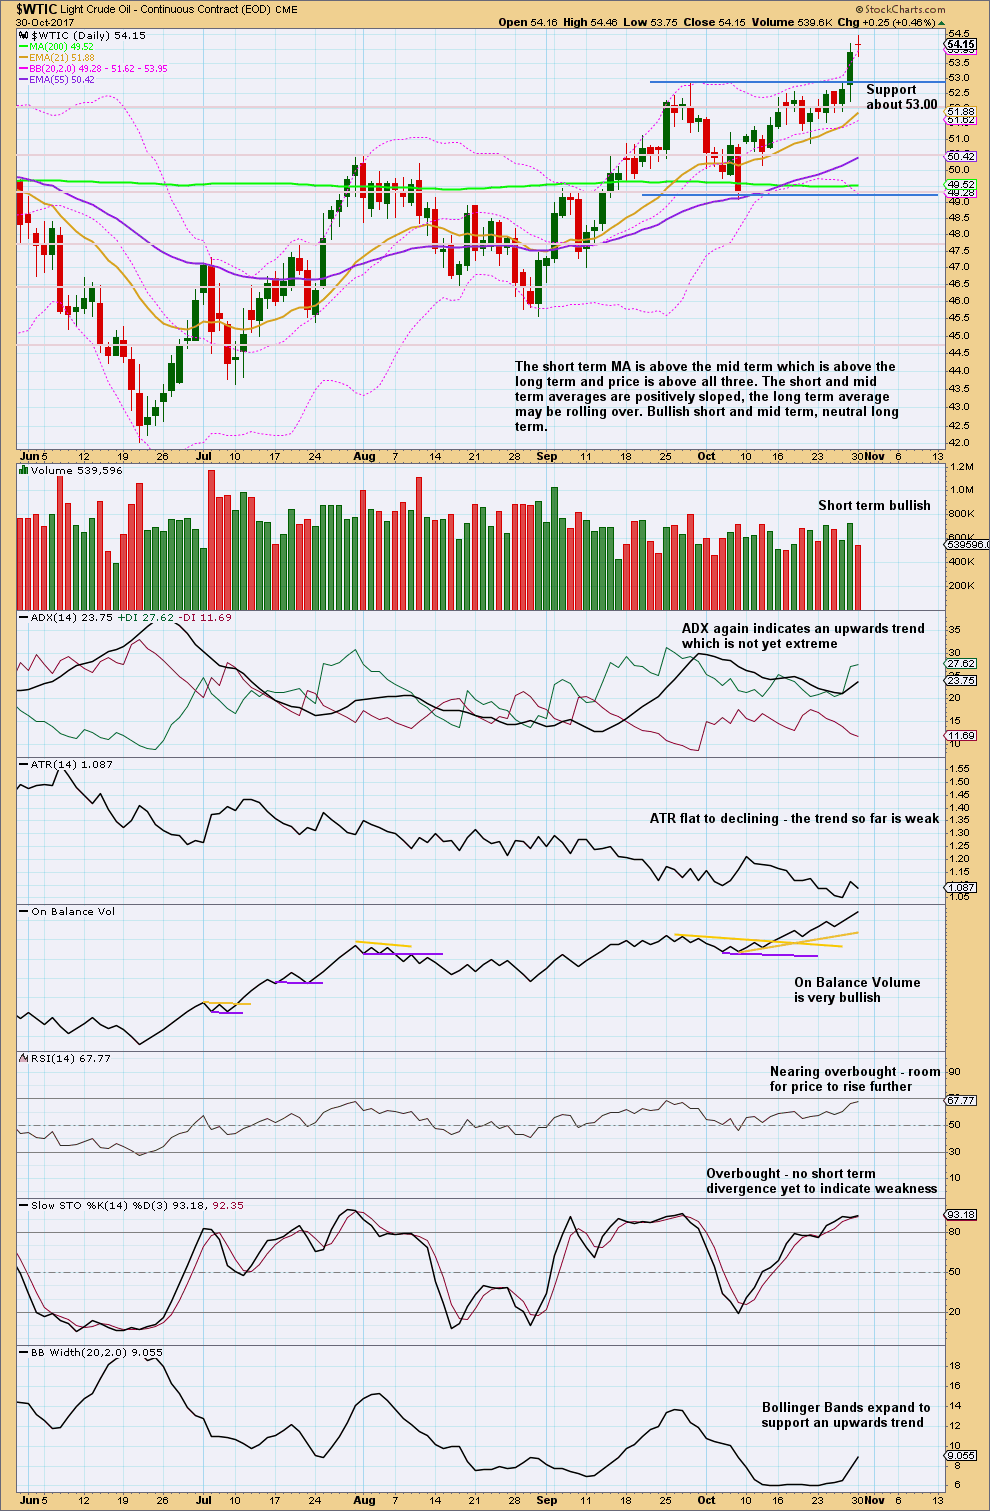
Click chart to enlarge. Chart courtesy of StockCharts.com.
Price has broken out upwards above 53.00 from a small consolidation. The upwards breakout on the 27th of October has support from volume. This view has strong support now from On Balance Volume.
With RSI not yet overbought, there is room for price to rise. Stochastics may remain overbought for a reasonable period of time. Only when it exhibits clear divergence with price while overbought should an end to the upwards trend be expected.
Overall, this chart is now fairly bullish. The only warning for the upwards trend comes with declining ATR. The trend has inherent weakness. This supports the main Elliott wave count.
VOLATILITY INDEX
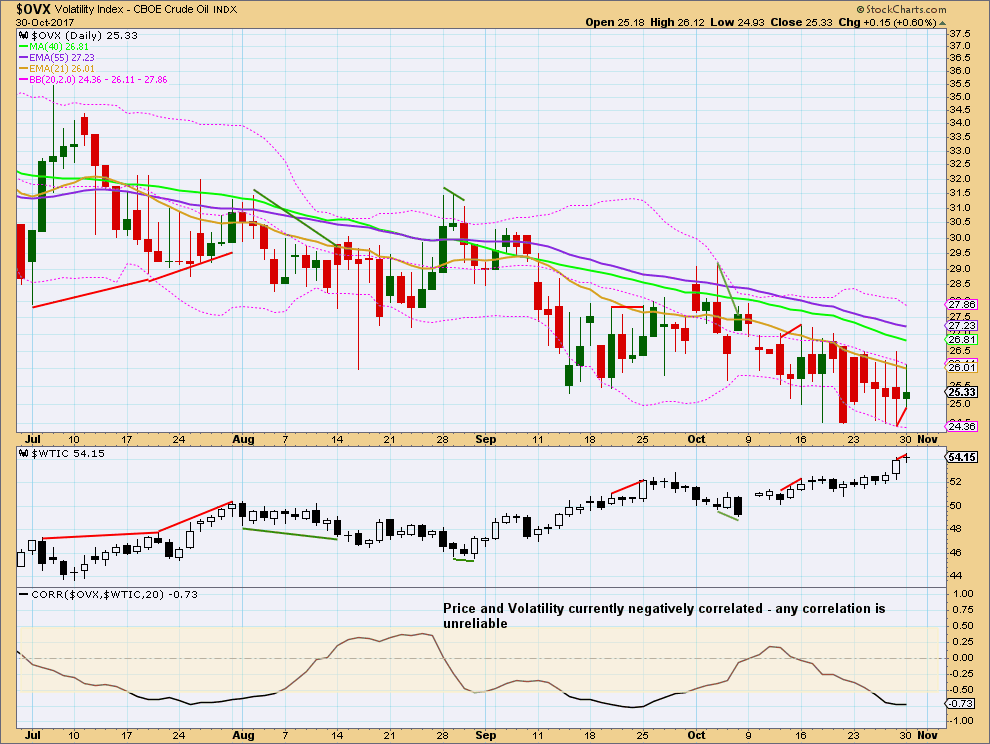
Click chart to enlarge. Chart courtesy of StockCharts.com.
The last high shows bearish short term divergence with volatility. The new high does not come with a normal corresponding increase in volatility indicating upwards movement for price is weak.
Published @ 07:50 p.m. EST.
Have we started a reversal here with a large bearish engulfing on the 4-hour chart?
This is where I think USOIL is today. This count is built on Lara’s Main count from earlier this week. If correct, USOIL is in Minuette iv or v of Minute iii of Minor 3.