
Volume will be relied upon strongly today to judge the next most likely direction for Gold.
Summary: An upwards swing is expected to continue here to end about resistance at 1,305 to 1,310. Along the way up, there may be another small sideways movement to last one to three days.
For the very short term, price may move lower to test the lower edge of the base channel on the hourly charts. If it does do this, then use that as an entry point for a long position.
Only the most experienced of traders should be trading the small swings within a consolidation. If trading the small swings, reduce risk to 1-3% of equity for any one trade and always trade with stops.
New updates to this analysis are in bold.
Last monthly charts for the main wave count are here, another monthly alternate is here, and video is here.
Grand SuperCycle analysis is here.
The wave counts will be labelled first and second. Classic technical analysis will be used to determine which wave count looks to be more likely. In terms of Elliott wave structure the second wave count has a better fit and fewer problems.
FIRST ELLIOTT WAVE COUNT
WEEKLY CHART
Click chart to enlarge.
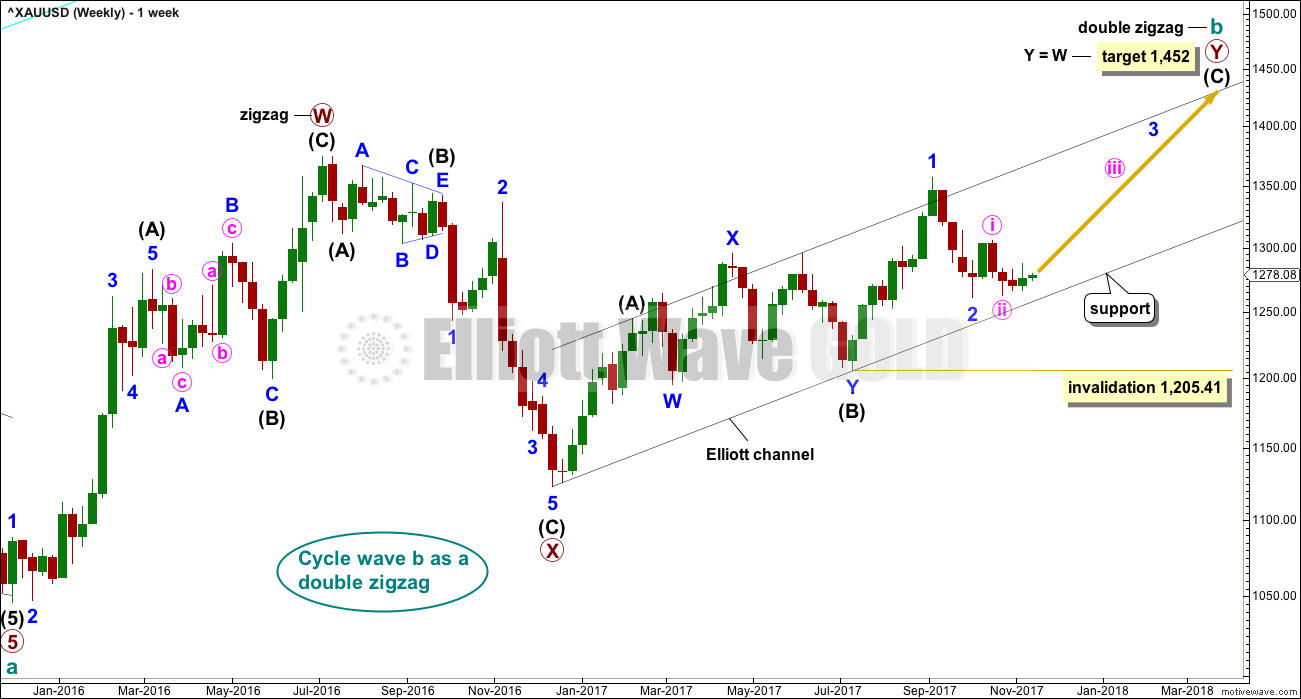
Both wave counts expect that Gold completed a large five down from the all time high in November 2011 to the low of December 2015, which is seen on the left hand side of both weekly charts.
If this analysis is correct, then the five down may not be the completion of the correction. Corrective waves do not subdivide as fives; they subdivide as threes. The five down is seen as cycle wave a within a Super Cycle wave (II).
Both wave counts then expect cycle wave b began in December 2015.
There are more than 23 possible corrective structures that B waves may take. It is important to always have multiple wave counts when B waves are expected.
It looks unlikely that cycle wave b may have been over at the high labelled primary wave W. Primary wave W lasted less than one year at only 31 weeks. Cycle waves should last one to several years and B waves tend to be more time consuming than other Elliott waves, so this movement would be too brief for cycle wave b.
This first wave count expects that cycle wave b may be an incomplete double zigzag.
While this first wave count is entirely possible, there are three problems now which reduce its probability.
1. Cycle wave b is a double zigzag, but primary wave X within the double is deep and time consuming. While this is possible, it is much more common for X waves within double zigzags to be brief and shallow.
2. Intermediate wave (B) within the zigzag of primary wave Y is a double flat correction. These are extremely rare, even rarer than running flats. The rarity of this structure must further reduce the probability of this wave count.
3. Although intermediate wave (C) should be continuing so that primary wave Y ends substantially above the end of primary wave W, the duration and depth of minor wave 2 within it now looks to be too large at the weekly time frame.
Within intermediate wave (C), no second wave correction may move beyond the start of its first wave below 1,205.41. However, prior to invalidation, this wave count may be discarded if price breaks below the lower edge of the black Elliott channel. If this wave count is correct, then intermediate wave (C) should not break below the Elliott channel which contains the zigzag of primary wave Y upwards.
DAILY CHART
Click chart to enlarge.
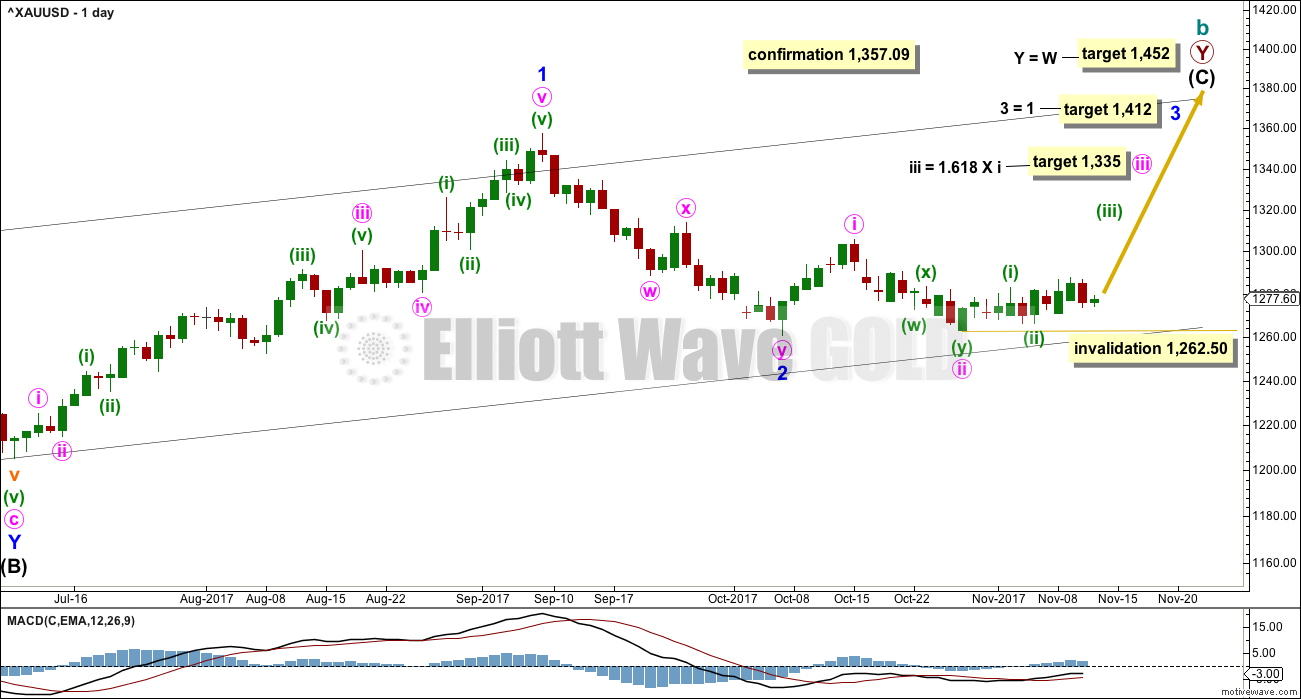
The analysis will focus on the structure of intermediate wave (C). To see details of all the bull movement for this year see daily charts here.
Intermediate wave (C) must be a five wave structure, either an impulse or an ending diagonal. It is unfolding as the more common impulse.
Minor wave 1 was a long extension. The target for minor wave 3 expects that too to be a long extension. If this is the case, then minor wave 5 may be shorter (only two actionary waves in an impulse may be extended).
The target for minute wave iii fits with higher targets and expects it to exhibit the most common Fibonacci ratio to minute wave i.
If price makes a new high above 1,357.09, then the second wave count below would be discarded and more confidence may be had in this first wave count.
HOURLY CHART
Click chart to enlarge.
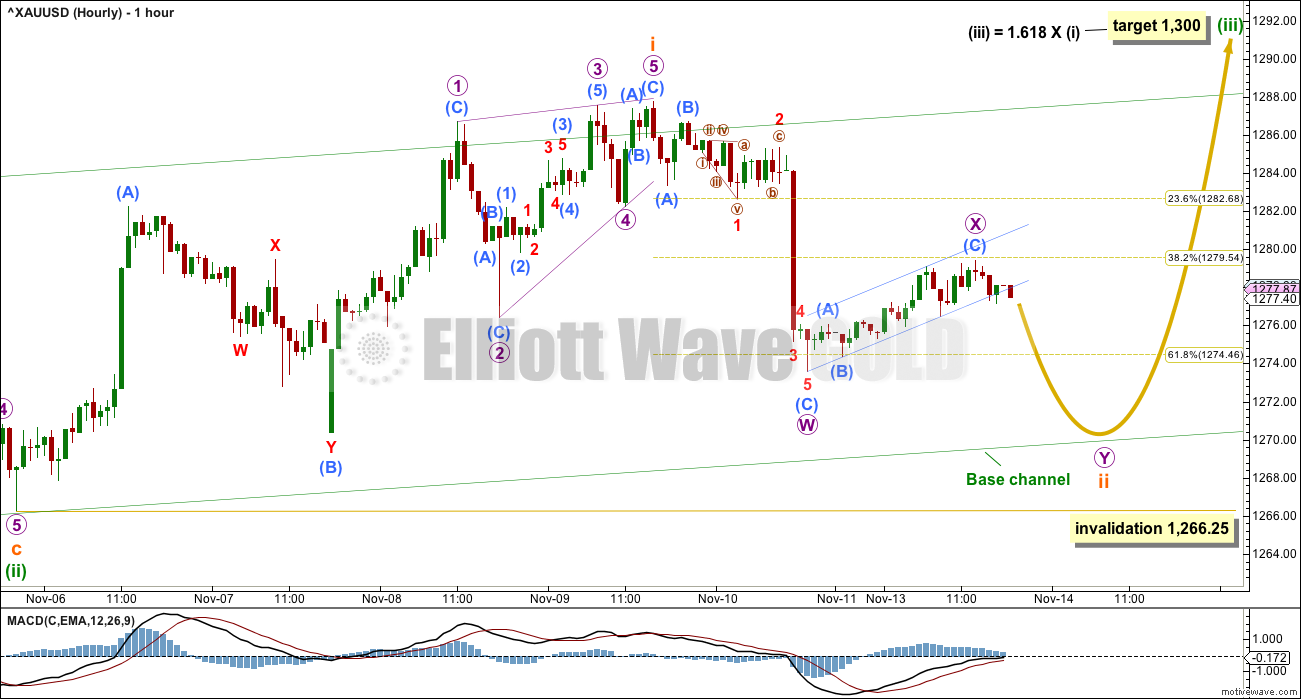
Minuette wave (iii) may have begun with a leading contracting diagonal for subminuette wave i. Leading diagonals in first wave positions are commonly followed by very deep second waves. Here, subminuette wave ii is now expected to move lower to be deeper than 0.618 the depth of subminuette wave i.
There is weakness today in the upwards movement labelled micro wave X. This upwards movement has very light volume. It is for this reason that more downwards movement is expected for subminuette wave ii to test support at the lower edge of the base channel.
Subminuette wave ii may not move beyond the start of subminuette wave i below 1,266.25.
SECOND ELLIOTT WAVE COUNT
WEEKLY CHART
Click chart to enlarge.
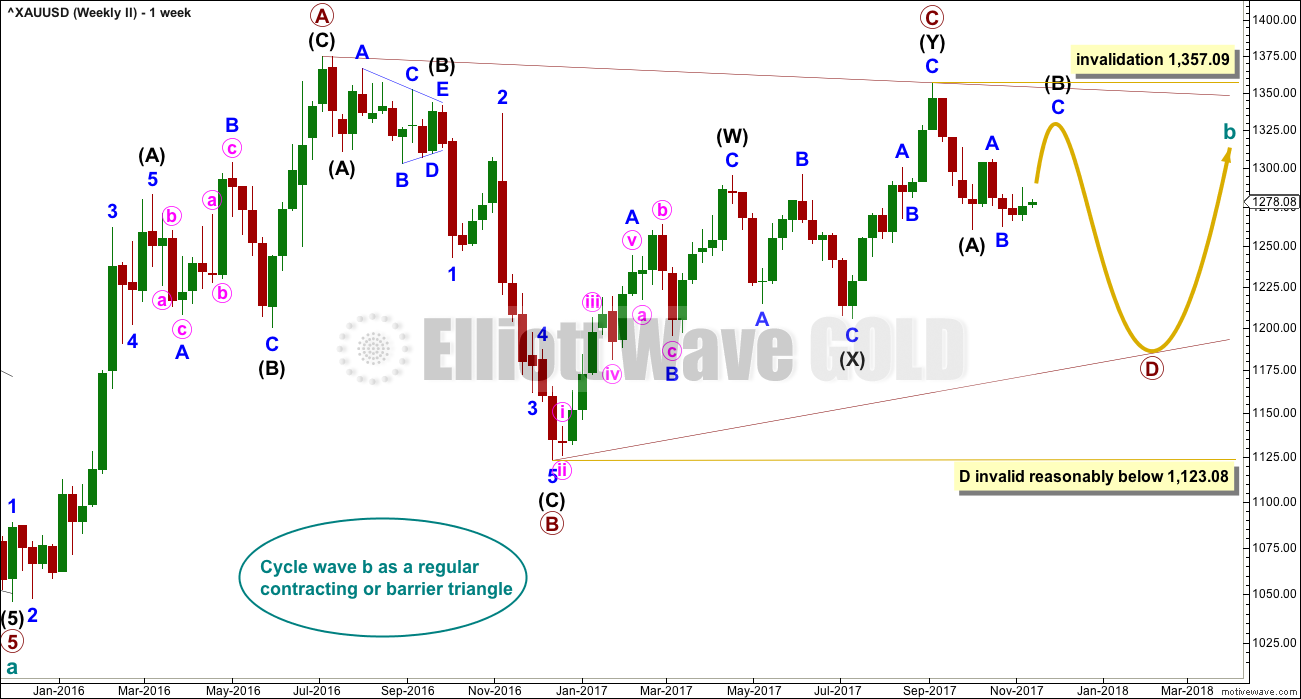
Both wave counts are identical to the low labelled cycle wave a. Thereafter, they look at different possible structures for cycle wave b.
This wave count looks at cycle wave b to be most likely a regular contracting triangle.
The B-D trend line should have a reasonable slope for this triangle to have the right look, because the A-C trend line does not have a strong slope. A barrier triangle has a B-D trend line that is essentially flat; if that happened here, then the triangle trend lines would not converge with a normal look and that looks unlikely.
Primary wave D should be a single zigzag. Only one triangle sub-wave may be a more complicated multiple, and here primary wave C has completed as a double zigzag. This is the most common triangle sub-wave to subdivide as a multiple.
Primary wave D of a contracting triangle may not move beyond the end of primary wave B below 1,123.08.
At its completion, primary wave D should be an obvious three wave structure at the weekly chart level. Within primary wave D, intermediate wave (B) is incomplete. At its completion, it too should be an obvious three wave structure at the weekly chart level.
DAILY CHART
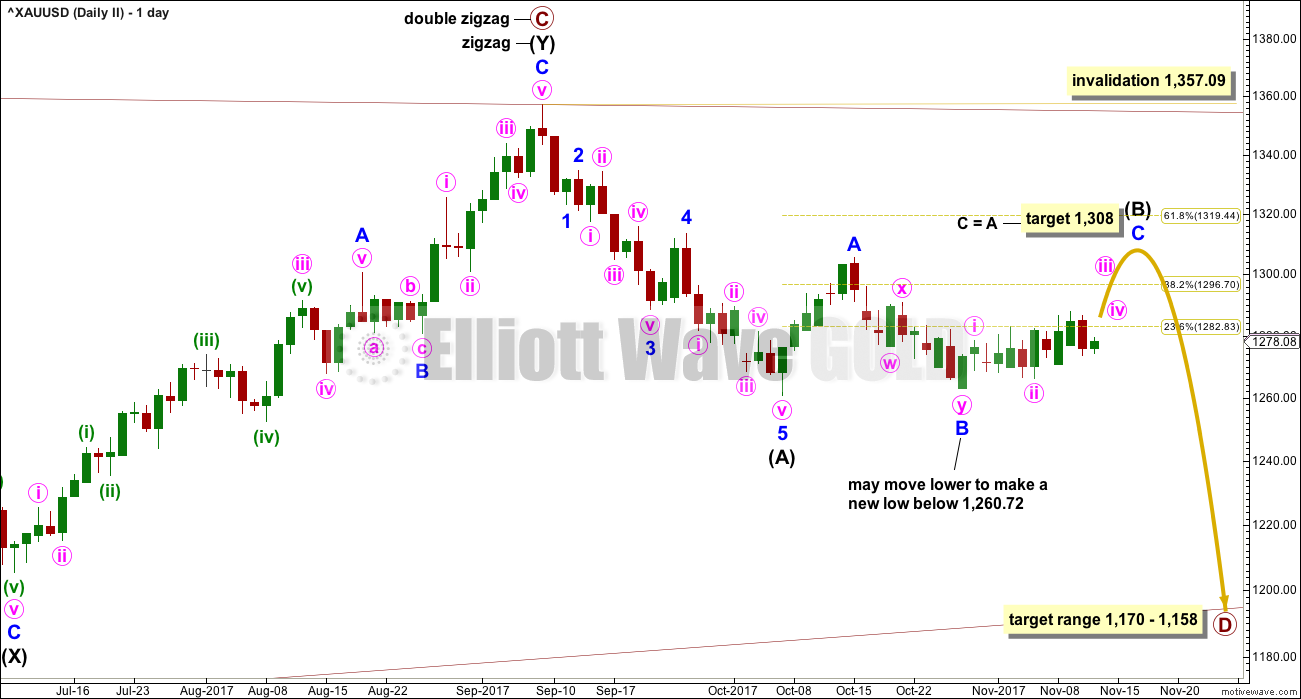
Click chart to enlarge.
At this stage intermediate wave (B) looks incomplete.
A common length for triangle sub-waves is from 0.8 to 0.85 the length of the prior wave. Primary wave D would reach this range from 1,170 to 1,158.
Intermediate wave (A) lasted twenty days, just one short of a Fibonacci twenty-one. Intermediate wave (B) may be about the same duration, so that this wave count has good proportions, or it may be longer because B waves tend to be more complicated and time consuming.
So far intermediate wave (B) has lasted twenty-six sessions, it is incomplete and needs several more sessions now to complete. The next Fibonacci ratio in the sequence is thirty four.
At this stage, intermediate wave (B) will be labelled as a flat correction. But it may morph into a double combination or triangle and complete as another structure; if this happens, then the target at 1,308 may be too high. Intermediate wave (B) may be a complicated sideways movement, which may be very choppy and characterised by declining ATR and poor trading opportunities.
HOURLY CHART
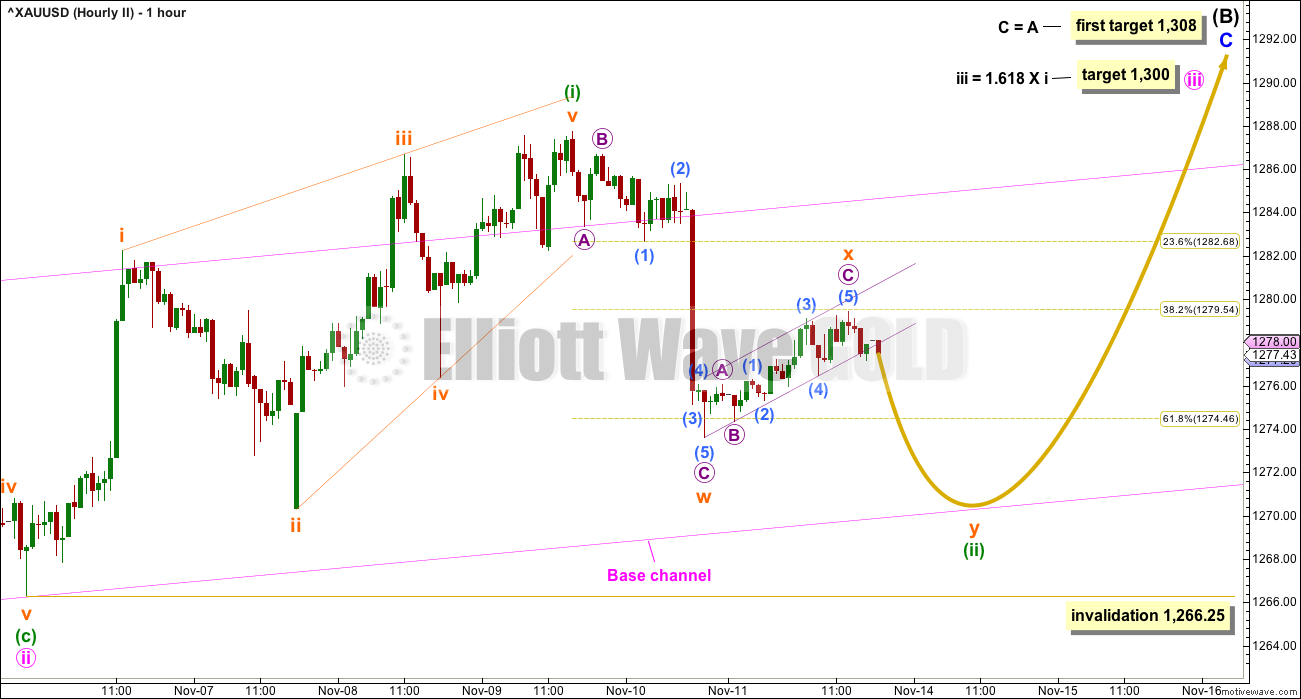
Click chart to enlarge.
Intermediate wave (B) may become clearer as its structure continues to unfold, so this hourly chart may be relabelled. The complexity of B waves means that flexibility in analysis is essential, and that there is more than the normal level of risk for traders.
A small channel is drawn about subminuette wave x. This channel may soon be breached by downwards movement; if it is, then it would look more likely that subminuette wave y may move lower to test support at the lower edge of the base channel.
The base channel is drawn in the same way on both wave counts.
Thereafter, both wave counts would expect upwards movement.
TECHNICAL ANALYSIS
WEEKLY CHART
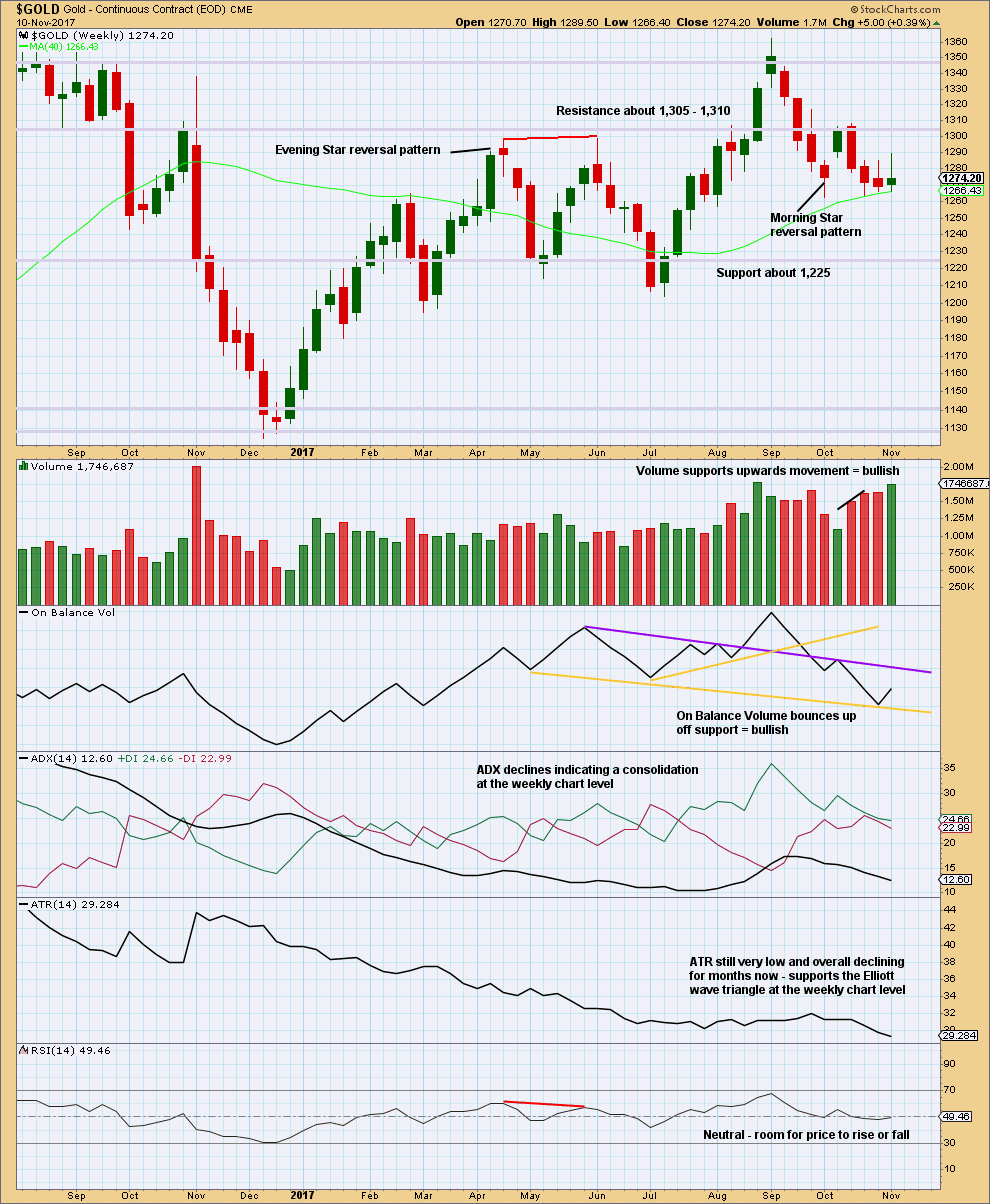
Click chart to enlarge. Chart courtesy of StockCharts.com.
Price has again made a higher high and a higher low for the week and this upwards movement has support from volume.
The long upper wick on this weekly candlestick is bearish.
On Balance Volume gave a weak bearish signal last week with a break below a yellow support line. But then On Balance Volume returned back above that line this week, so the line is adjusted to better show where On Balance Volume is finding support. This may now be read as a weak bullish signal.
DAILY CHART
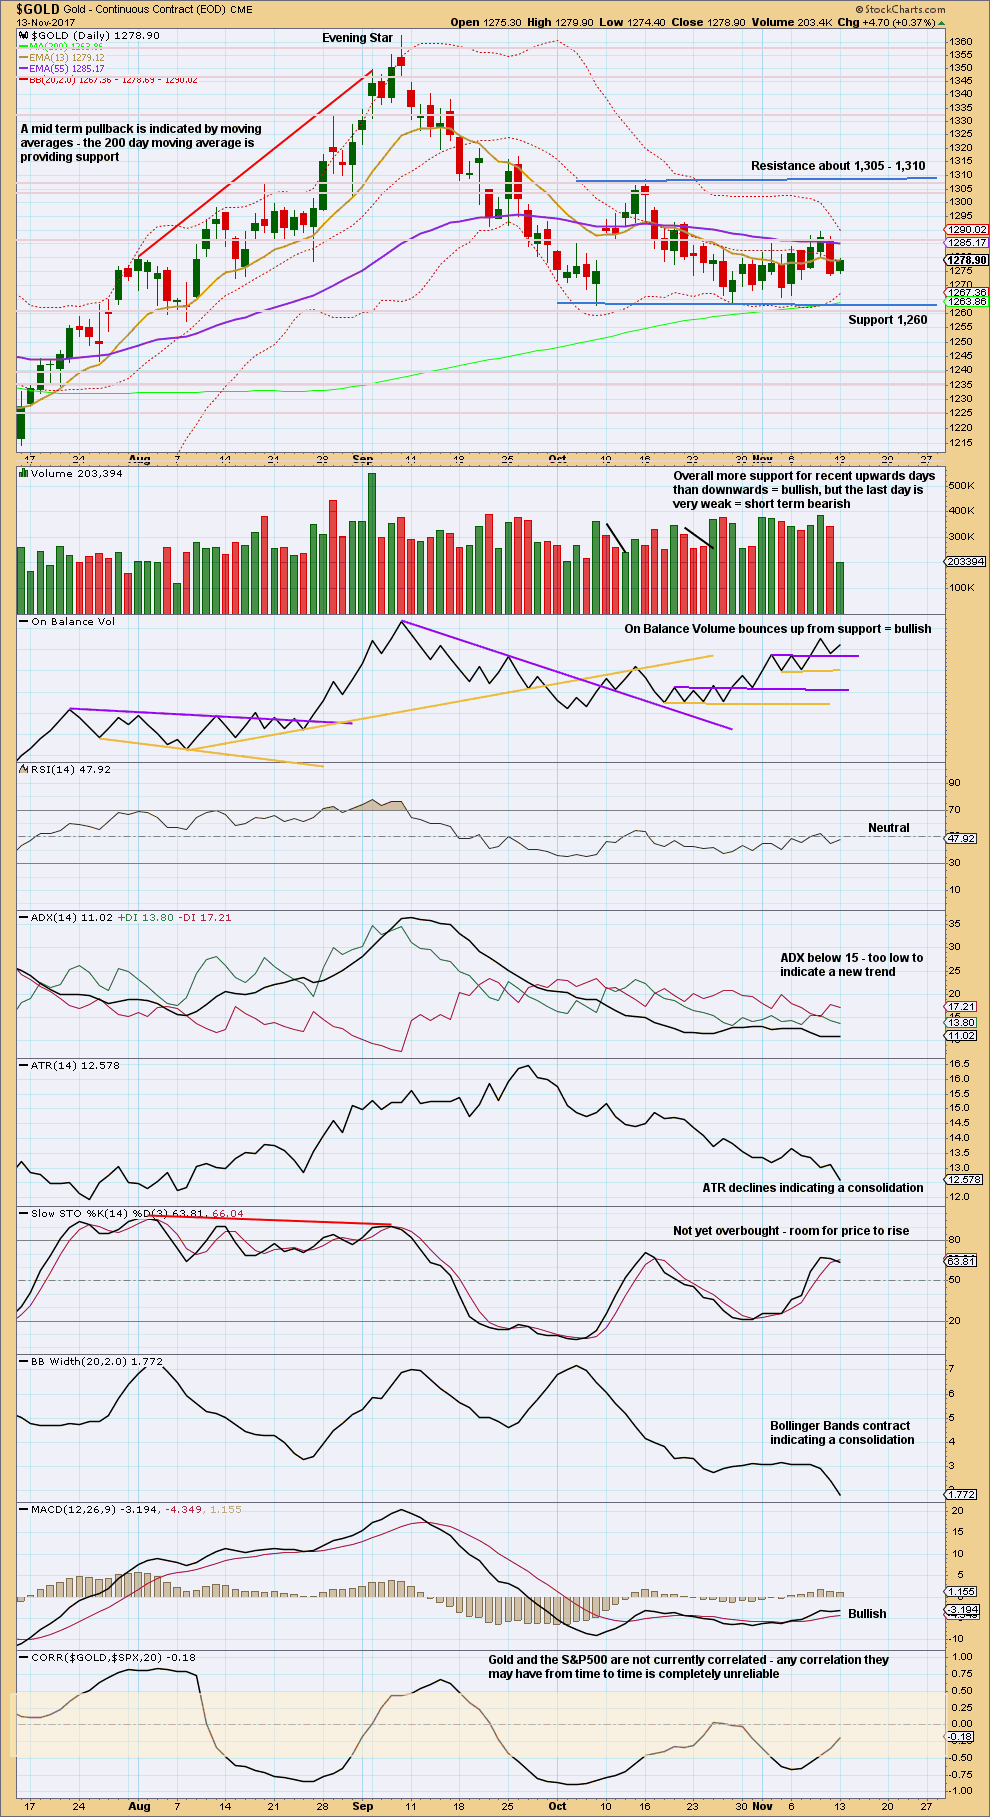
Click chart to enlarge. Chart courtesy of StockCharts.com.
Price is very clearly consolidating. Expect swings from support to resistance and back again. Use Stochastics in conjunction with support and resistance to signal when each swing ends. Be aware that trading a consolidating market is much more risky than trading a trending market, and reduce risk accordingly. Only experienced traders should consider trading the swings within a consolidation. Reduce risk to 1-3% of equity. Always trade with stops. Here, move stops to a little below support and above resistance to allow for overshoots; give the market room to move.
With Stochastics very close to oversold and price at support, an upwards swing may now be beginning. Look for resistance about 1,305 – 1,310. This also supports the second Elliott wave count.
For the short term, very light volume today is bearish enough to expect a red daily candlestick tomorrow. The bullish signal from On Balance Volume does not preclude this; On Balance Volume could move lower tomorrow and again test support while price may also move lower to test support.
GDX DAILY CHART
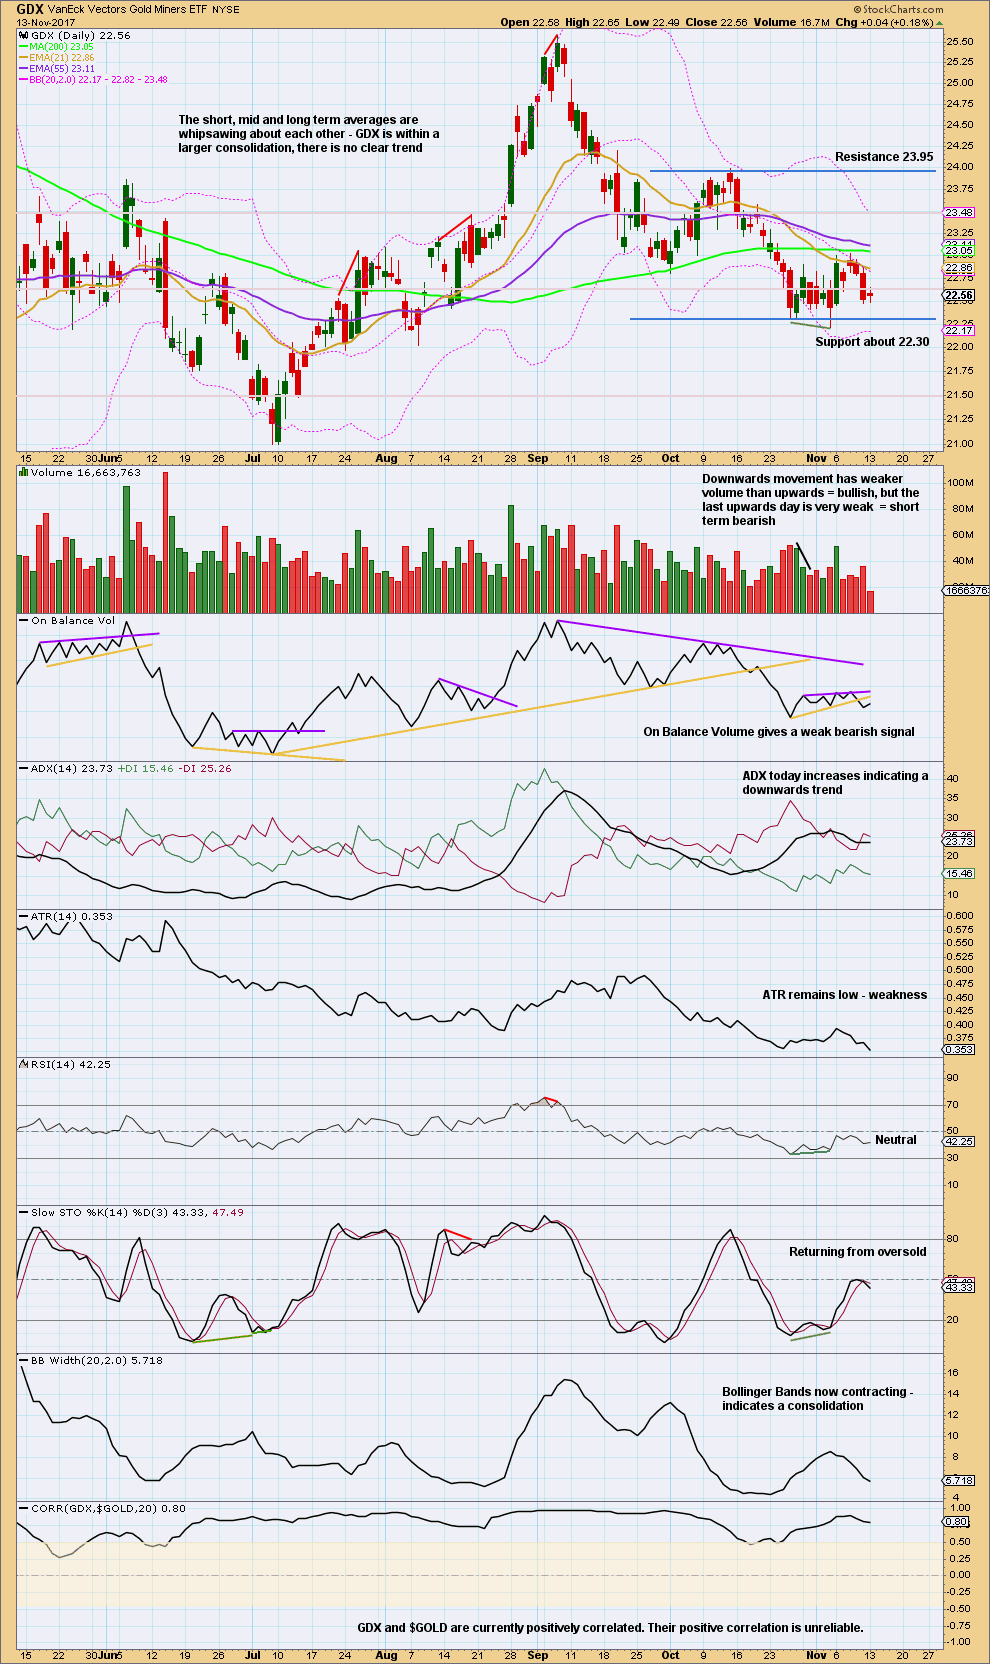
Click chart to enlarge. Chart courtesy of StockCharts.com.
An upwards swing may be expected to continue to resistance about 23.95.
Price does not move in straight lines within consolidations, making them poor trading opportunities. If trading this upwards swing, then reduce risk to only 1-3% of equity to acknowledge higher risk.
Published @ 07:02 p.m. EST.
Is the second hourly your main count now Lara?
No, I don’t want to pick a winner as this is a B wave. I’ve learned the hard way it’s best to be very flexible with B waves. I’m referring here to cycle wave b.
But the second wave count is the one that I would prefer, it has less problems in EW terms and has strong technical support from declining ATR for many months now.
For the short term both hourly counts are essentially the same. I prefer the targets on the second.
Lara,
I have a couple of Elliott Wave questions, please.
1. When an invalidation line is briefly violated (low of the day) does it count as an invalidation? Or does the price need to close below the invalidation level?
2. In a zigzag correction, how far can C go with respect to A? 2.618 or more is normal, rare or not okay?
Thank you kindly.
1. All Elliott wave rules (with one sole exception) are black and white. So an invalidation of a wave count by any amount at any time frame is an invalidation of the count. A close is not needed.
The problem at the hourly chart level is that when the wave count is expecting a correction (as it currently is expecting price is within intermediate (B) for the second wave count) then the number of possible structures is too big for me to get the right one often enough. I may leave invalidation points further away to recognise other scenarios. But I do have a tendency to often pull invalidation points too close in, and not allow for other scenarios.
2. C is most commonly = A, but it can certainly be 1.618, 2.618 or even longer to A. The longer it gets, the less common that scenario is. It’s a sliding scale really. I would not call either 1.618 or 2.618 rare though by any means. Just less common.
Thank you Lara for the clarification.
I searched the Frost and Prechter material and googled – couldn’t find the answer. So, what is that one sole exception, where a rule may be broken, please ?
Is it the rule that the 4th wave cannot overlap the territory of 1st wave? This rule will and MUST be broken in diagonals. Is this the one you said is the sole exception?
Gold today has done exactly what was expected.
Since the last swing low on the 27th of October Gold has been moving up, with choppy overlapping movement. This is exactly how price behaves in a consolidation, and exactly what was warned about.
Despite the invalidation by that sharp downwards movement two sessions ago, overall the trend does still appear to be up. But slowly.
I expect the silence here in comments is a reaction to this very difficult market. When volatility and range declines it becomes much harder to make a profit. When price is range bound and consolidating it is much harder to make a profit. This is a difficult market.
Still expect an overall upwards swing up to resistance about 1,305 – 1,310. The target at 1,308 right in this zone of resistance looks entirely reasonable.