
The preferred Elliott wave count did expect a downwards swing to begin early this week. So far this is mostly what has happened.
Summary: Members please note: the second wave count is now strongly preferred. It expects sideways movement to continue probably for all of this week, and then a downwards breakout. If this wave count is correct, then the next upwards swing may present a good entry opportunity for a short position.
Always trade with stops and invest only 1-5% of equity on any one trade.
New updates to this analysis are in bold.
Last monthly charts for the main wave count are here, another monthly alternate is here, and video is here.
Grand SuperCycle analysis is here.
To avoid repeatedly swapping wave counts over while cycle wave b continues, they will be labelled in the order they were developed: first, second and third. At this time, the second wave count is preferred because its Elliott wave structure has a better fit and has more support from classic technical analysis.
FIRST ELLIOTT WAVE COUNT
WEEKLY CHART
Click chart to enlarge.
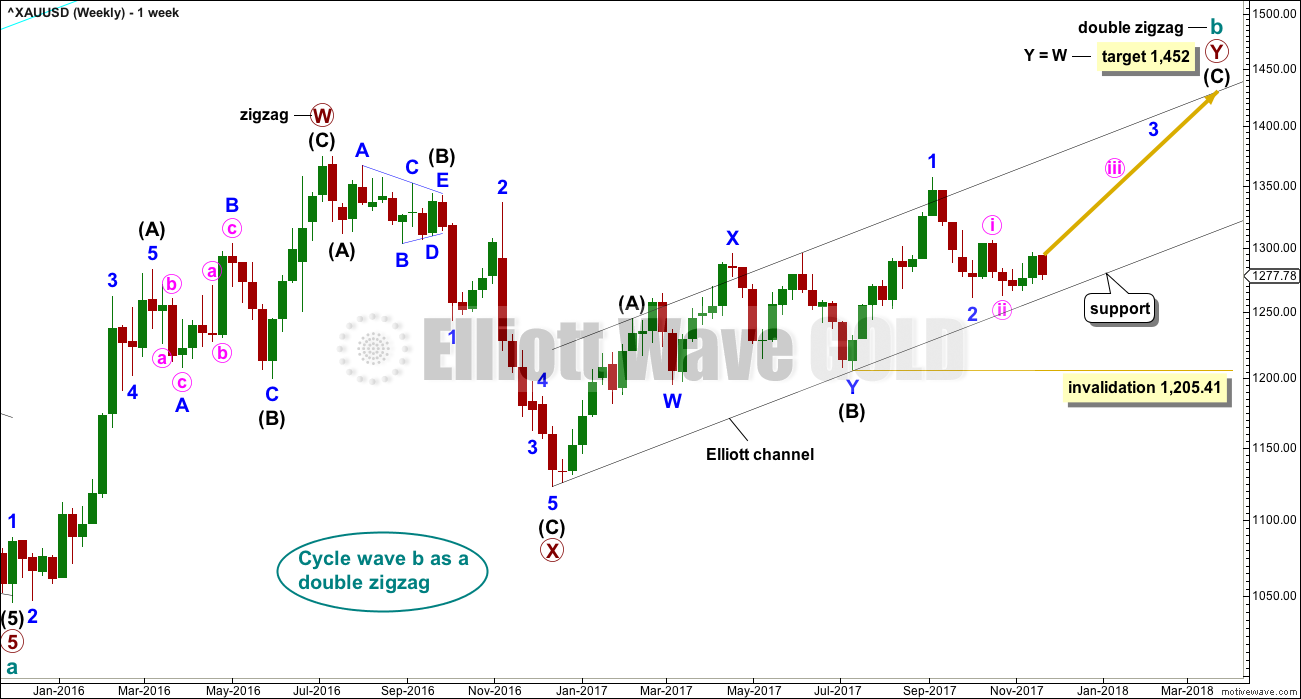
Both wave counts expect that Gold completed a large five down from the all time high in November 2011 to the low of December 2015, which is seen on the left hand side of both weekly charts.
If this analysis is correct, then the five down may not be the completion of the correction. Corrective waves do not subdivide as fives; they subdivide as threes. The five down is seen as cycle wave a within a Super Cycle wave (a).
Both wave counts then expect cycle wave b began in December 2015.
There are more than 23 possible corrective structures that B waves may take. It is important to always have multiple wave counts when B waves are expected.
It looks unlikely that cycle wave b may have been over at the high labelled primary wave W. Primary wave W lasted less than one year at only 31 weeks. Cycle waves should last one to several years and B waves tend to be more time consuming than other Elliott waves, so this movement would be too brief for cycle wave b.
This first wave count expects that cycle wave b may be an incomplete double zigzag.
While this first wave count is entirely possible, there are three problems now which reduce its probability.
1. Cycle wave b is a double zigzag, but primary wave X within the double is deep and time consuming. While this is possible, it is much more common for X waves within double zigzags to be brief and shallow.
2. Intermediate wave (B) within the zigzag of primary wave Y is a double flat correction. These are extremely rare, even rarer than running flats. The rarity of this structure must further reduce the probability of this wave count.
3. Although intermediate wave (C) should be continuing so that primary wave Y ends substantially above the end of primary wave W, the duration of minor wave 2 within it now looks to be too large at the weekly time frame.
Within intermediate wave (C), no second wave correction may move beyond the start of its first wave below 1,205.41. However, prior to invalidation, this wave count may be discarded if price breaks below the lower edge of the black Elliott channel. If this wave count is correct, then intermediate wave (C) should not break below the Elliott channel which contains the zigzag of primary wave Y upwards.
DAILY CHART
Click chart to enlarge.
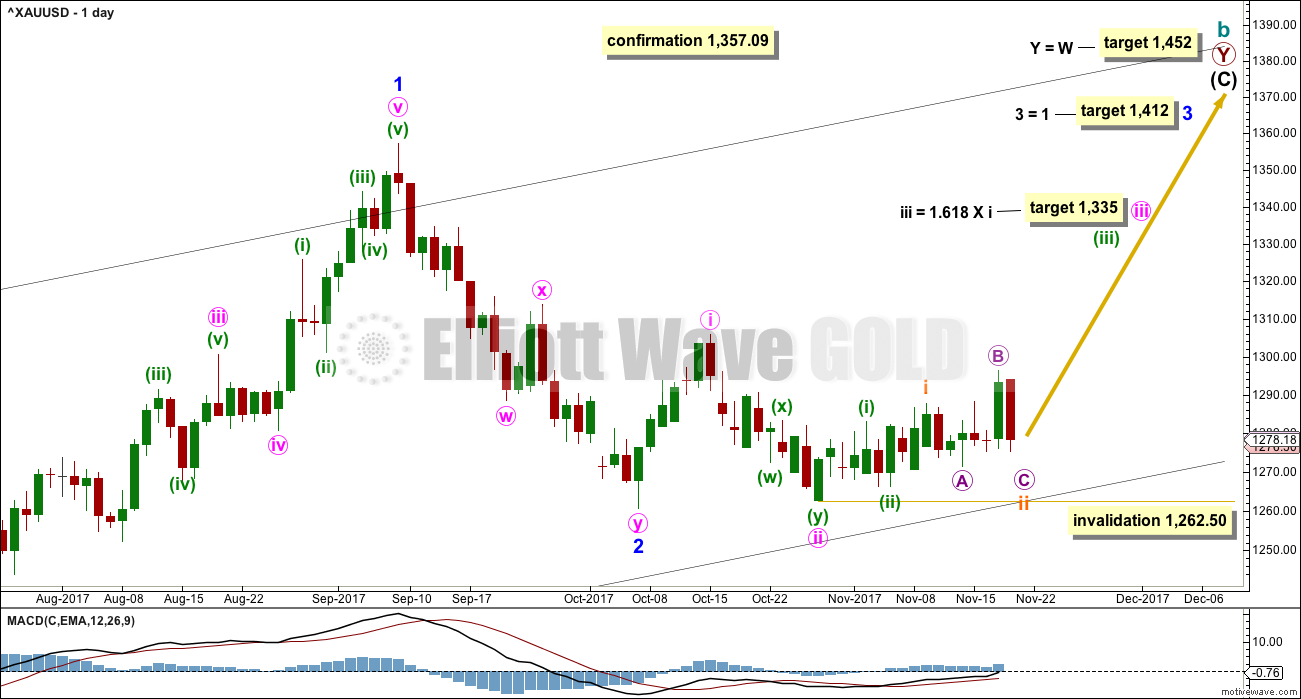
The analysis will focus on the structure of intermediate wave (C). To see details of all the bull movement for this year see daily charts here.
Intermediate wave (C) must be a five wave structure, either an impulse or an ending diagonal. It is unfolding as the more common impulse.
Minor wave 1 was a long extension. The target for minor wave 3 expects that too may be a long extension. If this is the case, then minor wave 5 may be shorter (only two actionary waves in an impulse may be extended).
The target for minute wave iii fits with higher targets and expects it to exhibit the most common Fibonacci ratio to minute wave i.
If price makes a new high above 1,357.09, then the second wave count below would be discarded and more confidence may be had in this first wave count.
This first wave count expects now that recent movement should be the start of a third wave. Friday’s strong upwards movement looked like a convincing beginning to the middle of a third wave, but now Monday’s full retracement of that movement looks wrong for this wave count. Price is not behaving as this wave count expects, so it has a very low probability. It will be published mostly to continue to consider all possibilities.
HOURLY CHART
Click chart to enlarge.
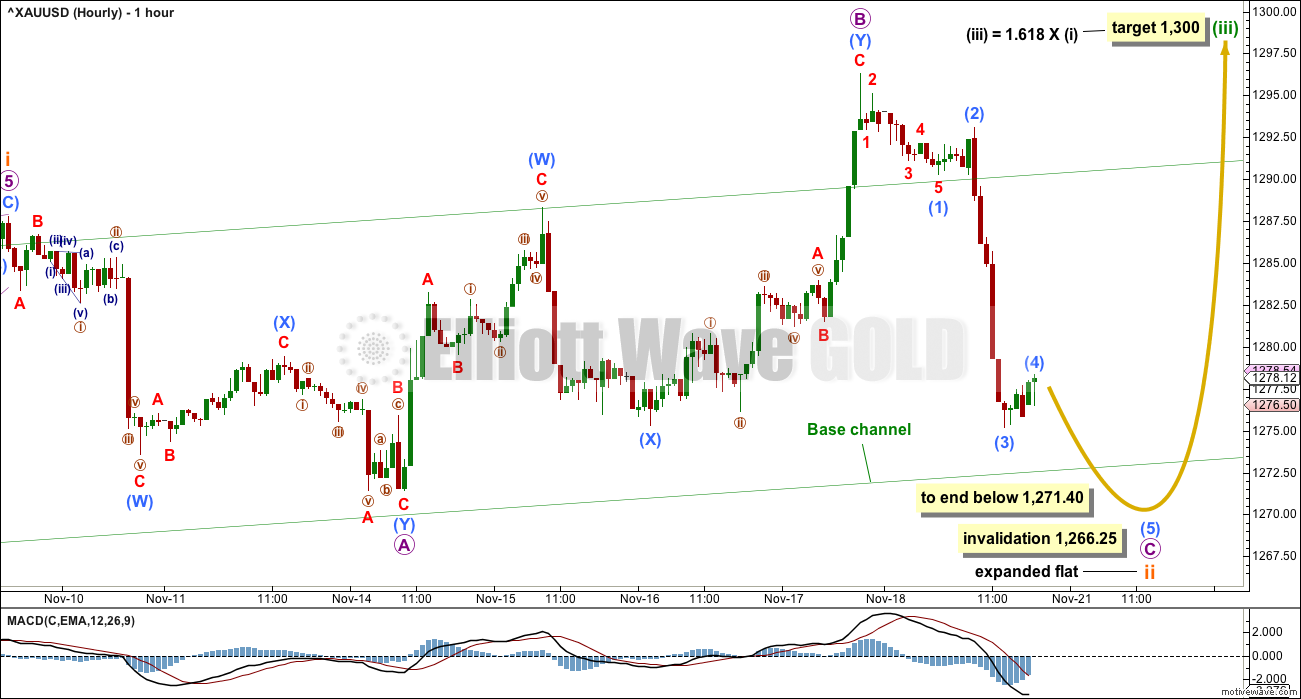
The last wave up is now complete, and it was a three. For this first wave count, it may have been a B wave within an expanded flat correction. Micro wave B here is a 1.52 length to micro wave A. This is longer than the most common length of B waves within flats of up to 1.38, but within the allowable convention of up to 2.
Micro wave C would need to move beyond the end of micro wave A below 1,271.40 for subminuette wave ii to complete as an expanded flat. Failure to do so would see micro wave C truncated, and subminuette wave ii a very rare running flat. At this time, with a lack of upwards momentum, a running flat should not be allowed as part of the wave count. This is not the type of market in which a running flat may occur.
Subminuette wave ii may not move beyond the start of subminuette wave i below 1,266.25.
SECOND ELLIOTT WAVE COUNT
WEEKLY CHART
Click chart to enlarge.
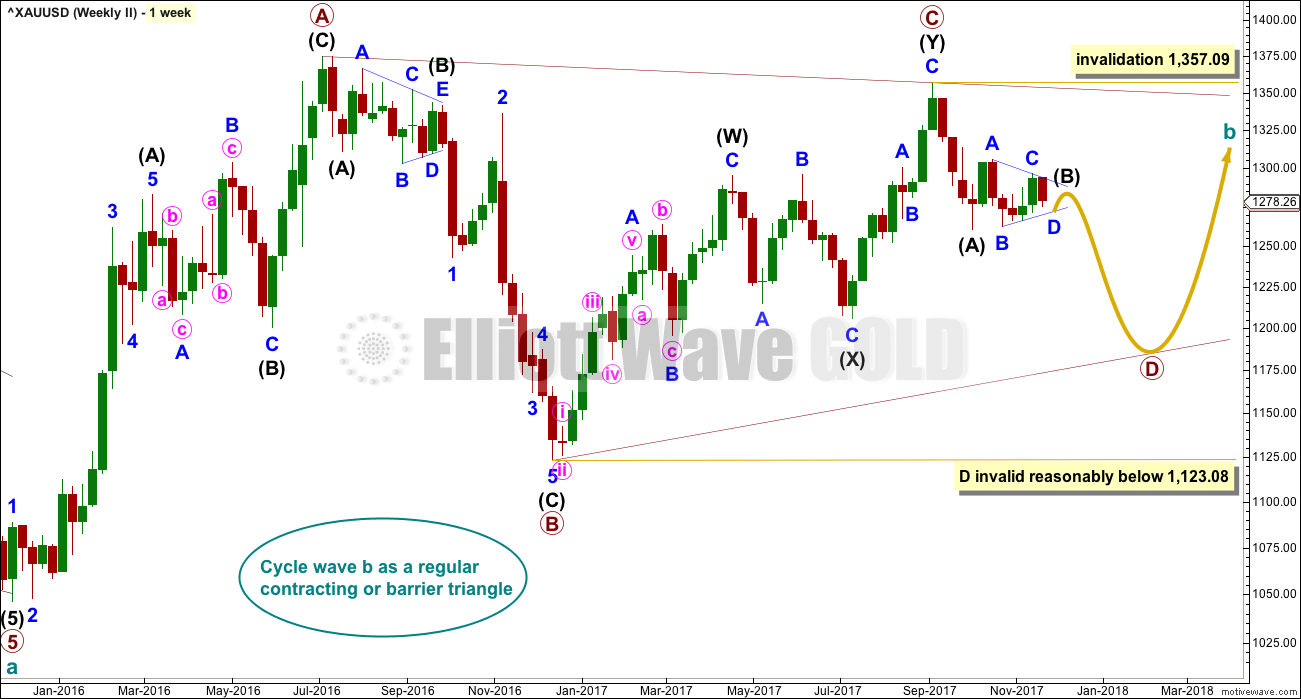
Both wave counts are identical to the low labelled cycle wave a. Thereafter, they look at different possible structures for cycle wave b.
This wave count looks at cycle wave b to be most likely a regular contracting triangle.
The B-D trend line should have a reasonable slope for this triangle to have the right look, because the A-C trend line does not have a strong slope. A barrier triangle has a B-D trend line that is essentially flat; if that happened here, then the triangle trend lines would not converge with a normal look and that looks unlikely.
Primary wave D should be a single zigzag. Only one triangle sub-wave may be a more complicated multiple, and here primary wave C has completed as a double zigzag. This is the most common triangle sub-wave to subdivide as a multiple.
Primary wave D of a contracting triangle may not move beyond the end of primary wave B below 1,123.08.
At its completion, primary wave D should be an obvious three wave structure at the weekly chart level. Within primary wave D, intermediate wave (B) is incomplete. At this stage, it looks like intermediate wave (B) may be unfolding as a triangle. This now has a better fit at the daily and hourly chart level. At its conclusion, intermediate wave (B) should look like a corrective structure at the weekly chart level.
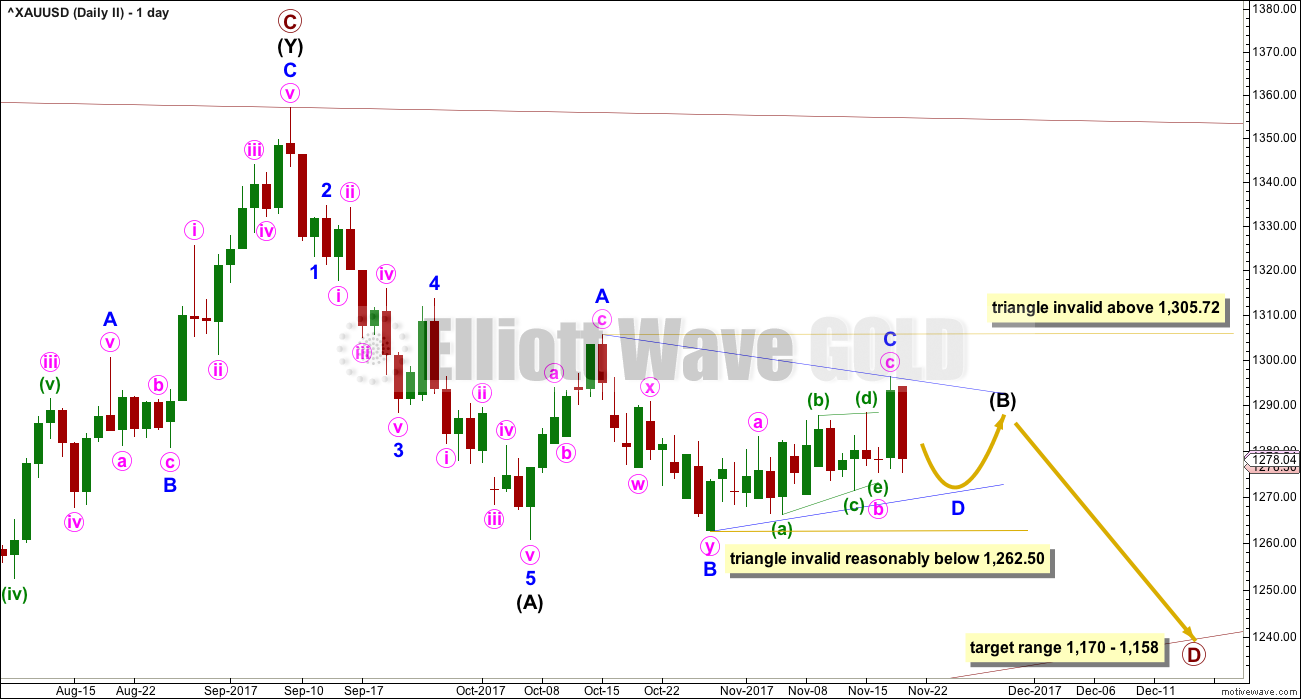
DAILY CHART
Click chart to enlarge.
This is the preferred wave count.
A common length for triangle sub-waves is from 0.8 to 0.85 the length of the prior wave. Primary wave D would reach this range from 1,170 to 1,158.
Primary wave D should subdivide as a zigzag, and within it intermediate wave (B) looks incomplete.
So far intermediate wave (B) has lasted thirty-one sessions; it is incomplete and needs several more sessions now to complete. The next Fibonacci ratio in the sequence is thirty four. If intermediate wave (B) completes as a triangle, then it may not end within a total Fibonacci thirty-four sessions and may need longer than that for the structure to complete. It may either not exhibit a Fibonacci duration, or it may last a total Fibonacci fifty-five sessions.
At this stage, intermediate wave (B) will be labelled as a triangle.
Within the triangle of intermediate wave (B), the zigzag of minor wave C may now be complete.
For a contracting triangle, minor wave D may not move beyond the end of minor wave B below 1,262.50. For a barrier triangle, minor wave D may end about the same level as minor wave B at 1,262.50. The triangle for intermediate wave (B) will remain valid as long as the lower B-D trend line remains essentially flat. Unfortunately, this is the only Elliott wave rule which is not black and white; it involves a subjective grey area.
When minor wave D is complete, then a final zigzag upwards for minor wave E should unfold. Minor wave E would most likely fall short of the A-C trend line. If it does not end there, it may overshoot the trend line slightly. Minor wave E may not move beyond the end of minor wave C.
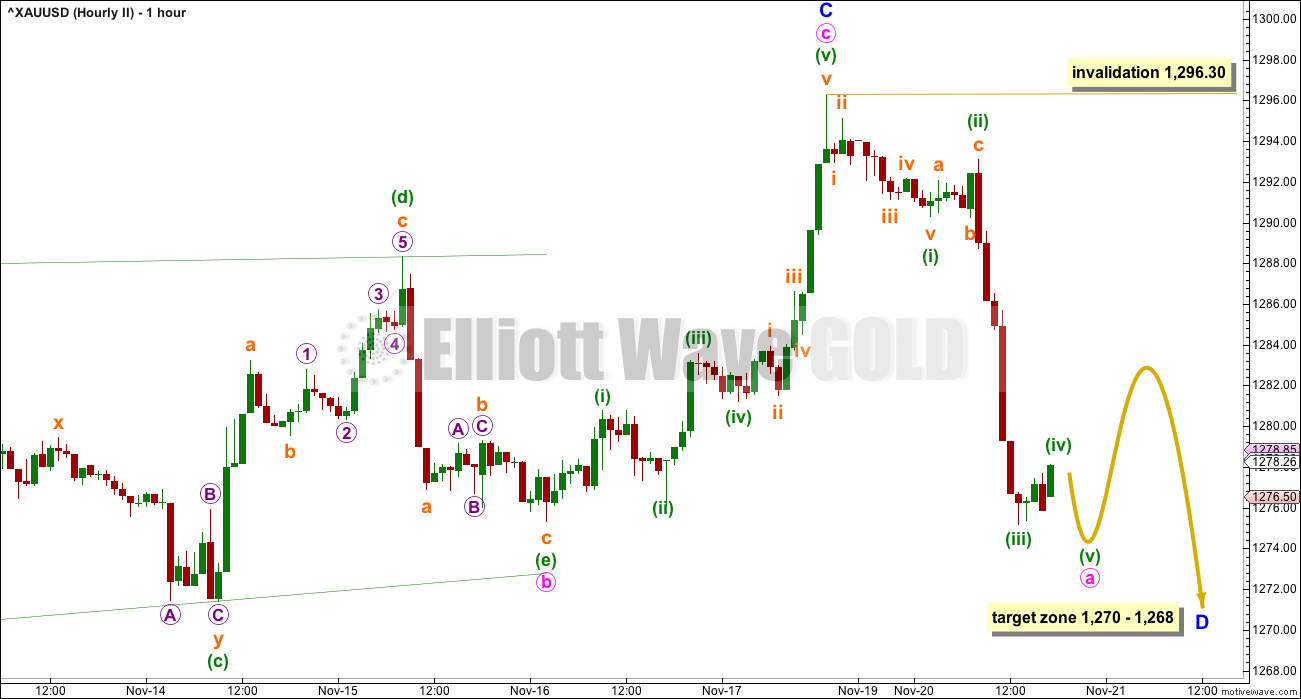
HOURLY CHART
Click chart to enlarge.
Within the possible triangle for intermediate wave (B), so far it is minor wave B that subdivides best as a double zigzag. This means that all remaining sub-waves of the triangle for intermediate wave (B) must be simple A-B-C structures, most likely zigzags, if that portion of the analysis is correct.
Minor wave C now looks complete. Minor wave D downwards should have begun and must subdivide as a simple A-B-C structure; the most common structure would be a zigzag by a reasonable margin.
If this wave count is wrong in the short term, it may be in labelling minute wave a as incomplete. It is possible that minute wave a was complete at today’s low.
When minute wave a is a complete impulse, then minute wave b should unfold. It may last more than 24 hours and be a complicated sideways choppy movement. Minute wave b may not move beyond the start of minute wave a above 1,296.30.
THIRD ELLIOTT WAVE COUNT
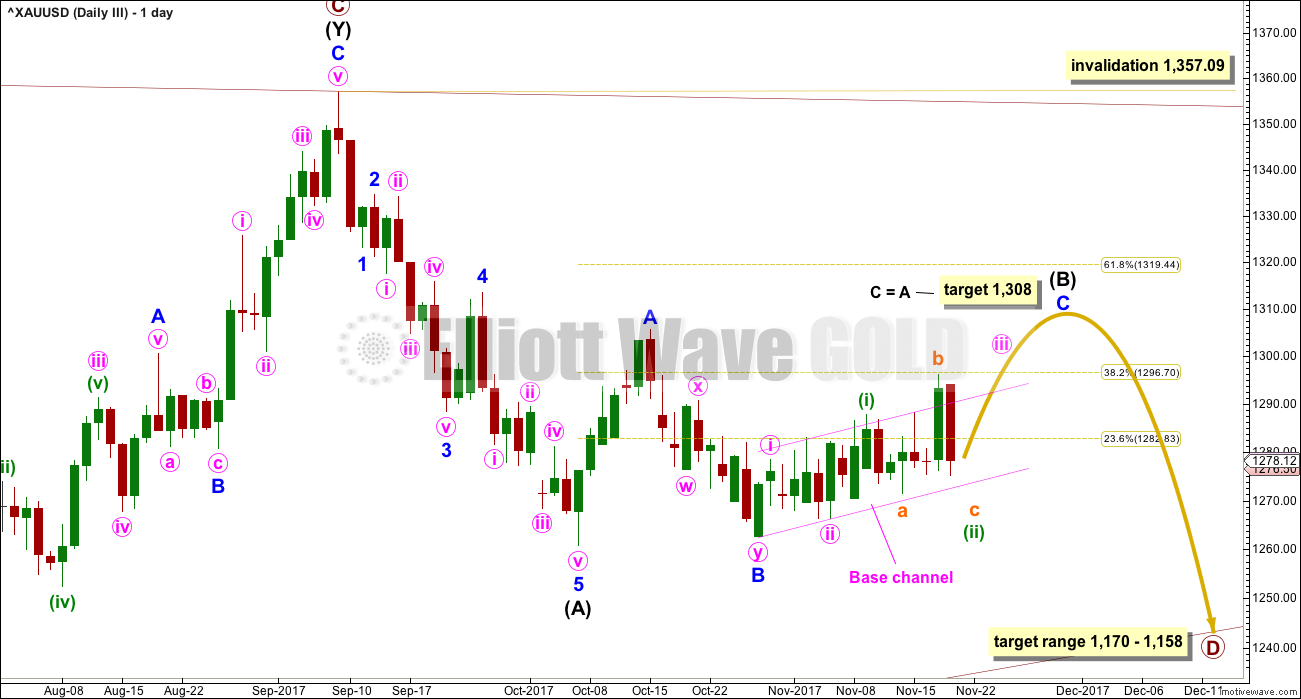
DAILY CHART
Click chart to enlarge.
This third wave count looks at intermediate wave (B) as a flat correction. Within a zigzag, minor wave C would need further upwards movement for the structure to complete. The target at 1,308 remains the same.
Minor wave C must subdivide as a five wave structure. So far within it, minute waves i and ii, and minuette waves (i) and (ii), may be complete.
The strong downwards movement for Monday does not look right for this wave count. By now minor wave C upwards should have shown clearer upwards movement as the middle of its third wave unfolds.
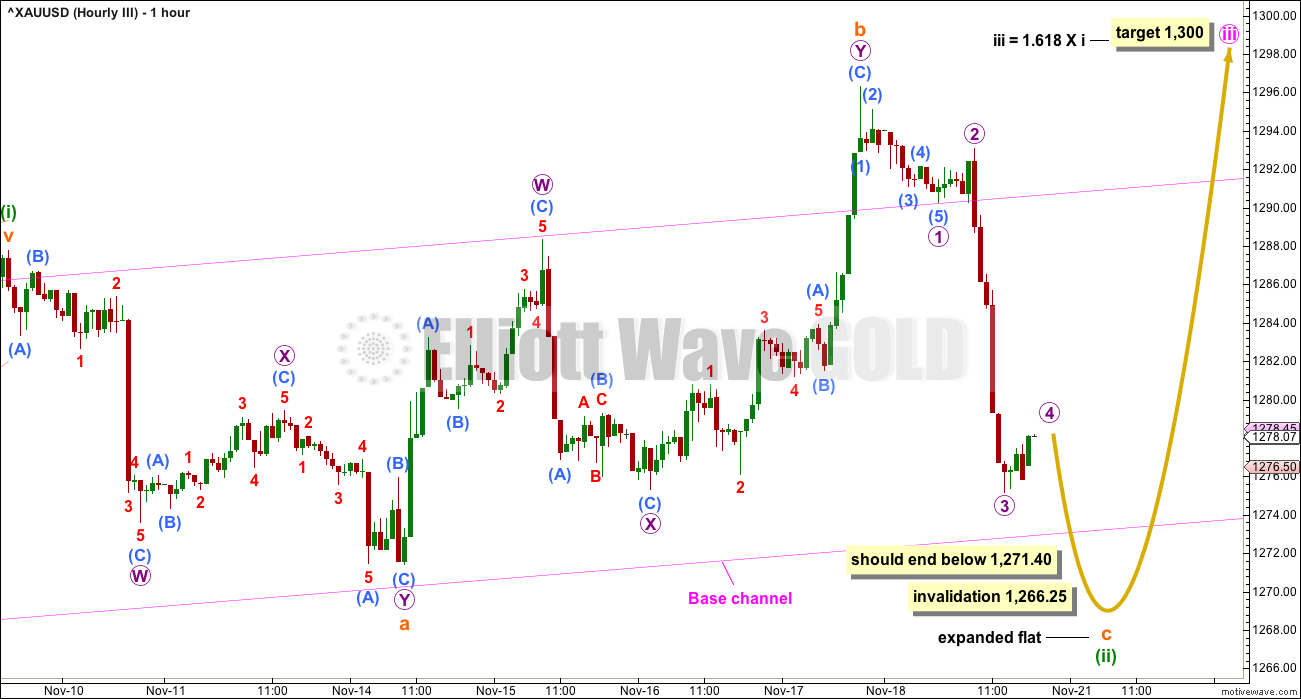
HOURLY CHART
Click chart to enlarge.
If intermediate wave (B) is unfolding as a flat correction, then minor wave C upwards must subdivide as a five wave structure. It may be either an impulse or an ending diagonal.
The middle of the third wave cannot have yet passed.
I have considered the possibility that an ending diagonal may be unfolding for minor wave C, but at this stage I have not been able to find a solution which meets all Elliott wave rules.
This wave count looks at the possibility that an expanded flat correction is unfolding for another second wave, in the same way that the first wave count does. For the short term, both this third and the first wave counts expect the same movement next.
TECHNICAL ANALYSIS
WEEKLY CHART
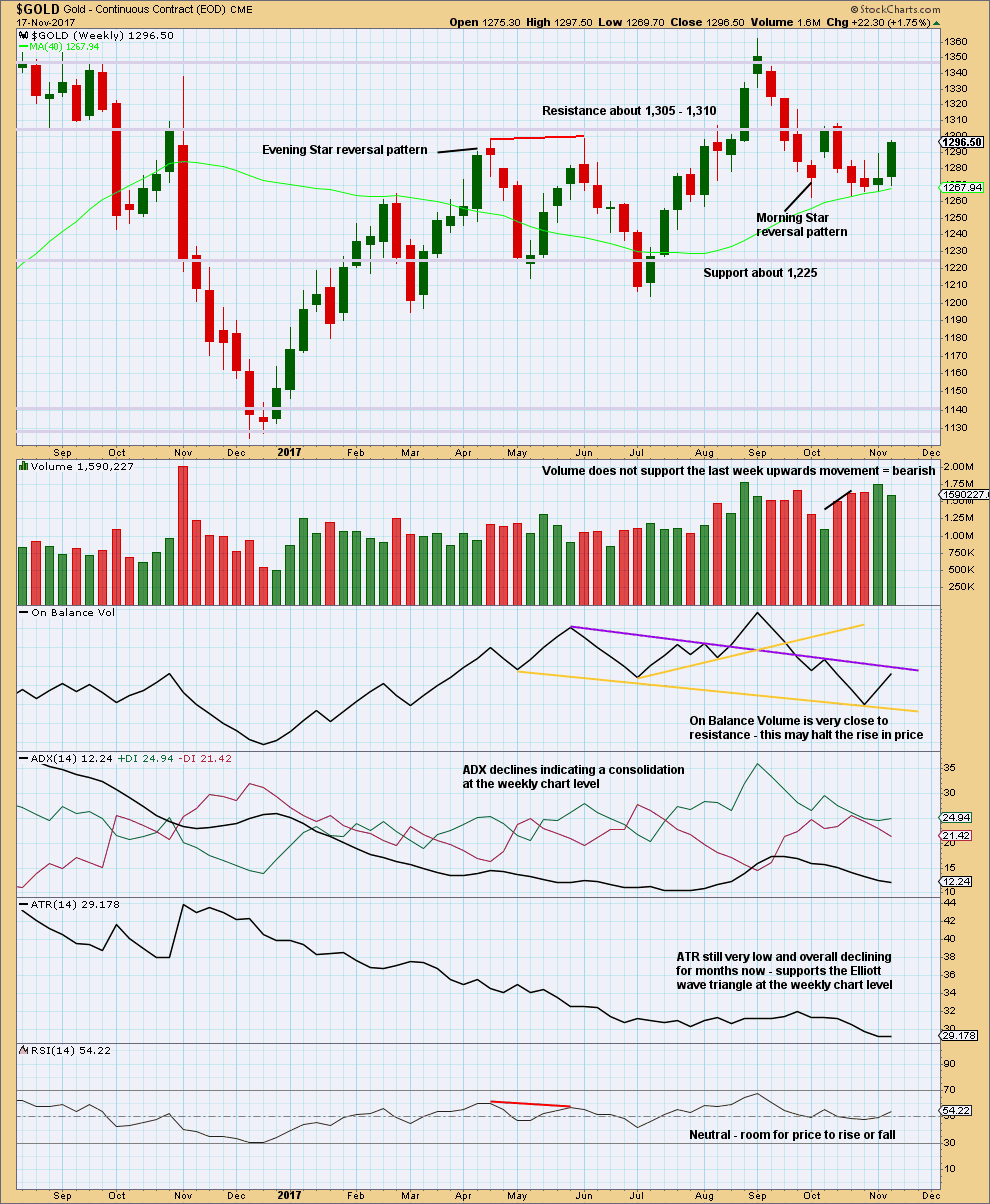
Click chart to enlarge. Chart courtesy of StockCharts.com.
All commentary this week is on the chart.
On Balance Volume at the weekly chart level favours the second wave count.
DAILY CHART
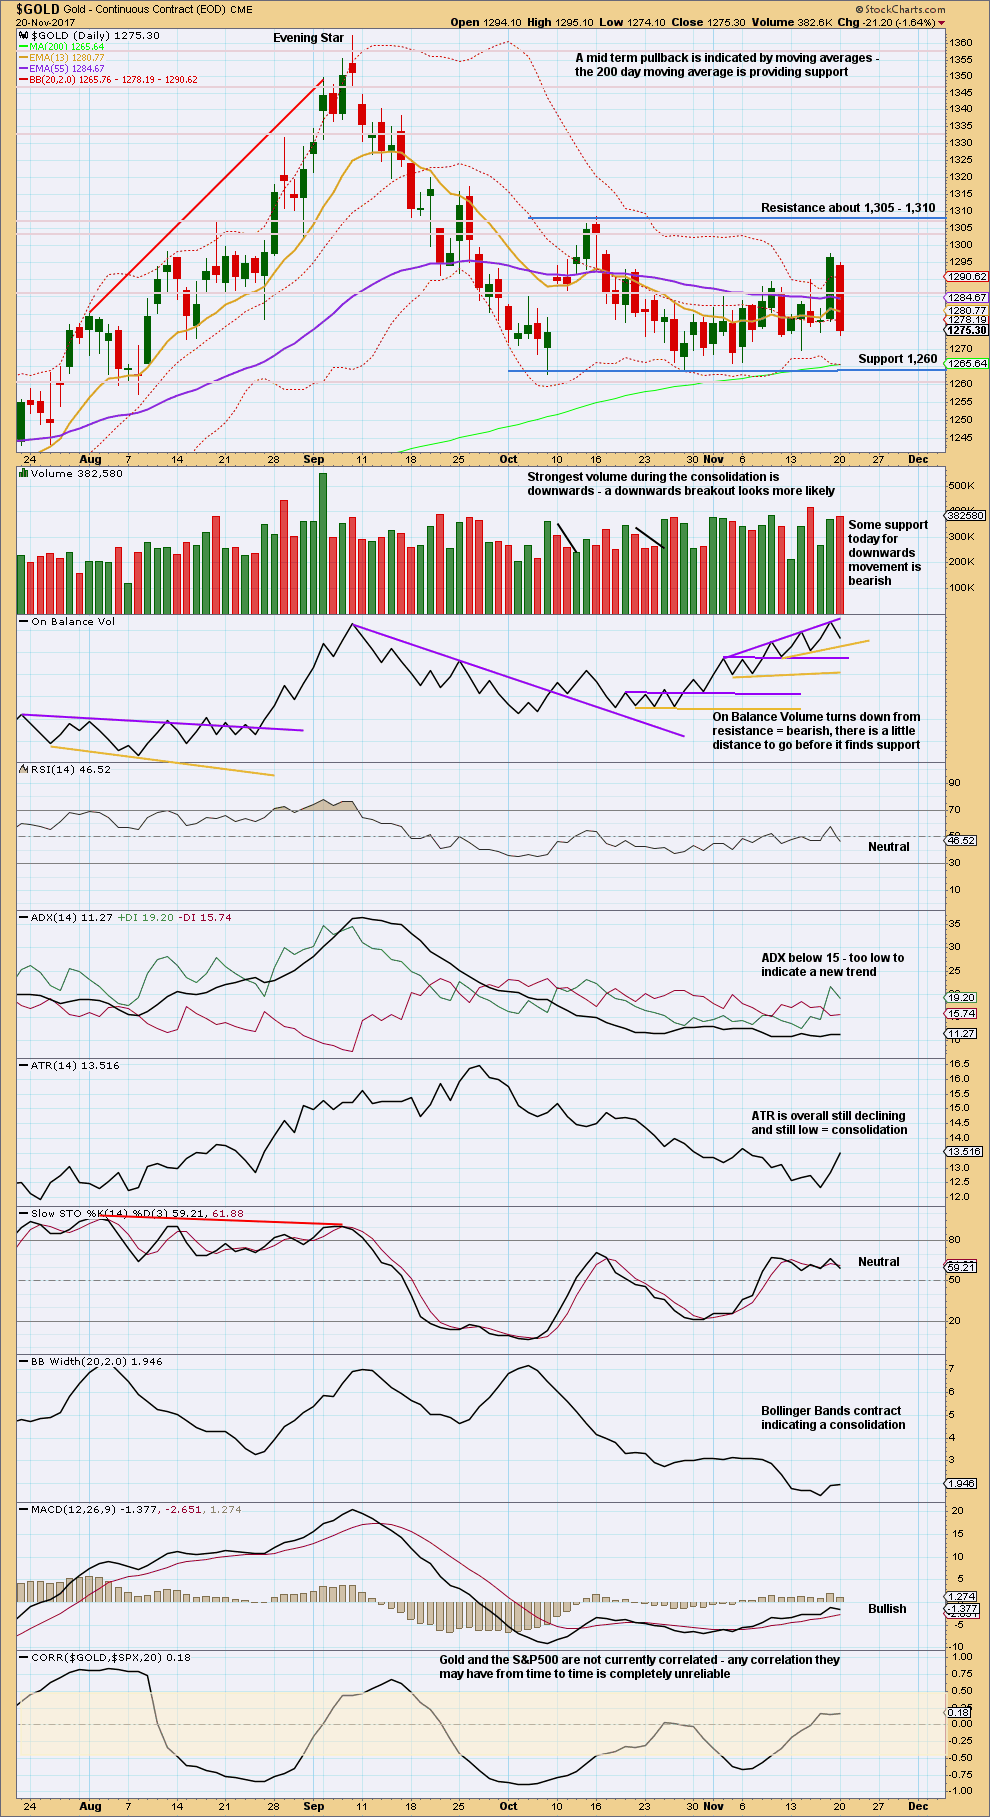
Click chart to enlarge. Chart courtesy of StockCharts.com.
The consolidation continues, with resistance and support delineated by blue trend lines.
Volume agrees with the preferred Elliott wave count; it looks like the breakout may more likely be down.
On Balance Volume is constrained.
Trading consolidating markets is much more difficult and more risky than trading trending markets. Members are advised to be patient and wait for a breakout. More experienced members who are trading this market are advised to reduce risk to only 1-3% of equity.
GDX DAILY CHART
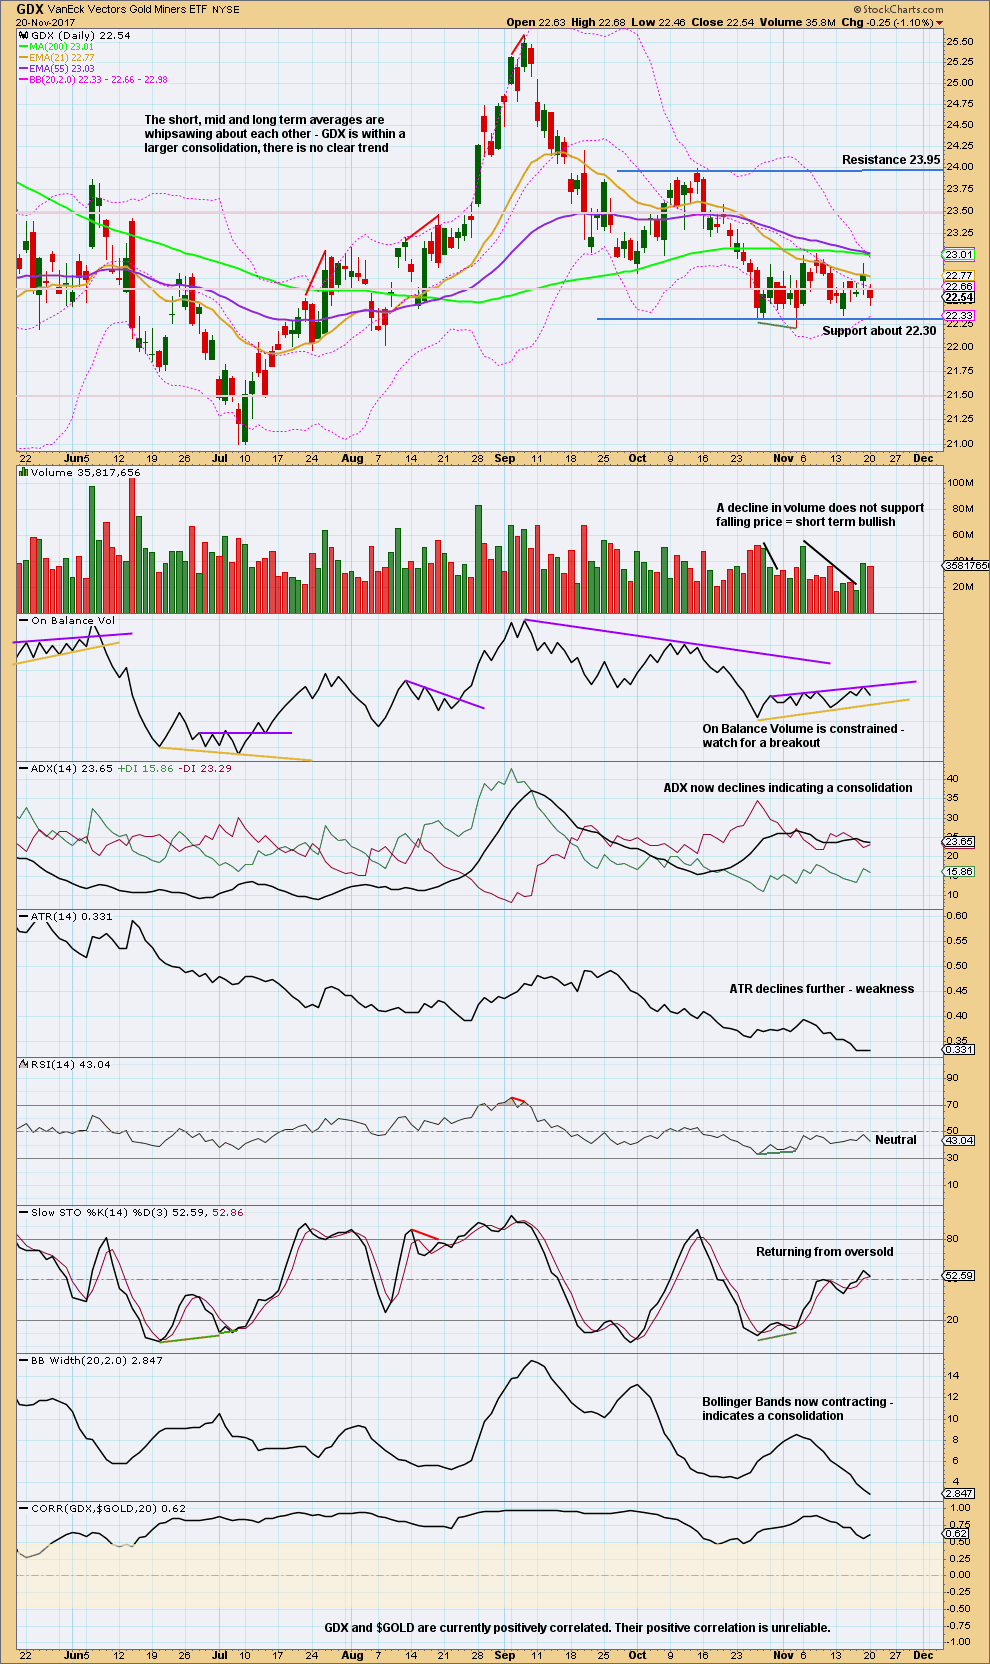
Click chart to enlarge. Chart courtesy of StockCharts.com.
An upwards swing may be expected to continue to resistance about 23.95.
Price does not move in straight lines within consolidations, making them poor trading opportunities. If trading this upwards swing, then reduce risk to only 1-3% of equity to acknowledge higher risk.
Published @ 07:49 p.m. EST.
For the preferred count, the second, hourly chart updated:
Minute a now looks to be over. This current bounce looks to be too large to be part of the last wave down, it looks like minute b.
Minute b could be over here as a single zigzag ending close to the 0.382 Fibonacci ratio of minute a OR it could (equally as likely) take longer and move higher as a double zigzag to end closer to the 0.618 Fibonacci ratio.
Either way, minor D still looks incomplete. It should take longer.
Still expecting overall sideways movement this week as a triangle comes to completion for intermediate (B). Still expecting a downwards breakout as most likely when that is done.
Thank you for timely update
🙂 You’re most welcome
Triangles are my favorite EW structures as they are SO predictable. The completion of minor E should be a chance for a great trade! 🙂
Something I’m watching for the Juniors. While a new low is not required, if a new low is made between 31.53 and 31.06, then an ending contracting diagonal may be in play to end Minor C of Intermediate E for the triangle.
This is likely the last chance for the triangle to end as shown. Below 31.06 would lead to much lower prices.
The bull is not dead, but it is at a key inflection point.
https://www.tradingview.com/x/r8a5bD4c/
Couple of promo videos from Gann Global have an interesting perspective on the miners. Big upleg has high probability based on historical bear markets and strong initial breakout in 2016.
http://www.gannglobal.com/webinar/2017/11/17-11-12-Video-1-Webinar-Replay-321-post.php
http://www.gannglobal.com/webinar/2017/11/17-11-20-Video-6-Offer-Is-Open-EWI.php?inf_contact_key=28daa80f0d70887c9a8ced278c2879fca3bbf9101171d4b162e6351476e5fc96
Yes, I watched those. A lot of good historical data. He thinks we go lower first though. Daily gold posted something similar
https://thedailygold.com/what-history-says-for-gold-stocks-in-2018-2019/
Dreamer,
I am curious of your opinion on ABX…ABX being a key component of GDX
Thanks.
I’ll get back to you 🤔
Juniors are at a key decision point
The miners are doing everything they can to challenge us