
The preferred Elliott wave count has expected sideways movement this week. So far this is exactly how price is behaving.
Summary: Members please note: the second wave count is now strongly preferred. It expects sideways movement to continue probably for all of this week, and then a downwards breakout. If this wave count is correct, then the next upwards swing may present a good entry opportunity for a short position.
For the very short term, volume for both Gold and GDX are bearish; a small downwards swing may unfold (may be preceded by some more sideways movement).
Always trade with stops and invest only 1-5% of equity on any one trade.
New updates to this analysis are in bold.
Last monthly charts for the main wave count are here, another monthly alternate is here, and video is here.
Grand SuperCycle analysis is here.
To avoid repeatedly swapping wave counts over while cycle wave b continues, they will be labelled in the order they were developed: first, second and third. At this time, the second wave count is preferred because its Elliott wave structure has a better fit and has more support from classic technical analysis.
FIRST ELLIOTT WAVE COUNT
WEEKLY CHART
Click chart to enlarge.
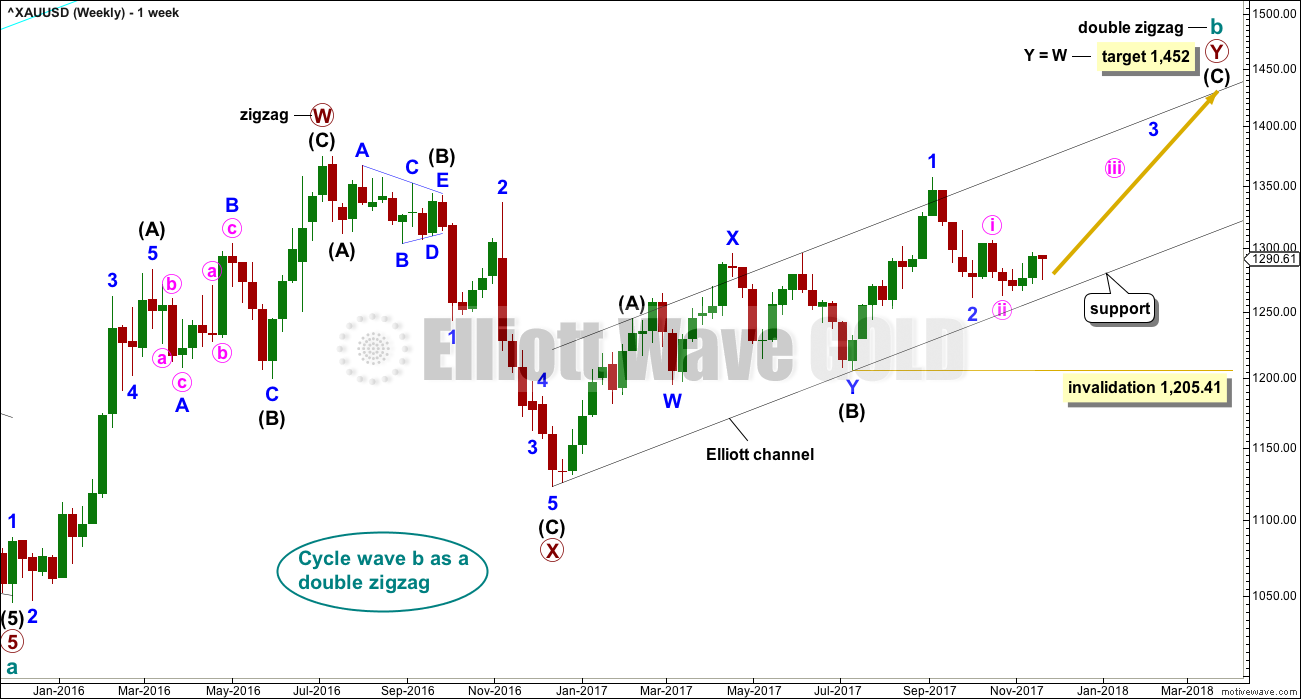
Both wave counts expect that Gold completed a large five down from the all time high in November 2011 to the low of December 2015, which is seen on the left hand side of both weekly charts.
If this analysis is correct, then the five down may not be the completion of the correction. Corrective waves do not subdivide as fives; they subdivide as threes. The five down is seen as cycle wave a within Super Cycle wave (a).
Both wave counts then expect cycle wave b began in December 2015.
There are more than 23 possible corrective structures that B waves may take. It is important to always have multiple wave counts when B waves are expected.
It looks unlikely that cycle wave b may have been over at the high labelled primary wave W. Primary wave W lasted less than one year at only 31 weeks. Cycle waves should last one to several years and B waves tend to be more time consuming than other Elliott waves, so this movement would be too brief for cycle wave b.
This first wave count expects that cycle wave b may be an incomplete double zigzag.
While this first wave count is entirely possible, there are three problems now which reduce its probability.
1. Cycle wave b is a double zigzag, but primary wave X within the double is deep and time consuming. While this is possible, it is much more common for X waves within double zigzags to be brief and shallow.
2. Intermediate wave (B) within the zigzag of primary wave Y is a double flat correction. These are extremely rare, even rarer than running flats. The rarity of this structure must further reduce the probability of this wave count.
3. Although intermediate wave (C) should be continuing so that primary wave Y ends substantially above the end of primary wave W, the duration of minor wave 2 within it now looks to be too large at the weekly time frame.
Within intermediate wave (C), no second wave correction may move beyond the start of its first wave below 1,205.41. However, prior to invalidation, this wave count may be discarded if price breaks below the lower edge of the black Elliott channel. If this wave count is correct, then intermediate wave (C) should not break below the Elliott channel which contains the zigzag of primary wave Y upwards.
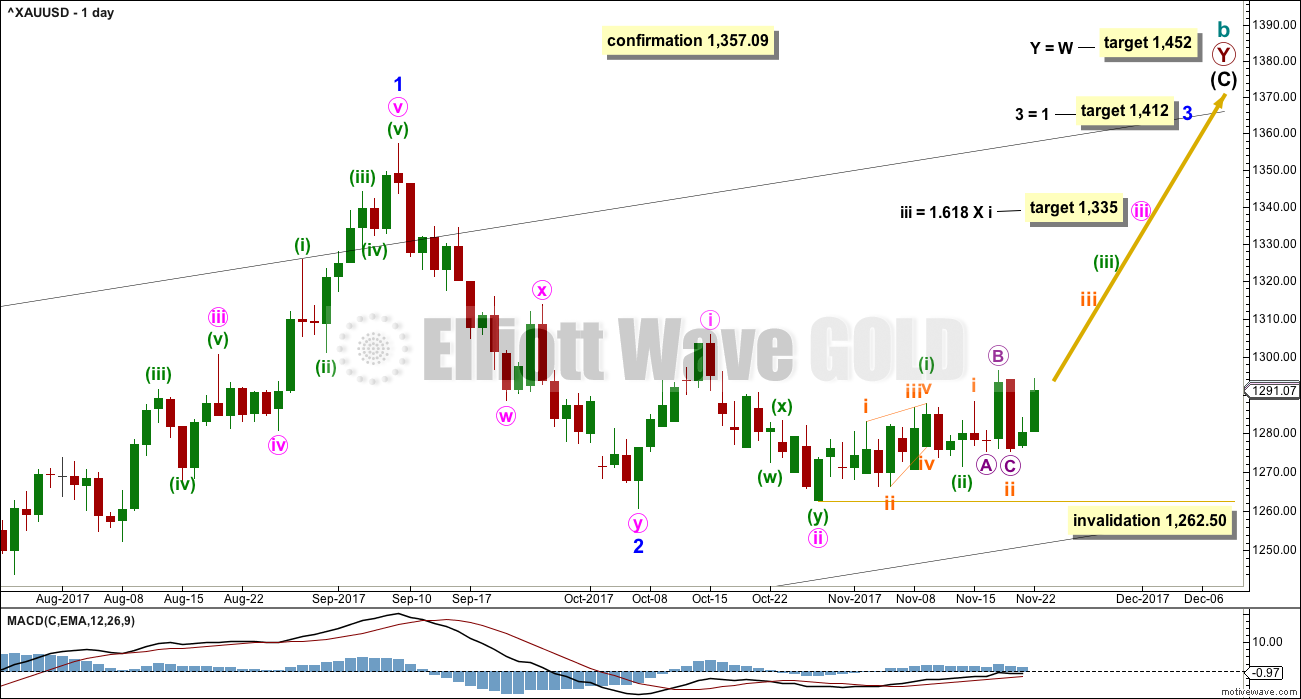
DAILY CHART
Click chart to enlarge.
The analysis will focus on the structure of intermediate wave (C). To see details of all the bull movement for this year see daily charts here.
Intermediate wave (C) must be a five wave structure, either an impulse or an ending diagonal. It is unfolding as the more common impulse.
Minor wave 1 was a long extension. The target for minor wave 3 expects that too may be a long extension. If this is the case, then minor wave 5 may be shorter (only two actionary waves in an impulse may be extended).
The target for minute wave iii fits with higher targets and expects it to exhibit the most common Fibonacci ratio to minute wave i.
If price makes a new high above 1,357.09, then the second wave count below would be discarded and more confidence may be had in this first wave count.
This first wave count now expects there should be a series of four overlapping first and second waves: minor, minute, minuette, and now subminuette. The labelling of recent movement up from the low at 1,262.50 on the 27th of October is changed today. Minuette wave (i) may have been a leading contracting diagonal, minuette wave (ii) a zigzag, subminuette wave i an impulse, and subminuette wave ii an expanded flat correction.
The green base channel is copied over to the hourly chart.
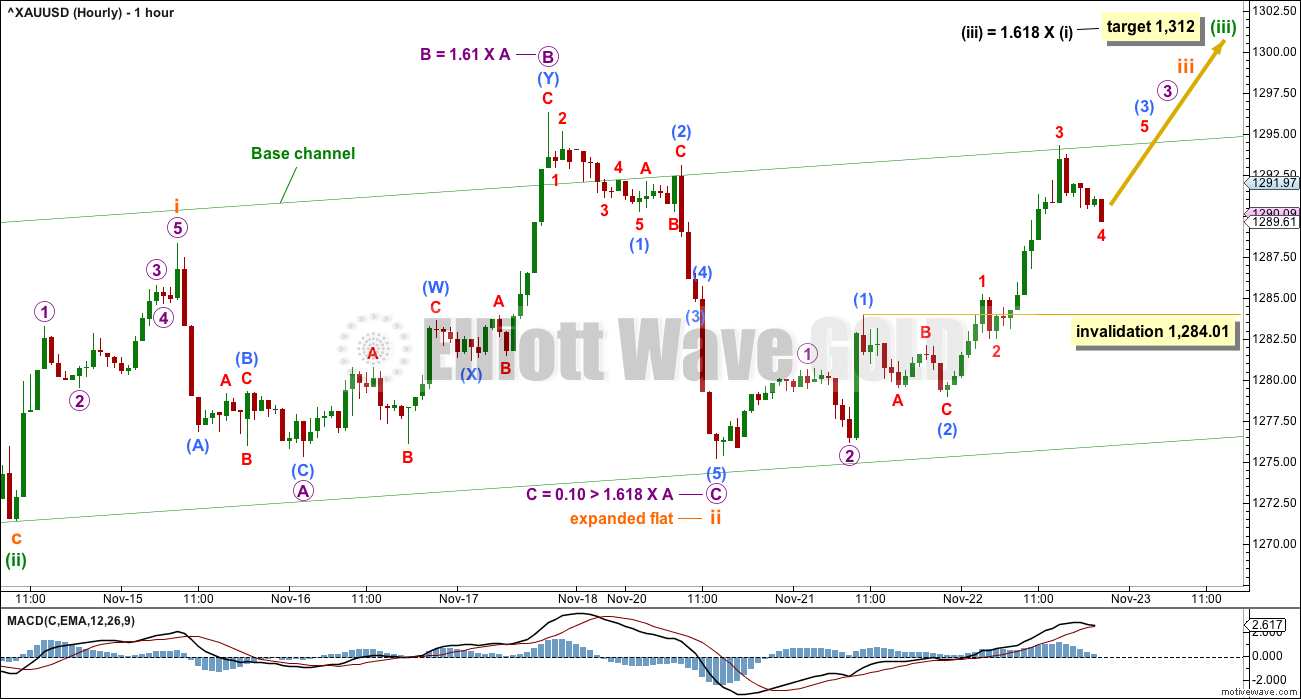
HOURLY CHART
Click chart to enlarge.
Subminuette wave i must be seen as a five wave structure for this wave count to work. This upwards wave looks better as a zigzag than it does as an impulse. The probability of this wave count must be reduced slightly.
If this wave count is correct, then downwards movement should continue to find support at the lower edge of the base channel. A clear breach of that channel by downwards movement would be an early indication that this first wave count may be wrong and the second wave count below may be right.
Third waves may only subdivide as impulses. Within micro wave 3, the correction to come for sub-micro wave (4) may not move into sub-micro wave (1) price territory below 1,284.01.
The target for minuette wave (iii) is recalculated because minuette wave (i) is adjusted.
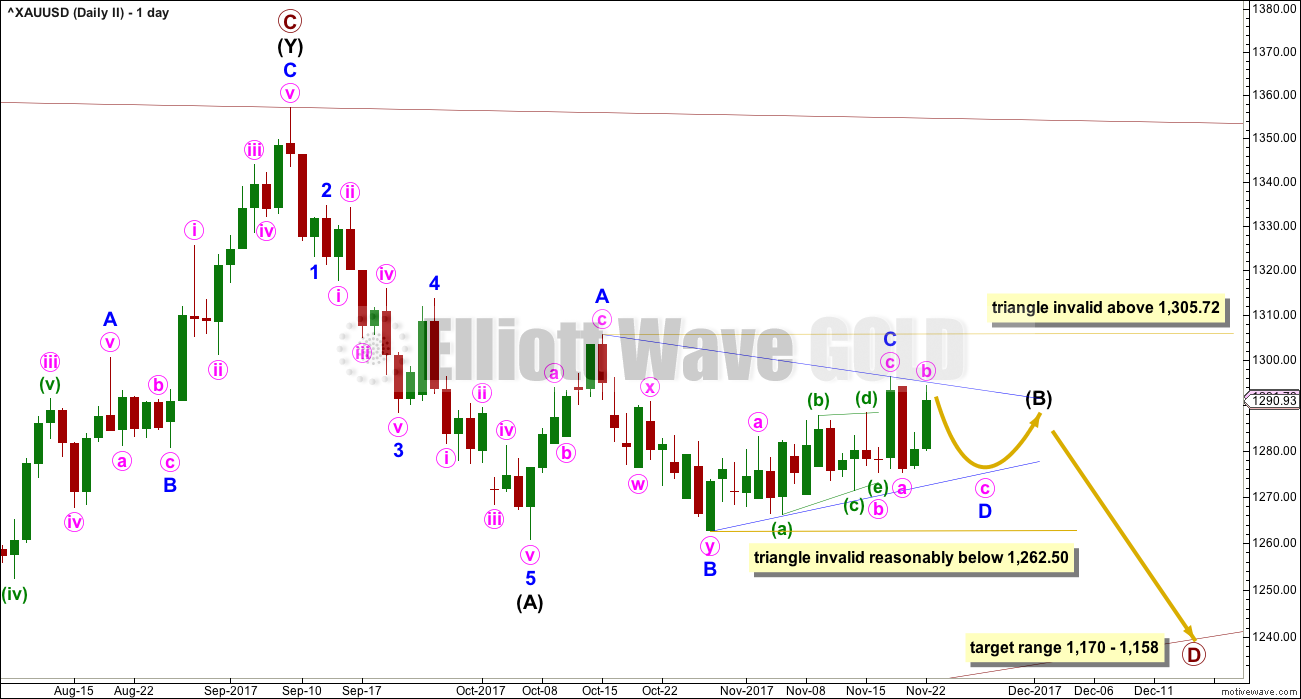
SECOND ELLIOTT WAVE COUNT
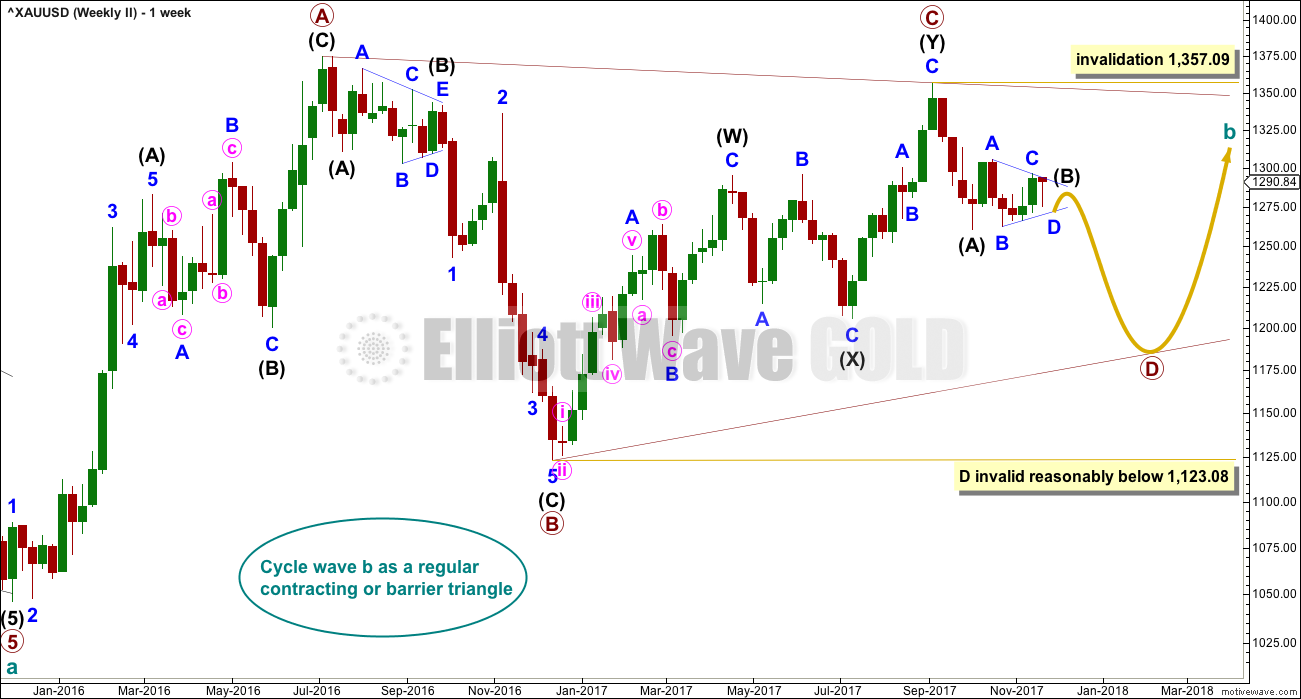
WEEKLY CHART
Click chart to enlarge.
Both wave counts are identical to the low labelled cycle wave a. Thereafter, they look at different possible structures for cycle wave b.
This wave count looks at cycle wave b to be most likely a regular contracting triangle.
The B-D trend line should have a reasonable slope for this triangle to have the right look, because the A-C trend line does not have a strong slope. A barrier triangle has a B-D trend line that is essentially flat; if that happened here, then the triangle trend lines would not converge with a normal look and that looks unlikely.
Primary wave D should be a single zigzag. Only one triangle sub-wave may be a more complicated multiple, and here primary wave C has completed as a double zigzag. This is the most common triangle sub-wave to subdivide as a multiple.
Primary wave D of a contracting triangle may not move beyond the end of primary wave B below 1,123.08.
At its completion, primary wave D should be an obvious three wave structure at the weekly chart level. Within primary wave D, intermediate wave (B) is incomplete. At this stage, it looks like intermediate wave (B) may be unfolding as a triangle. This now has a better fit at the daily and hourly chart level. At its conclusion, intermediate wave (B) should look like a corrective structure at the weekly chart level.
DAILY CHART
Click chart to enlarge.
This is the preferred wave count.
A common length for triangle sub-waves is from 0.8 to 0.85 the length of the prior wave. Primary wave D would reach this range from 1,170 to 1,158.
Primary wave D should subdivide as a zigzag, and within it intermediate wave (B) looks incomplete.
So far intermediate wave (B) has lasted thirty-three sessions; it is incomplete and needs several more sessions now to complete. The next Fibonacci ratio in the sequence is thirty four. If intermediate wave (B) completes as a triangle, then it may not end within a total Fibonacci thirty-four sessions and may need longer than that for the structure to complete. It may either not exhibit a Fibonacci duration, or it may last a total Fibonacci fifty-five sessions.
At this stage, intermediate wave (B) will be labelled as a triangle.
Within the triangle of intermediate wave (B), the zigzag of minor wave C may now be complete.
For a contracting triangle, minor wave D may not move beyond the end of minor wave B below 1,262.50. For a barrier triangle, minor wave D may end about the same level as minor wave B at 1,262.50. The triangle for intermediate wave (B) will remain valid as long as the lower B-D trend line remains essentially flat. Unfortunately, this is the only Elliott wave rule which is not black and white; it involves a subjective grey area.
When minor wave D is complete, then a final zigzag upwards for minor wave E should unfold. Minor wave E would most likely fall short of the A-C trend line. If it does not end there, it may overshoot the trend line slightly. Minor wave E may not move beyond the end of minor wave C.
Although minor wave C now looks most likely complete, patience and flexibility are important when triangles are considered. The upper invalidation point will be left at the same point to allow for the possibility that minor wave C may not be complete and may yet move higher. It may not move beyond the end of minor wave A above 1,305.72.
At this stage, it looks like the high for today’s session has ended with strong resistance at the upper A-C trend line. Triangles normally adhere very well to their trend lines and fairly often the trend lines are tested within the triangle sub-waves. This so far looks typical. If this wave count is correct, then price should find very strong resistance at this stage at the A-C trend line.
HOURLY CHART
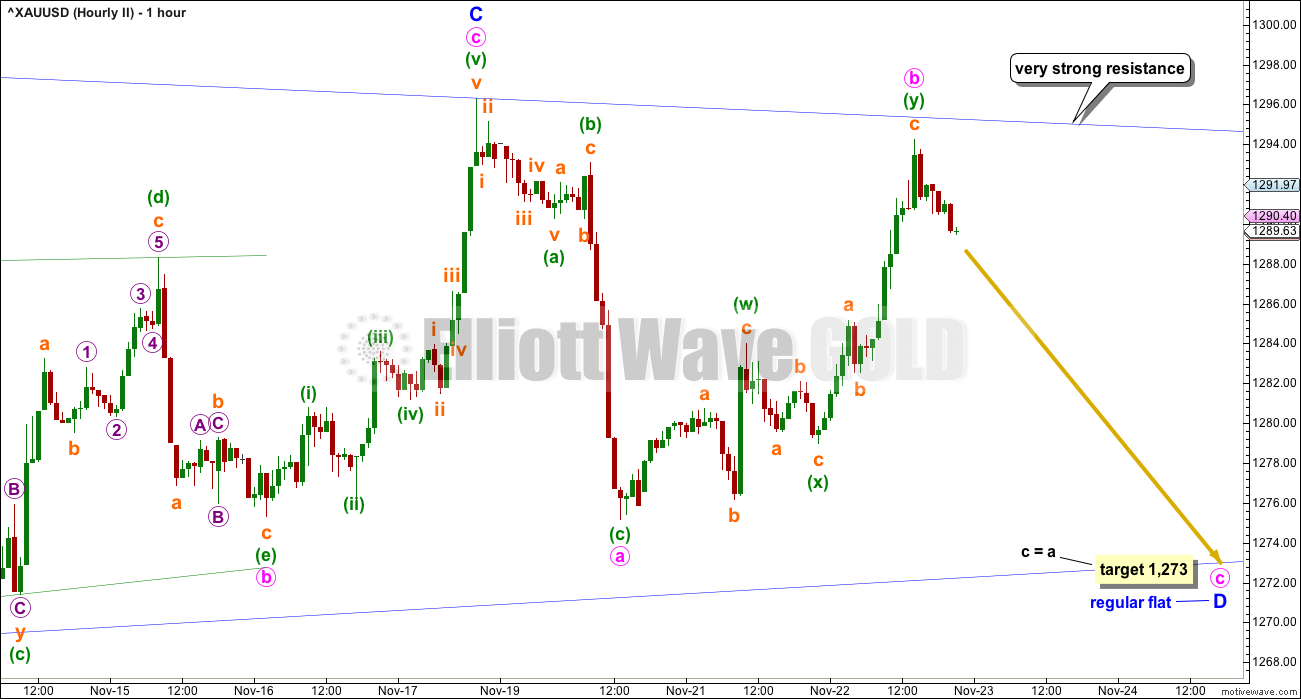
Click chart to enlarge.
Within the possible triangle for intermediate wave (B), so far it is minor wave B that subdivides best as a double zigzag. This means that all remaining sub-waves of the triangle for intermediate wave (B) must be simple A-B-C structures, most likely zigzags, if that portion of the analysis is correct.
Minor wave C now looks complete. Minor wave D downwards should have begun and must subdivide as a simple A-B-C structure; the most common structure would be a zigzag by a reasonable margin.
While minor wave D would most likely be a zigzag, it does not have to be. A regular flat correction has a better fit at this stage, and will still meet Elliott wave rules for a triangle.
Within the possible regular flat, both minute waves a and b subdivide as threes: minute wave a as a single zigzag and minute wave b as a double zigzag. This portion of the wave count has a better fit than the first and third Elliott wave counts.
Minute wave b may have ended almost at the upper A-C triangle trend line. Minute wave b is a 0.90 length of minute wave a, meeting the minimum requirement for B waves within flats.
A target is calculated for minute wave c.
THIRD ELLIOTT WAVE COUNT
DAILY CHART
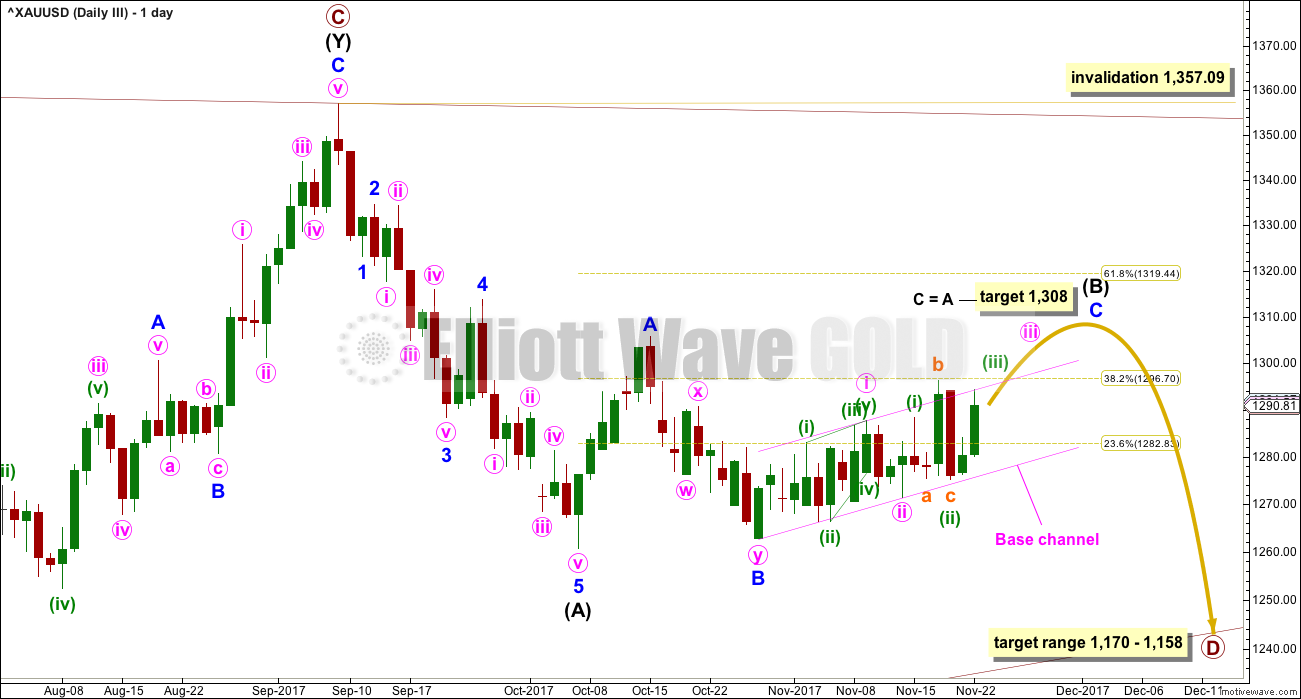
Click chart to enlarge.
This third wave count looks at intermediate wave (B) as a flat correction. Within a zigzag, minor wave C would need further upwards movement for the structure to complete. The target at 1,308 remains the same.
Minor wave C must subdivide as a five wave structure. So far within it, minute waves i and ii, and minuette waves (i) and (ii), may be complete.
Analysis of most recent movement is adjusted today for this wave count; it is seen in the same way as for the first wave count.
This wave count would now expect a breach of the upper edge of the pink base channel. Third waves should have the power to break through base channels in the direction of the trend.
HOURLY CHART
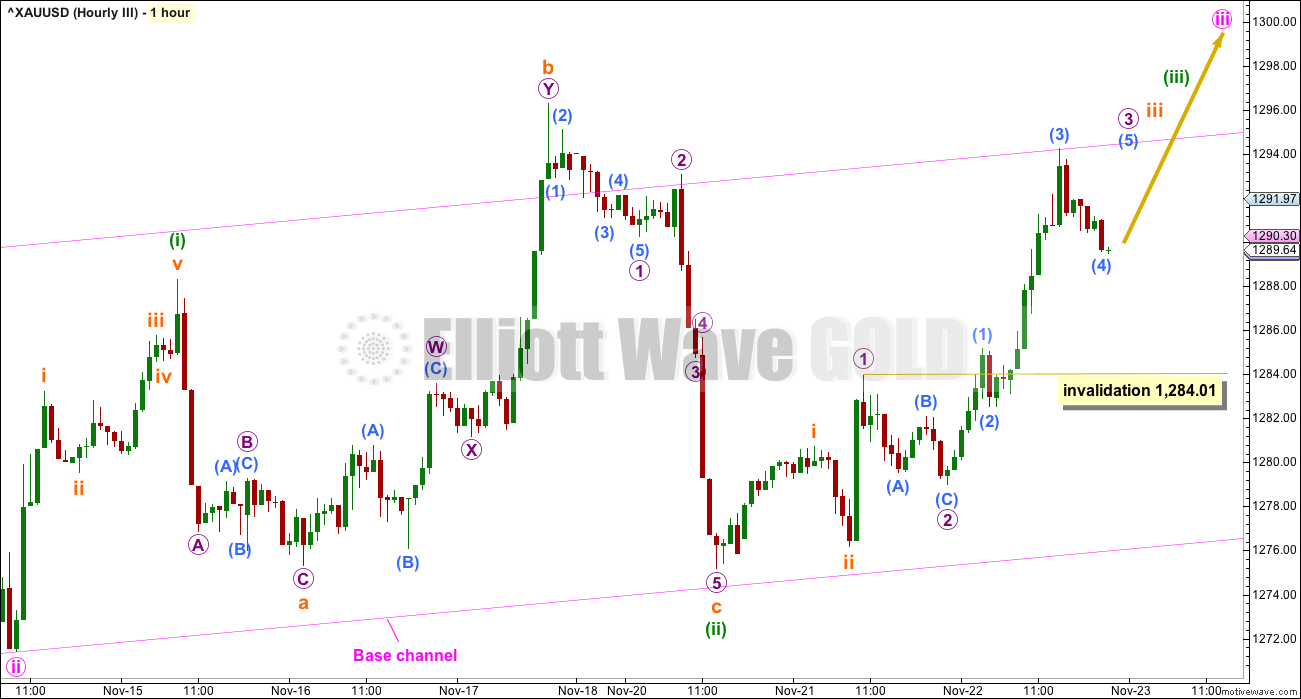
Click chart to enlarge.
If intermediate wave (B) is unfolding as a flat correction, then minor wave C upwards must subdivide as a five wave structure. It may be either an impulse or an ending diagonal.
The middle of the third wave may have passed today. The fifth wave to end minor wave C may be a swift and strong extension.
When micro wave 3 is complete, then micro wave 4 may not move into micro wave 1 price territory below 1,284.01.
TECHNICAL ANALYSIS
WEEKLY CHART
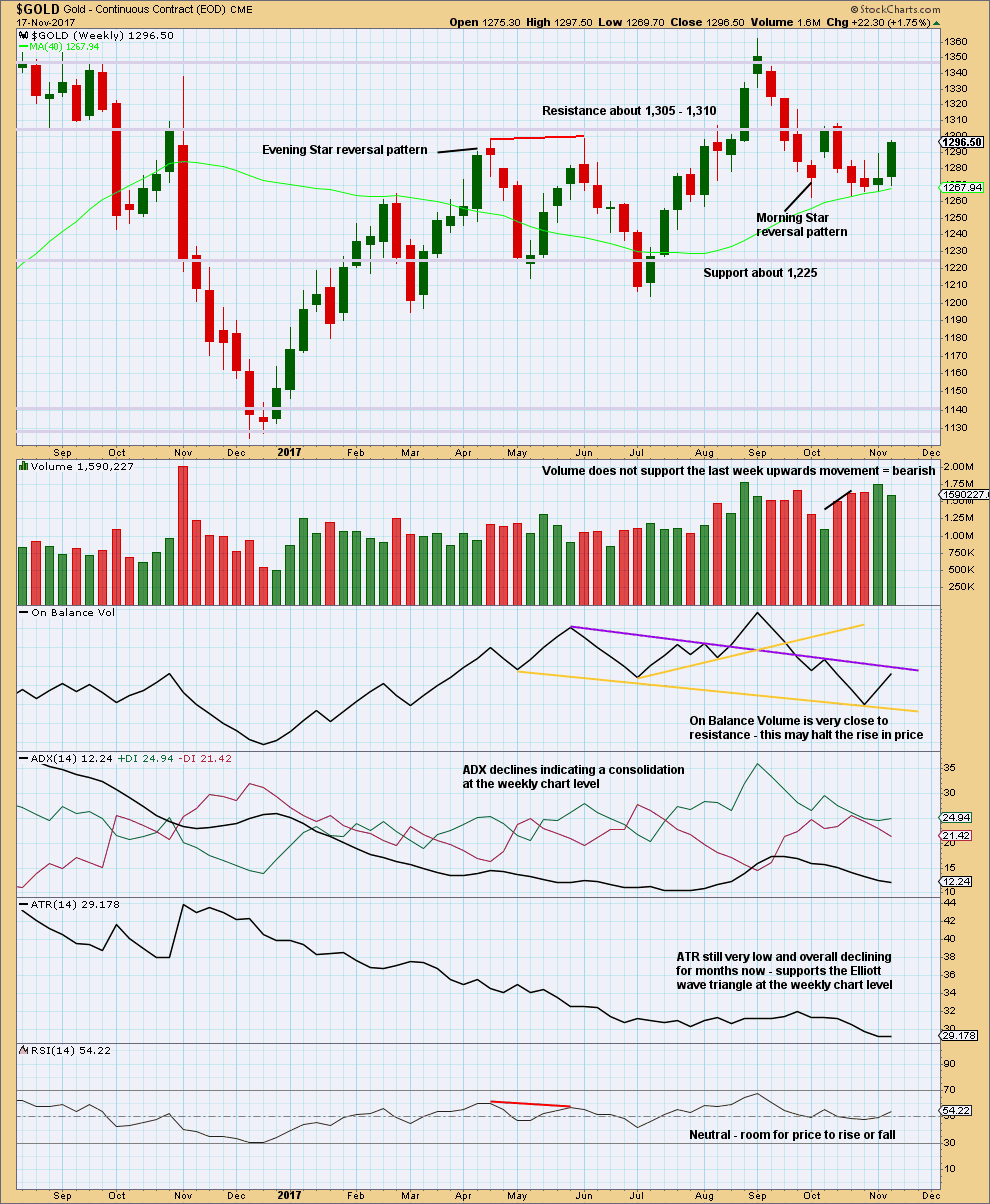
Click chart to enlarge. Chart courtesy of StockCharts.com.
All commentary this week is on the chart.
On Balance Volume at the weekly chart level favours the second wave count.
DAILY CHART
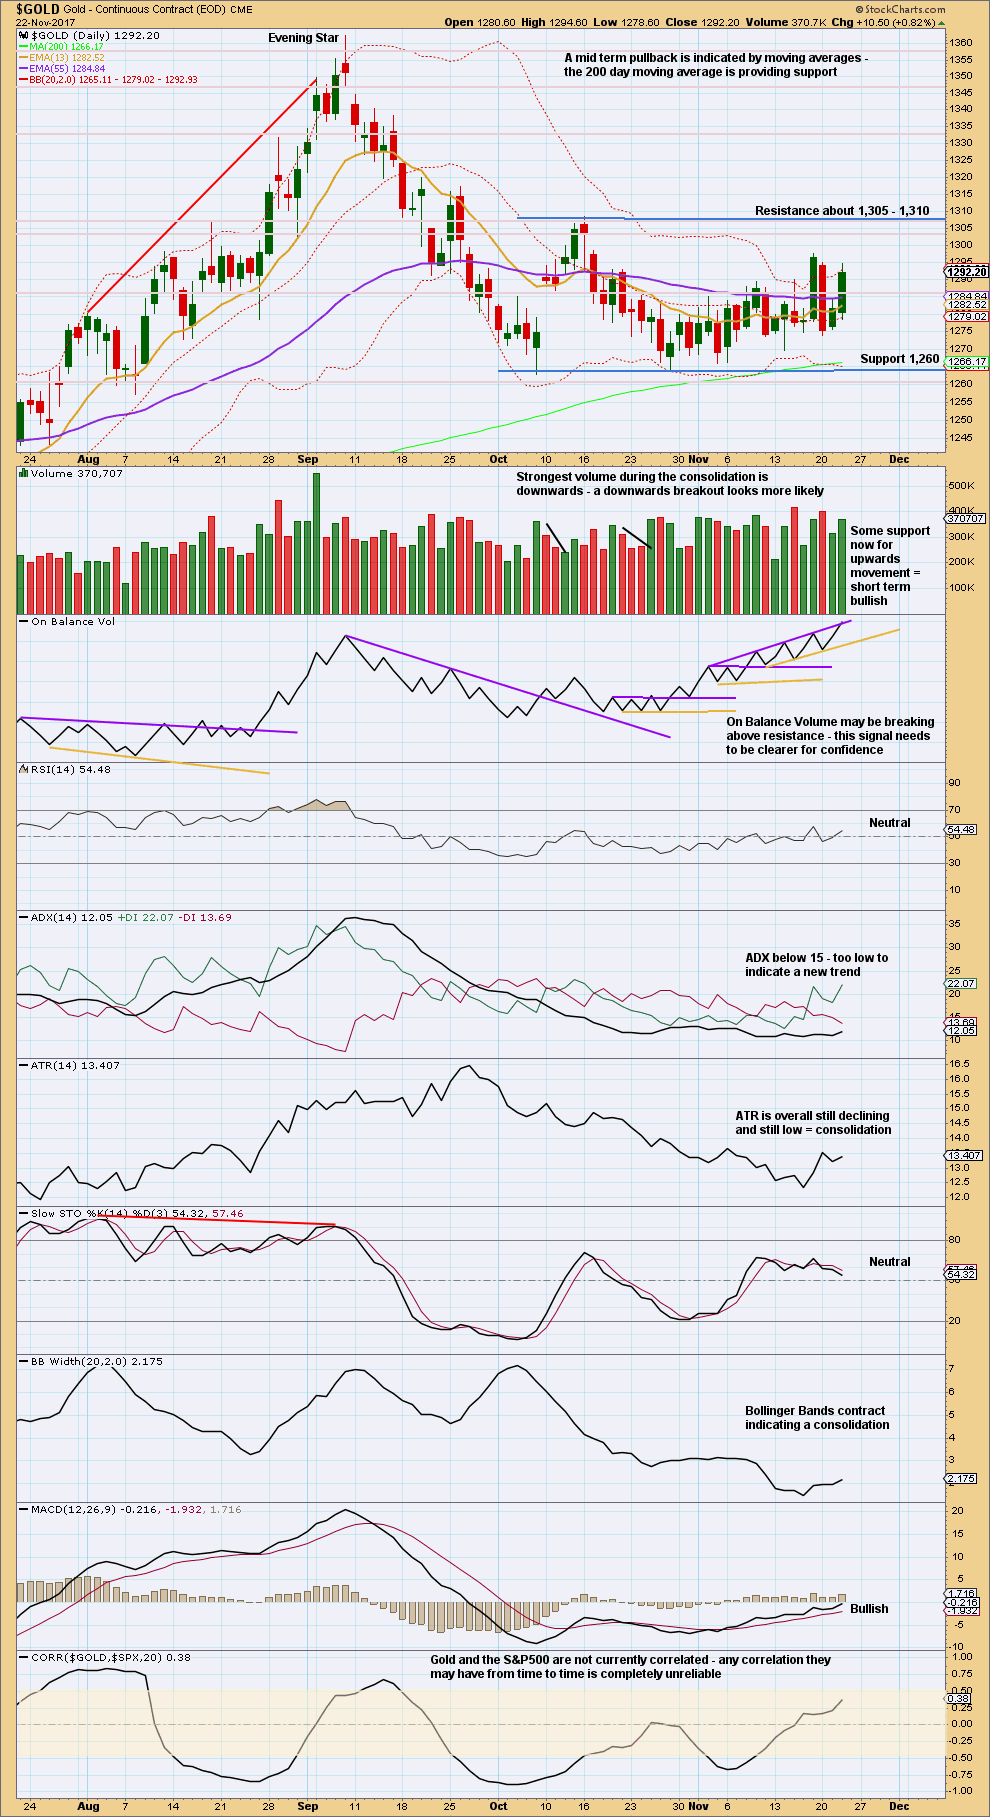
Click chart to enlarge. Chart courtesy of StockCharts.com.
ADX, ATR and contracted Bollinger Bands all agree that this market is consolidating. A breakout will come, and volume suggests it may more likely be down than up. This agrees with the second Elliott wave count.
On Balance Volume may be giving a bullish signal and volume today is slightly bullish. This puts the second wave count in a little doubt today.
GDX DAILY CHART
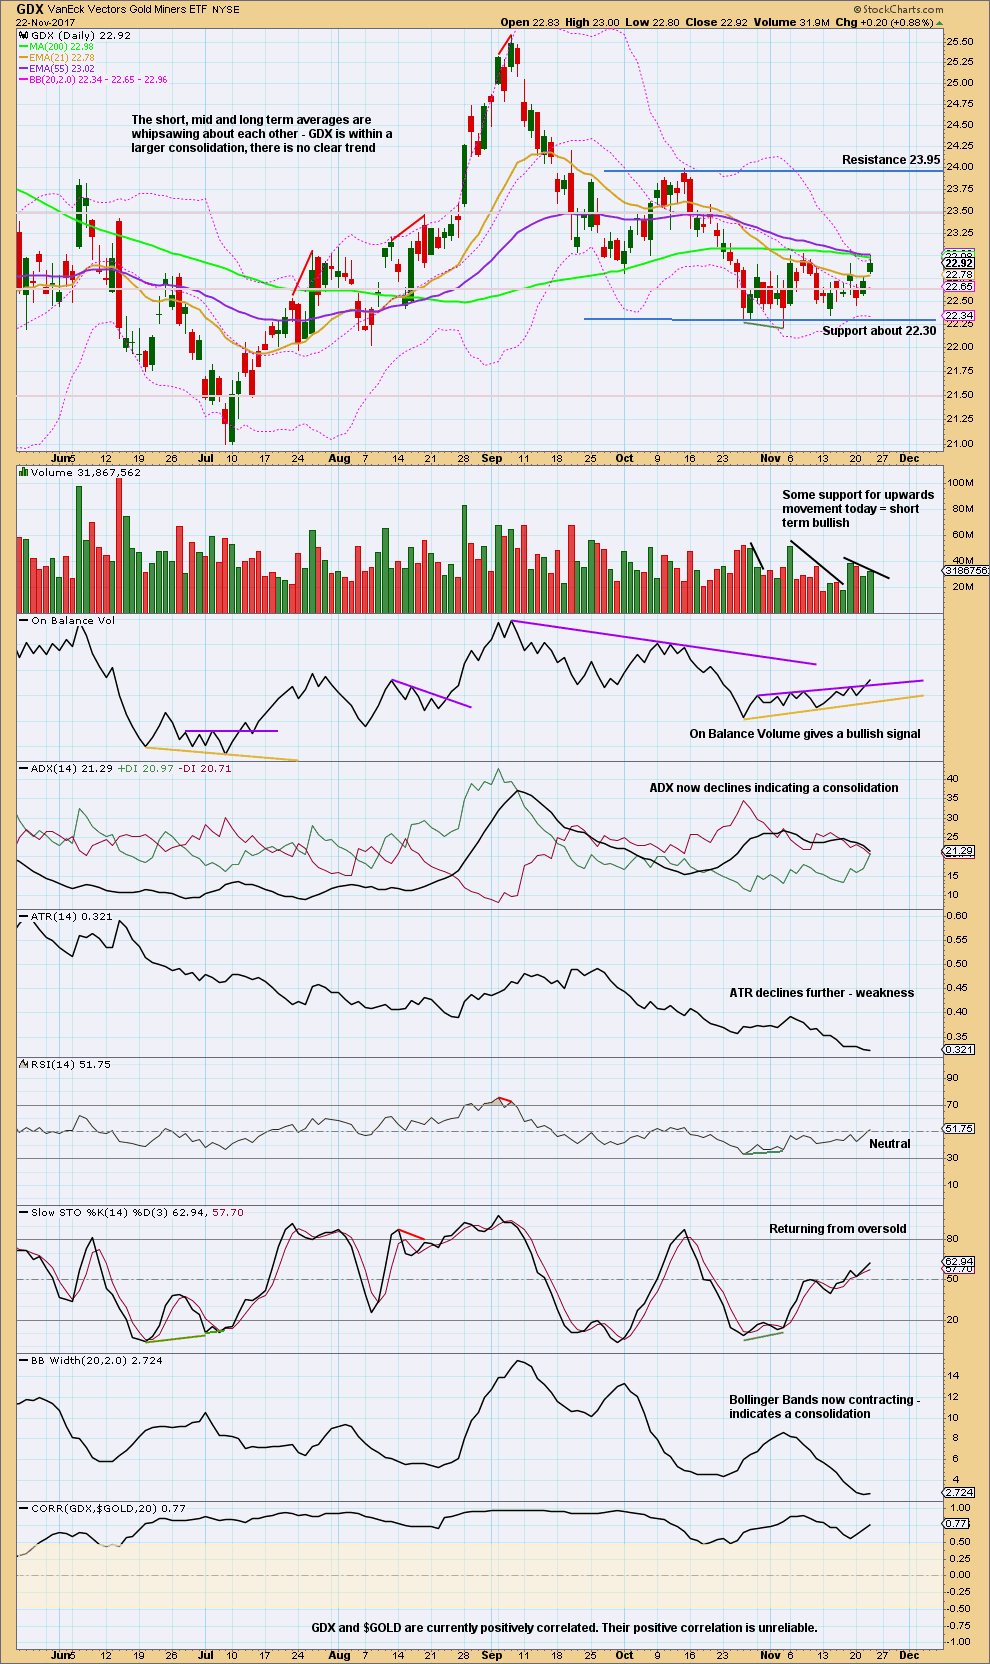
Click chart to enlarge. Chart courtesy of StockCharts.com.
An upwards swing may be expected to continue to resistance about 23.95.
Price does not move in straight lines within consolidations, making them poor trading opportunities. If trading this upwards swing, then reduce risk to only 1-3% of equity to acknowledge higher risk.
Published @ 09:45 p.m. EST.
Second preferred hourly chart updated:
Another test of the A-C trend line coming up?
If this is the correct wave count then that would present another entry point to go short. Or to open the short side of a hedge.
Remember: while this is my preferred wave count for all the reasons I’ve outlined in the analysis above, that does not mean it will turn out that way. I could be wrong. Hedging is one way to manage that possibility.
Always trade with stops. Invest only 1-5% of equity on any one trade.
If new members learn only one thing from me, then let it be that risk management is absolutely vital to success as a trader.
“If new members learn only one thing from me, then let it be that risk management is absolutely vital to success as a trader.” So very true.
Bullish GDXJ count is still on track. Looking for Fri – Mon to be down for a bottom as shown.
https://www.tradingview.com/x/hd17W0hw/
Thank you kindly, Dreamer. Sincerely appreciated.
Dreamer, how do you adjust the font size of wave numbering in TV, please?
The primary, circled, numbering is appropriately small and I cannot seem to be able to do that.
Thanks.
David,
The inability to adjust the font size has bothered me too. I actually requested that as an enhancement over a year ago.
I use windows, and the only way that I can manage it somewhat is by using View and Zoom to manage the overall look of the chart size. A bit frustrating, but workable.
Dreamer,
Thank you very much.
So, its a TV limitation. Ok, I might follow Prechter’s model of using [ ] instead of circled letters. Easy to control font that way.
Thanks again.