
Downwards movement at the end of Friday’s session still remains within the consolidation zone that began back in late September.
Summary: While an upwards swing within a small consolidation zone is still expected as most likely here to about 1,308, it is possible that the lows of the consolidation may be tested once more before price starts to move higher with any conviction. The first target for another test of lows would be about 1,266, but it could be as low as about 1,246 although this looks less likely.
Only the most experienced of traders should be trading the small swings within a consolidation. If trading the small swings, reduce risk to 1-3% of equity for any one trade and always trade with stops.
New updates to this analysis are in bold.
Last monthly charts for the main wave count are here, another monthly alternate is here, and video is here.
Grand SuperCycle analysis is here.
The wave counts will be labelled first and second. Classic technical analysis will be used to determine which wave count looks to be more likely. In terms of Elliott wave structure the second wave count has a better fit and fewer problems.
FIRST ELLIOTT WAVE COUNT
WEEKLY CHART
Click chart to enlarge.
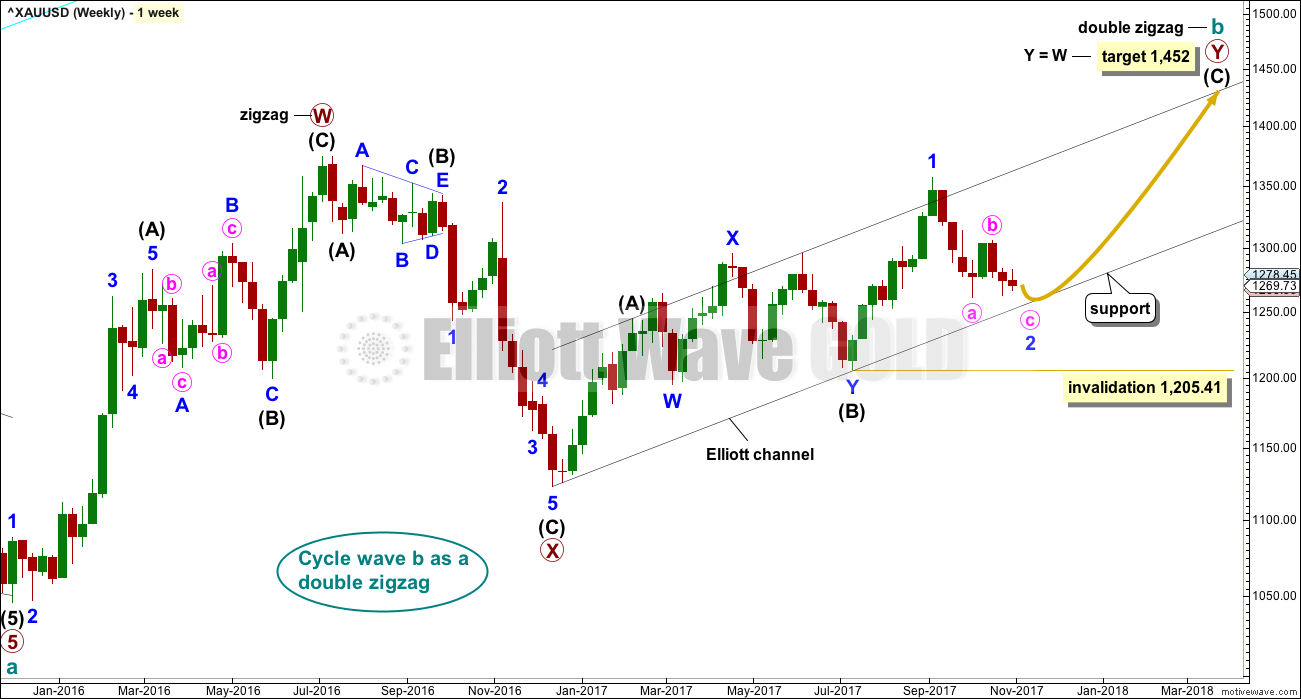
There are more than 23 possible corrective structures that B waves may take, and although cycle wave b still fits well at this stage as a triangle, it may still be another structure. This wave count looks at the possibility that it may be a double zigzag.
If cycle wave b is a double zigzag, then current upwards movement may be part of the second zigzag in the double, labelled primary wave Y.
The target remains the same.
Within intermediate wave (C), no second wave correction may move beyond the start of its first wave below 1,205.41. However, prior to invalidation, this wave count may be discarded if price breaks below the lower edge of the black Elliott channel. If this wave count is correct, then intermediate wave (C) should not break below the Elliott channel which contains the zigzag of primary wave Y upwards.
There are now three problems with this wave count which reduce its probability in terms of Elliott wave:
1. Cycle wave b is a double zigzag, but primary wave X within the double is deep and time consuming. While this is possible, it is much more common for X waves within double zigzags to be brief and shallow.
2. Intermediate wave (B) within the zigzag of primary wave Y is a double flat correction. These are extremely rare, even rarer than running flats. The rarity of this structure must further reduce the probability of this wave count.
3. Although intermediate wave (C) should be continuing so that primary wave Y ends substantially above the end of primary wave W, the duration and depth of minor wave 2 within it now looks to be too large at the weekly time frame.
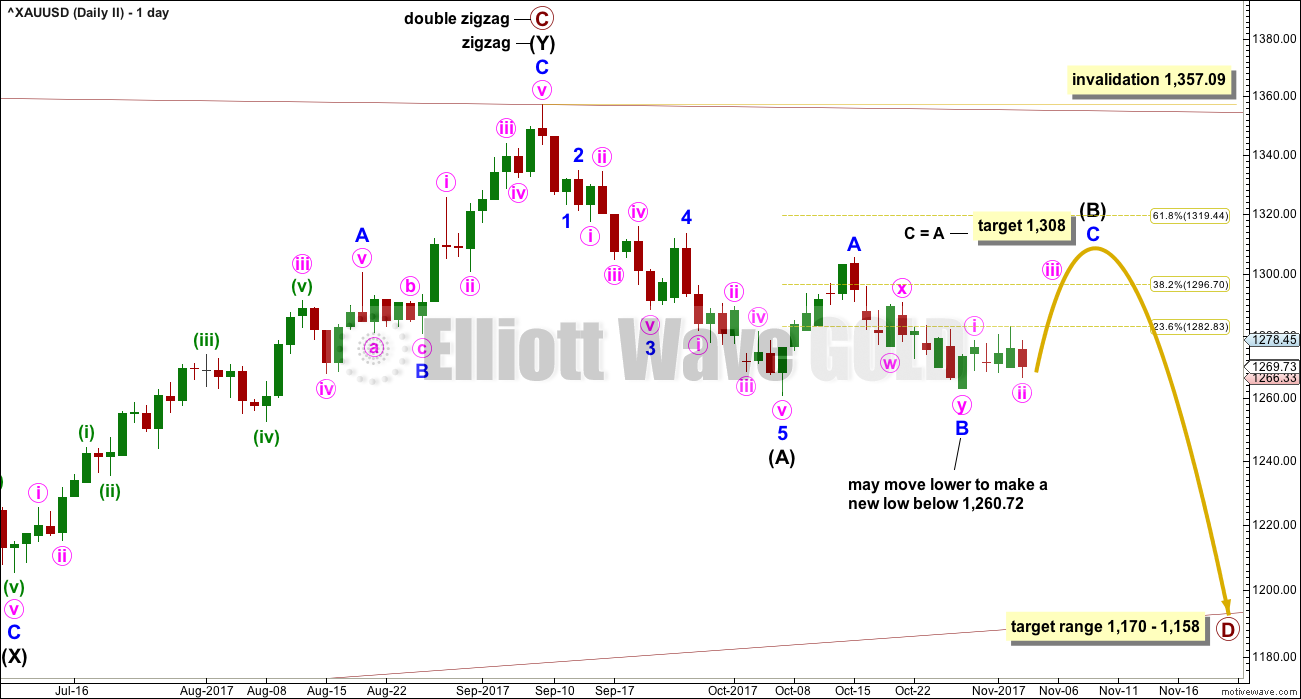
DAILY CHART
Click chart to enlarge.
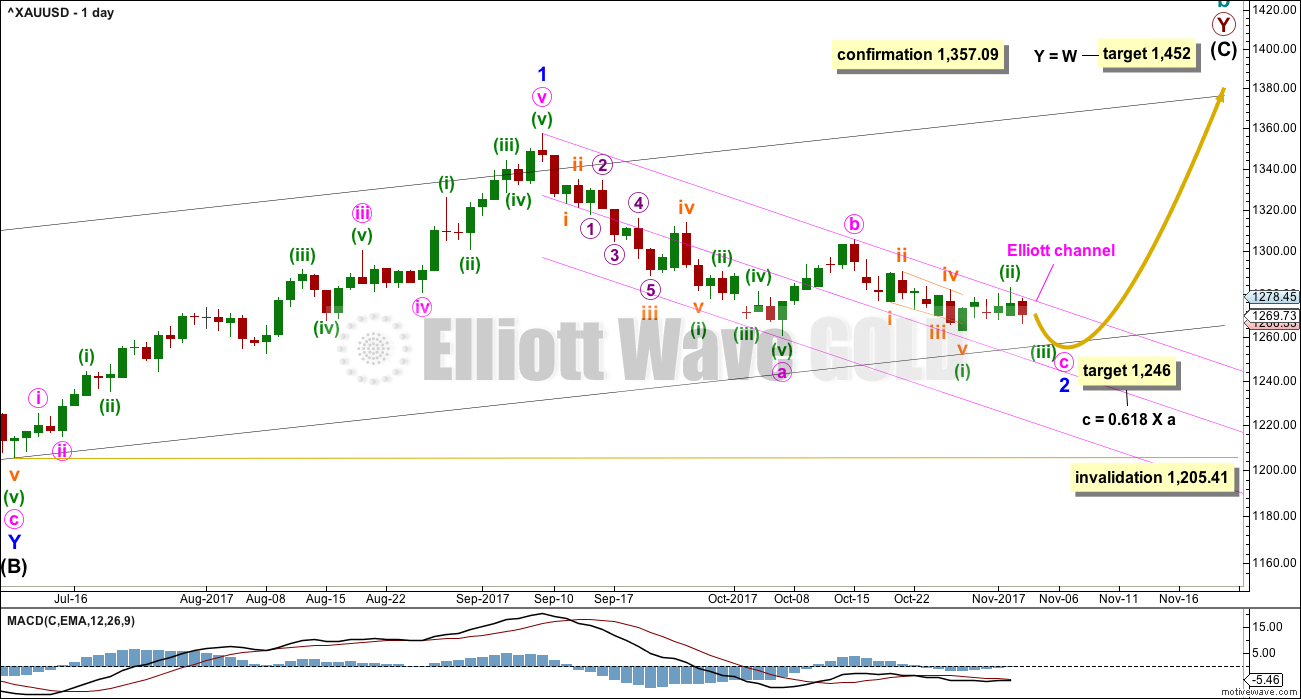
The analysis will focus on the structure of intermediate wave (C). To see details of all the bull movement for this year see daily charts here.
Intermediate wave (C) must be a five wave structure, either an impulse or an ending diagonal. It is unfolding as the more common impulse.
With the invalidation of the short term hourly chart at the end of Friday’s session and recent weakness in upwards movement, the analysis is changed for this first wave count for the short term to see minor wave 2 as not yet over.
Minor wave 2 will subdivide as an incomplete single zigzag. If this wave count is correct, then it should find very strong support about the lower edge of the black Elliott channel, which contains the upwards zigzag of primary wave Y and is copied over here from the weekly chart.
An Elliott channel is drawn about this possible zigzag for minor wave 2 downwards in pink. While price remains within this channel, then it will remain possible that minor wave 2 is incomplete. When price breaks above the upper edge of this channel, then it would signal an end to minor wave 2 and the start of minor wave 3 upwards.
Minor wave 2 may not move beyond the start of minor wave 1 below 1,205.41.
The subdivisions of minor wave 2 zigzag are shown on the daily chart. They have been checked on the hourly chart and will all fit.
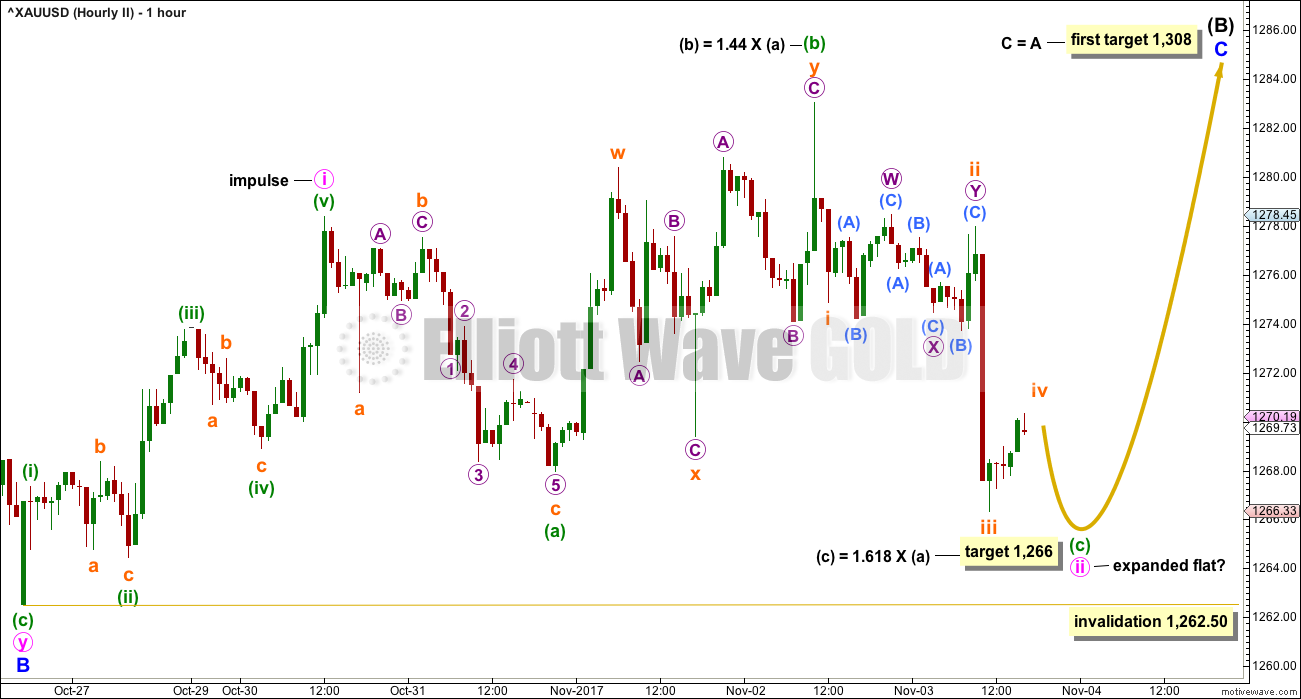
HOURLY CHART
Click chart to enlarge.
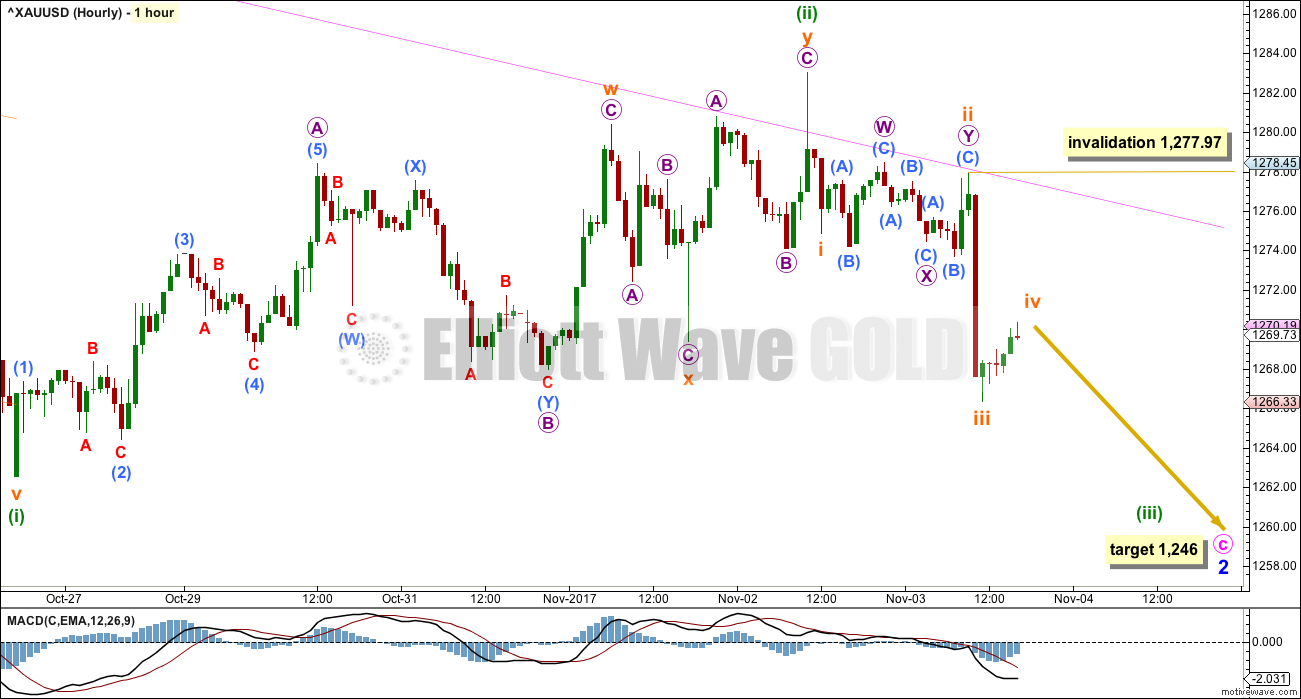
Within the zigzag of minor wave 2, minute wave c must complete as a five wave structure. It may be a simple impulse.
Within the impulse, minuette wave (iii) must move beyond the end of minuette wave (i). The following correction for minuette wave (iv) must unfold and remain below minuette wave (i) price territory. This wave count expects a few more days of slowing downwards movement.
Minor wave 1 lasted 44 days. So far minor wave 2 has lasted 40 days. It may continue for another 4 if it is to be even in duration with minor wave 1.
SECOND ELLIOTT WAVE COUNT
WEEKLY CHART
Click chart to enlarge.
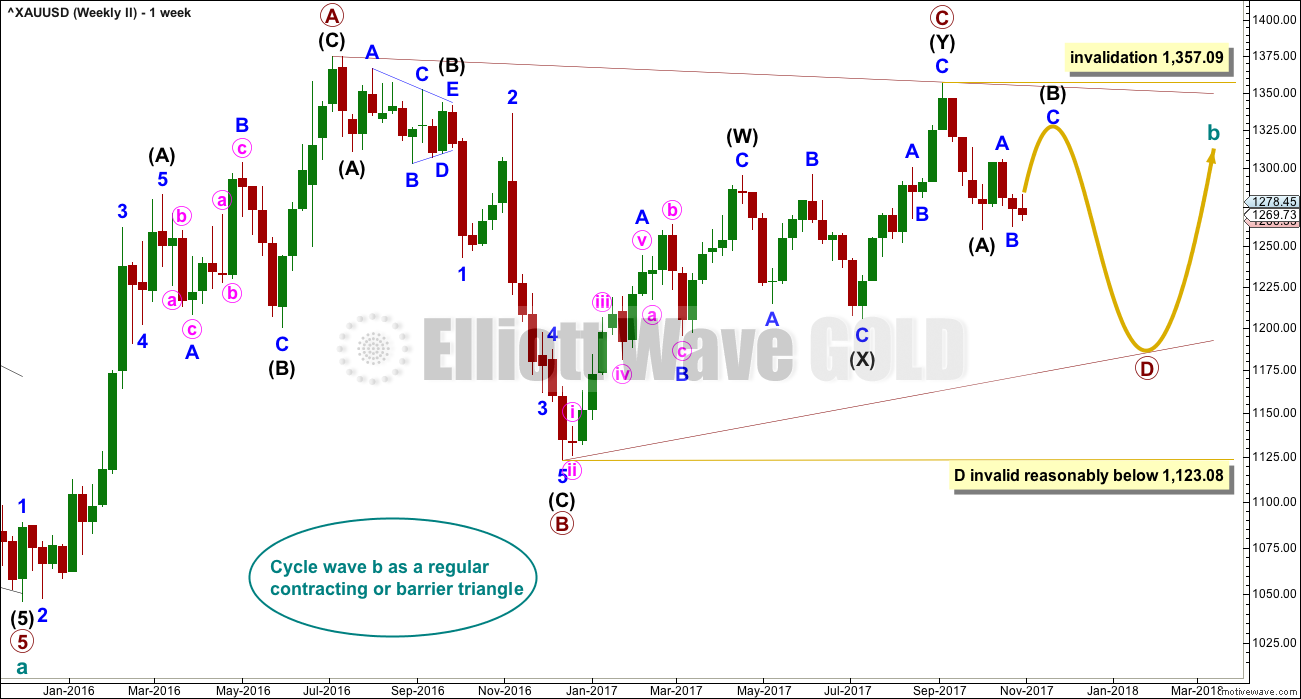
It is still possible that cycle wave b is unfolding as a regular contracting or barrier triangle.
Within a triangle, one sub-wave should be a more complicated multiple, which may be primary wave C. This is the most common sub-wave of the triangle to subdivide into a multiple.
Intermediate wave (Y) now looks like a complete zigzag at the weekly chart level.
Primary wave D of a contracting triangle may not move beyond the end of primary wave B below 1,123.08. Contracting triangles are the most common variety.
Primary wave D of a barrier triangle should end about the same level as primary wave B at 1,123.08, so that the B-D trend line remains essentially flat. This involves some subjectivity; price may move slightly below 1,123.08 and the triangle wave count may remain valid. This is the only Elliott wave rule which is not black and white.
Finally, primary wave E of a contracting or barrier triangle may not move beyond the end of primary wave C above 1,295.65. Primary wave E would most likely fall short of the A-C trend line. But if it does not end there, then it can slightly overshoot that trend line.
Primary wave A lasted 31 weeks, primary wave B lasted 23 weeks, and primary wave C lasted 38 weeks.
The A-C trend line now has too weak a slope. At this stage, this is now a problem for this wave count, the upper A-C trend line no longer has such a typical look.
Within primary wave D, no part of the zigzag may move beyond its start above 1,357.09.
DAILY CHART
Click chart to enlarge.
The idea of a zigzag continuing lower for minor wave B will work in exactly the same way for this second wave count as it does for the first, as per labelling on the first daily chart. This second wave count will continue to look at the possibility that minor wave B was over and minor wave C is now beginning.
At this stage intermediate wave (B) looks incomplete.
A common length for triangle sub-waves is from 0.8 to 0.85 the length of the prior wave. Primary wave D would reach this range from 1,170 to 1,158.
If primary wave C is correctly labelled as a double zigzag, then primary wave D must be a single zigzag.
Within the single zigzag of primary wave D, intermediate wave (A) is labelled as a complete impulse.
Intermediate wave (A) lasted twenty days, just one short of a Fibonacci twenty-one. Intermediate wave (B) may be about the same duration, so that this wave count has good proportions, or it may be longer because B waves tend to be more complicated and time consuming.
So far intermediate wave (B) has lasted twenty sessions, it is incomplete and needs several more sessions now to complete. The next Fibonacci ratio in the sequence is thirty four.
At its conclusion intermediate wave (B) should have an obvious three wave look to it here on the daily chart. While it is labelled as a flat correction, it may also complete as a combination or triangle. Labelling for this second wave count within intermediate wave (B) may change here on the daily chart and at the hourly chart level as the structure continues and becomes clearer.
HOURLY CHART
Click chart to enlarge.
Intermediate wave (B) may be a regular flat correction. It may also be a combination or triangle, so labelling within this structure for this wave count my still change in coming days.
Within intermediate wave (B), minor wave B has passed the minimum requirement of 0.90 the length of minor wave A. B waves within 0.90 to 1.05 the length of A waves indicate a regular flat correction. The most common length for C waves within regular flats is equality in length with the A wave.
Minor wave C would be extremely likely to make at least a slight new high above the end of minor wave A at 1,305.72 to avoid a truncation if intermediate wave (B) is a flat correction. If intermediate wave (B) is a triangle, then minor wave C may not move beyond the end of minor wave A above 1,305.72 (it must end before this point).
Both wave counts require a five wave structure upwards to complete. For this second wave count it would be labelled minor wave C.
So far, within minor wave C, after Friday’s invalidation of the short term labelling downwards movement may be a continuation of minute wave ii as an expanded flat correction. Minute wave ii may not move beyond the start of minuette wave i below 1,262.50.
TECHNICAL ANALYSIS
WEEKLY CHART
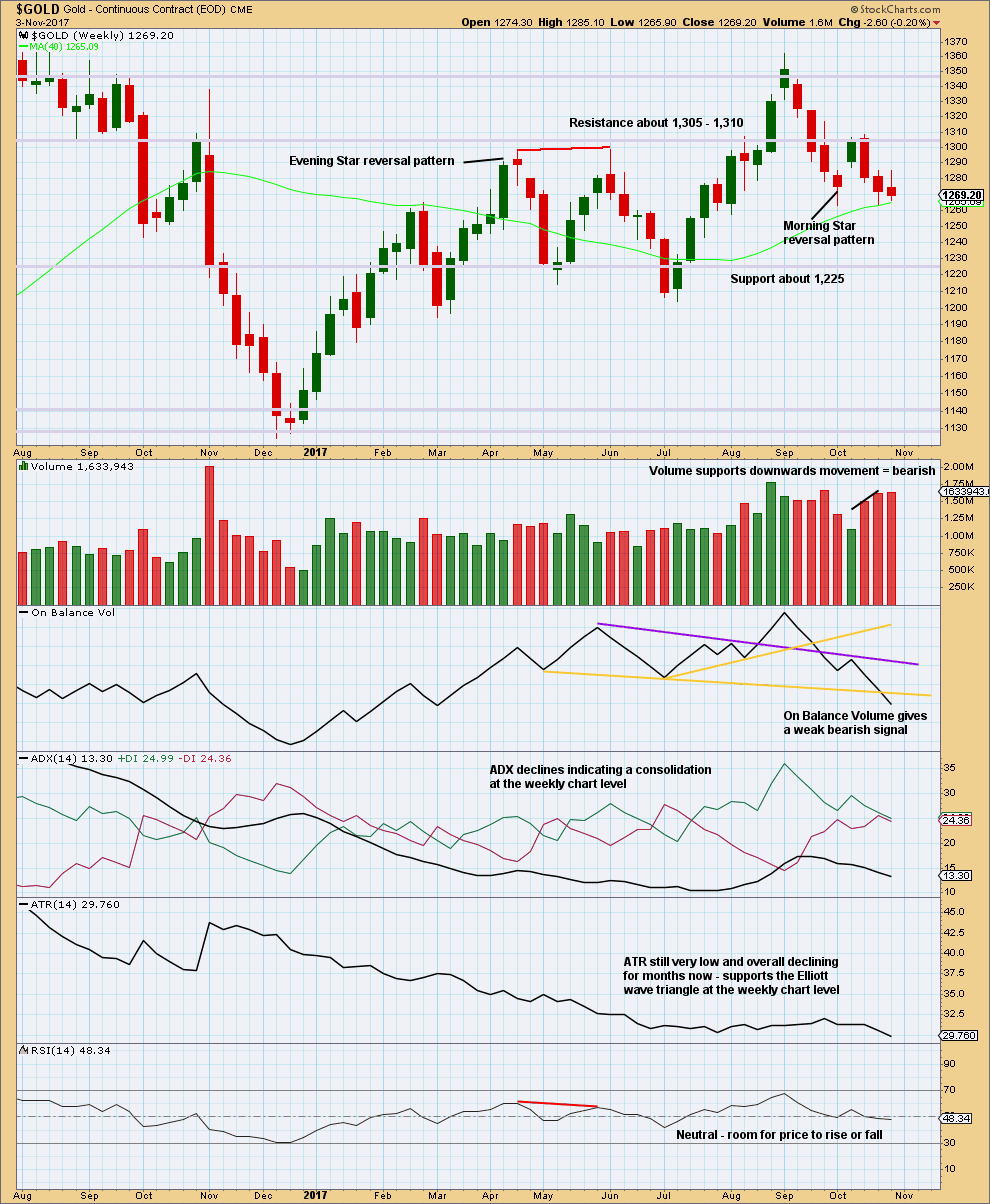
Click chart to enlarge. Chart courtesy of StockCharts.com.
Although price made a higher high and higher low this week, the definition of upwards movement, the candlestick has closed red and the balance of volume for the week is downwards. Some increase in volume supports downwards movement during the week, so this is interpreted as bearish.
ATR continues to decline, which offers fairly strong support to the second Elliott wave count. This is exactly the kind of price behaviour expected from large triangles.
DAILY CHART
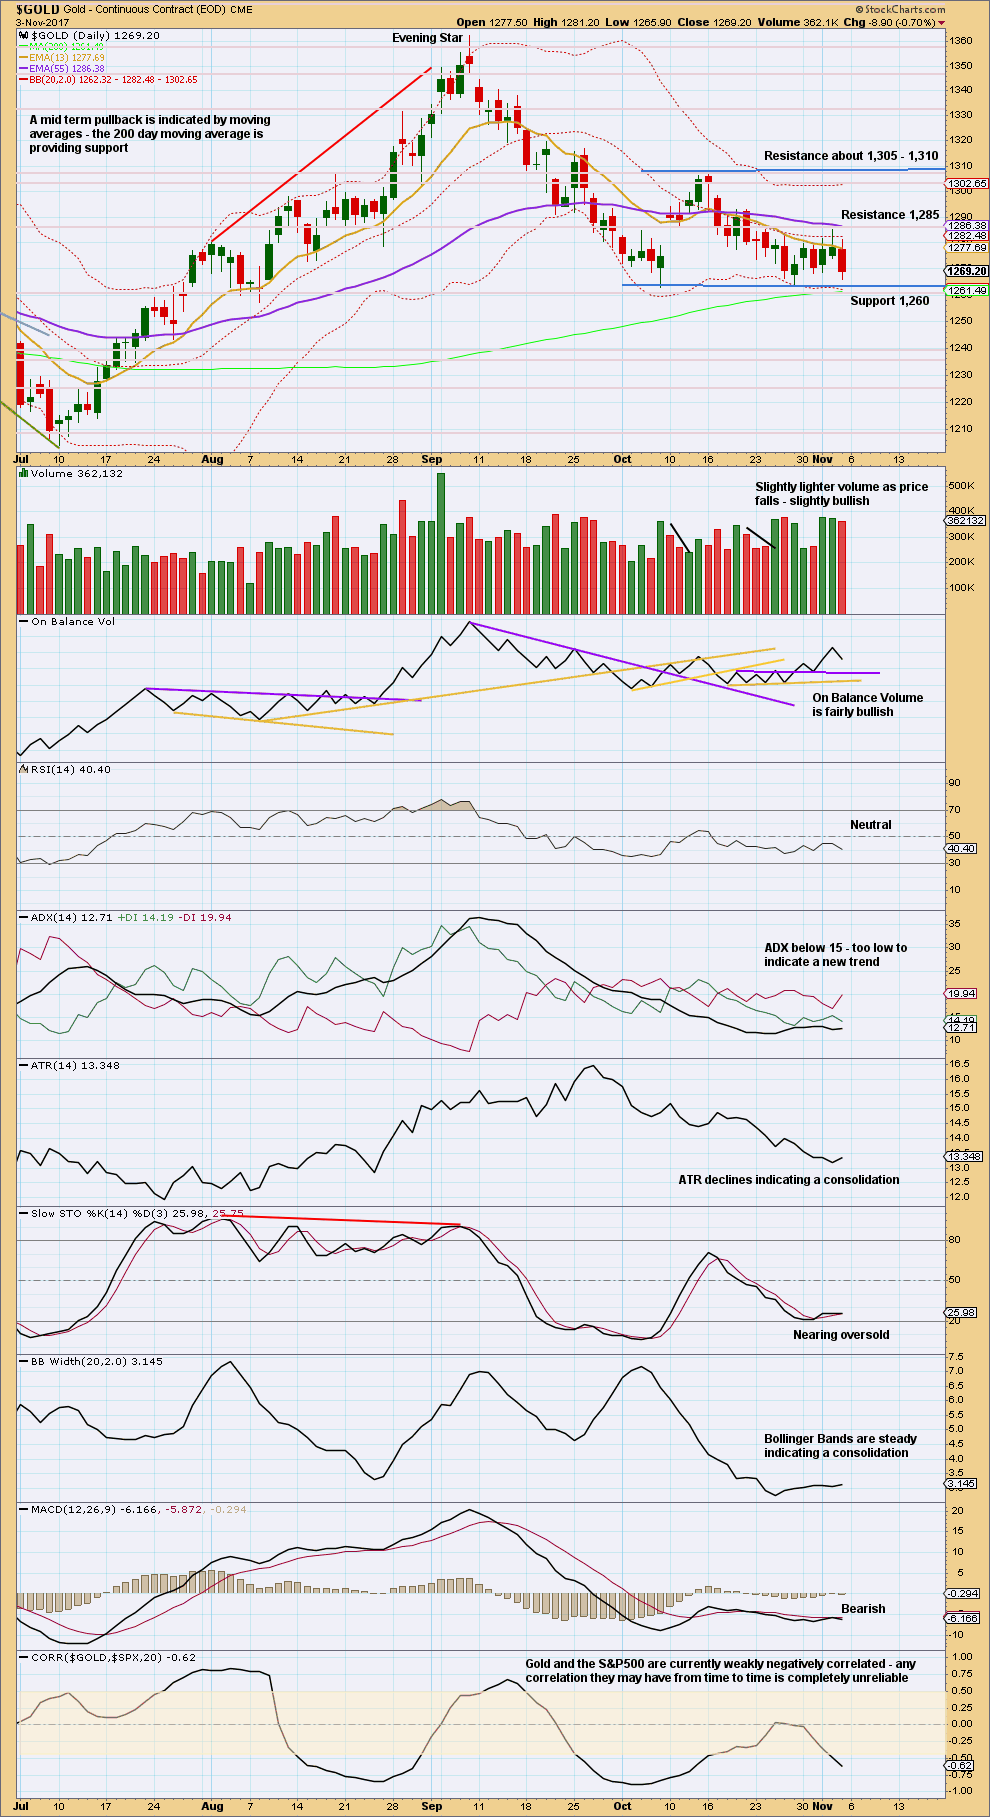
Click chart to enlarge. Chart courtesy of StockCharts.com.
Price is very clearly consolidating. Expect swings from support to resistance and back again. Use Stochastics in conjunction with support and resistance to signal when each swing ends. Be aware that trading a consolidating market is much more risky than trading a trending market, and reduce risk accordingly. Only experienced traders should consider trading the swings within a consolidation. Reduce risk to 1-3% of equity. Always trade with stops. Here, move stops to a little below support and above resistance to allow for overshoots; give the market room to move.
With Stochastics very close to oversold and price at support, an upwards swing may begin here or very soon. Look for resistance about 1,305 – 1,310. This also supports the second Elliott wave count.
For the very short term, downwards movement during Friday’s session does not have good support from volume although volume did remain reasonably heavy (compared to the last few sessions). For the short term, support may again be tested here about 1,260 before the expected upwards swing begins more clearly.
GDX DAILY CHART
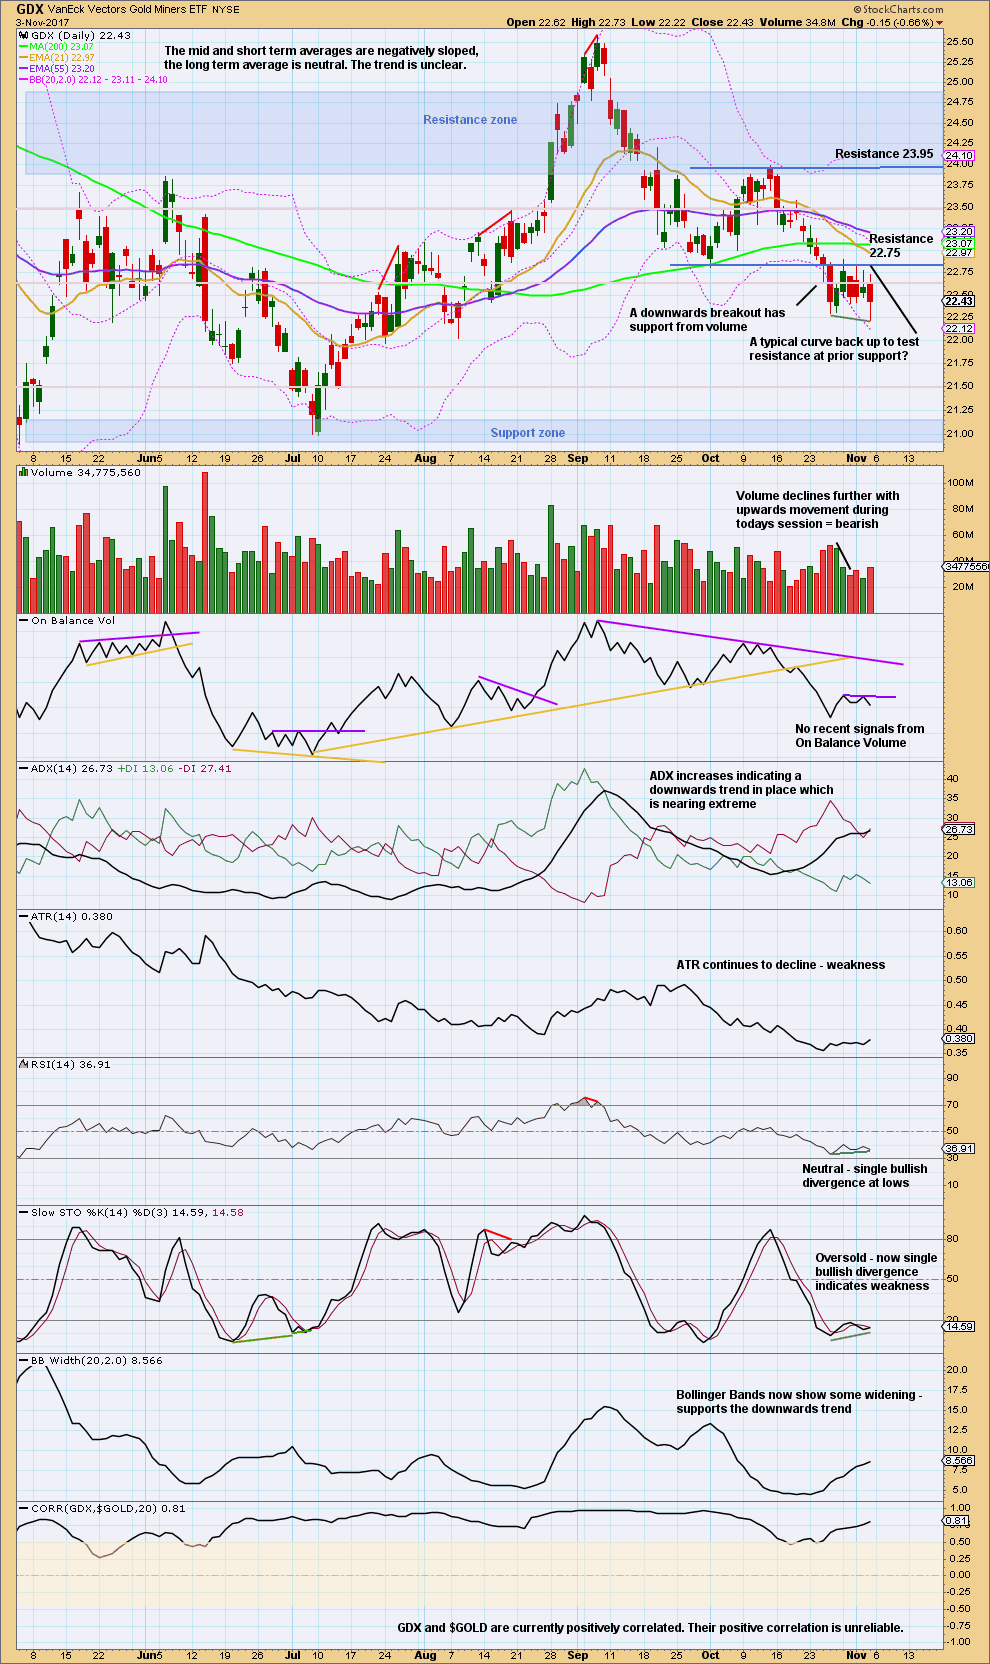
Click chart to enlarge. Chart courtesy of StockCharts.com.
With a new low on Friday from price, GDX is now exhibiting some weakness in this downwards movement.
Because Stochastics is oversold and now exhibits weakness, look out for a bounce back upwards from here. If that happens, then the consolidation zone for GDX may have to be widened to include this recent break below support.
Published @ 10:21 p.m. EST.
Yes Gold and silver going higher.
GSR is about to break down from 4 hour top HnS. It is trading at NL.
Watching both EW counts and GSR top Hns for some time.
Target 1,300 in a few days.
The target wasn’t met, the new low was only by just a very little. Which is enough for a fifth wave to avoid a truncation and for the whole structure to be complete.
This works.
And this also works
I thought GDX would print one more nominal low today, but it’s starting to look like the bottom may have been Friday… powerful move up so far today. Let’s see how it closes and what the volume is.
I think the VIX is going to bottom sometime in November, then have a nice spike up. Likely higher than the last spike, but this won’t be “the big one” yet.
https://www.tradingview.com/x/LSJal7vW/
Yes indeed dreamer. I agree we should see a final new low. I know a big move js coming not only because of the unprecedented level of narket complacency and the massive current short vol trade, but also because I now sometines get laughed at for pointing it out. That is one massive falling wedge! 😉
The last several weeks going long below ten and scalping the pops above has worked quite well with carefully selected options. I have also been accumulating a June 2018 position in anticipation of the great unwind. Absolutely stunning that so few are paying any attention to this and its inevitable outcome. Talk about a one-way bet!!! lol!
Too easy. Like taking candy from a baby Verne? 🙂
Yeah, that does look like it’s pretty consistent ATM.
I probably should keep quiet about that huh? 🙂
For some reason I have not yet determined, every Friday for the last seven, we have seen a herculean effort to drive price below ten. It has been happening like clockwork. I suspect it is gigantic positions being rolled forward to try and keep them from week-end implosion. The first Friday they fail to engineer a sub-ten close could be interesting. Until then I for one will not be looking a gift horse…. 😉
Lara, I’m thinking that Gold dips on Monday then starts to reverse up, kind of like your 2nd count hourly.
But I’m still liking the first count at this point. Wouldn’t a DZZ for the first count work for Minor wave 2? I think you stated in the prior day comments that a DZZ would not work?
Would it work as shown?
Many thanks,
https://www.tradingview.com/x/MYy1IdNe/
Yes, that works. Good job Dreamer.
Whether it be a single or double ZZ the idea is now the same. Both should see a new low below 1,260.72; a double ZZ so that Y moves below W and achieves its purpose, and a single ZZ so that C moves below A and avoids a truncation.
So yes, we could see a short sharp thrust down to take out stops of early longs, right before price reverses and moves strongly up.
It does now look like that “shake the trees” move came with that 30K contract dump last Friday morning…we should have guessed… 🙂
Looks like the 30K contracts dumped on Friday saw some dip buying. Someone made a naked short side bet of almost 4B!! I wonder why?! 🙂