
Price continues to rise towards the target zone as expected. The target remains the same.
This week’s classic analysis is used to judge whether or not recent movement could be over.
Summary: The target for upwards movement to end is a zone at 61.42 to 62.11. There is some weakness now and indicators are extreme; look out for this upwards trend to end soon.
New updates to this analysis are in bold.
MONTHLY ELLIOTT WAVE COUNT
Click chart to enlarge.
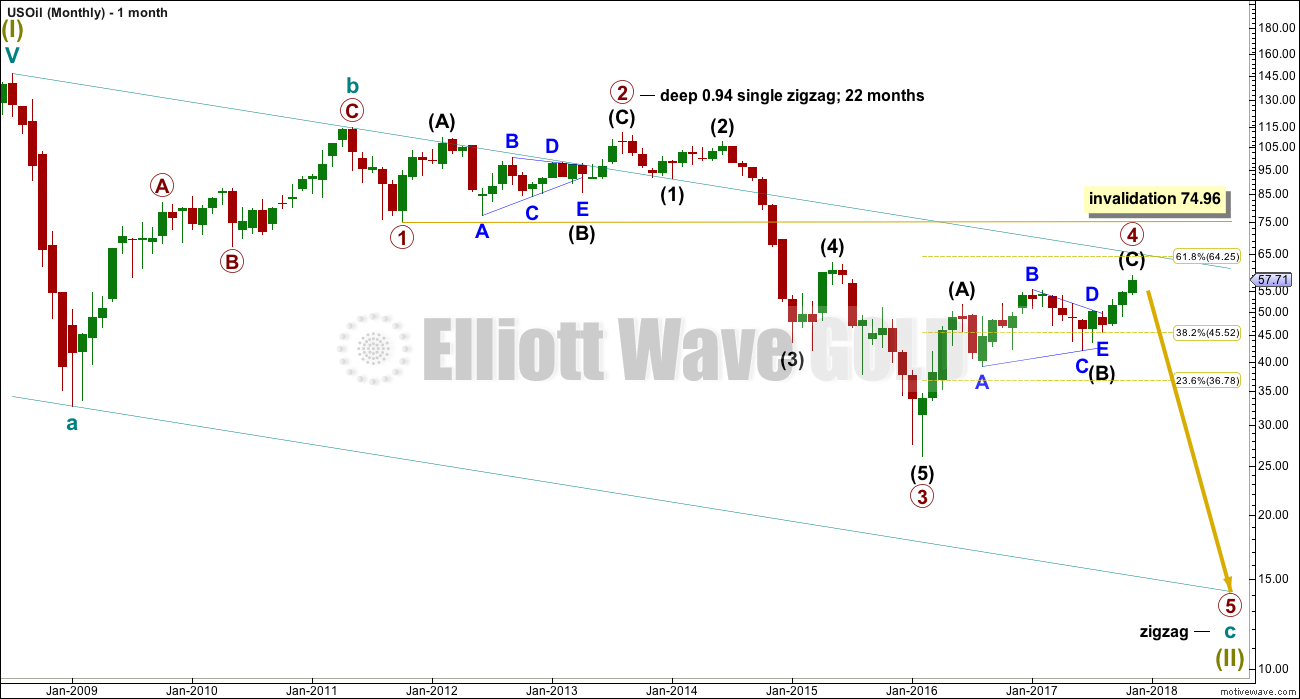
Within the bear market, cycle wave b is seen as ending in May 2011. Thereafter, a five wave structure downwards for cycle wave c begins.
Primary wave 1 is a short impulse lasting five months. Primary wave 2 is a very deep 0.94 zigzag lasting 22 months. Primary wave 3 is a complete impulse with no Fibonacci ratio to primary wave 1. It lasted 30 months.
There is alternation in depth with primary wave 2 very deep and primary wave 4 relatively shallow. There is inadequate alternation in structure, both are zigzags. So far primary wave 4 has lasted 21 months. So far there is good proportion between primary waves 2 and 4.
Primary wave 4 may not move into primary wave 1 price territory above 74.96.
WEEKLY ELLIOTT WAVE COUNT
Click chart to enlarge.
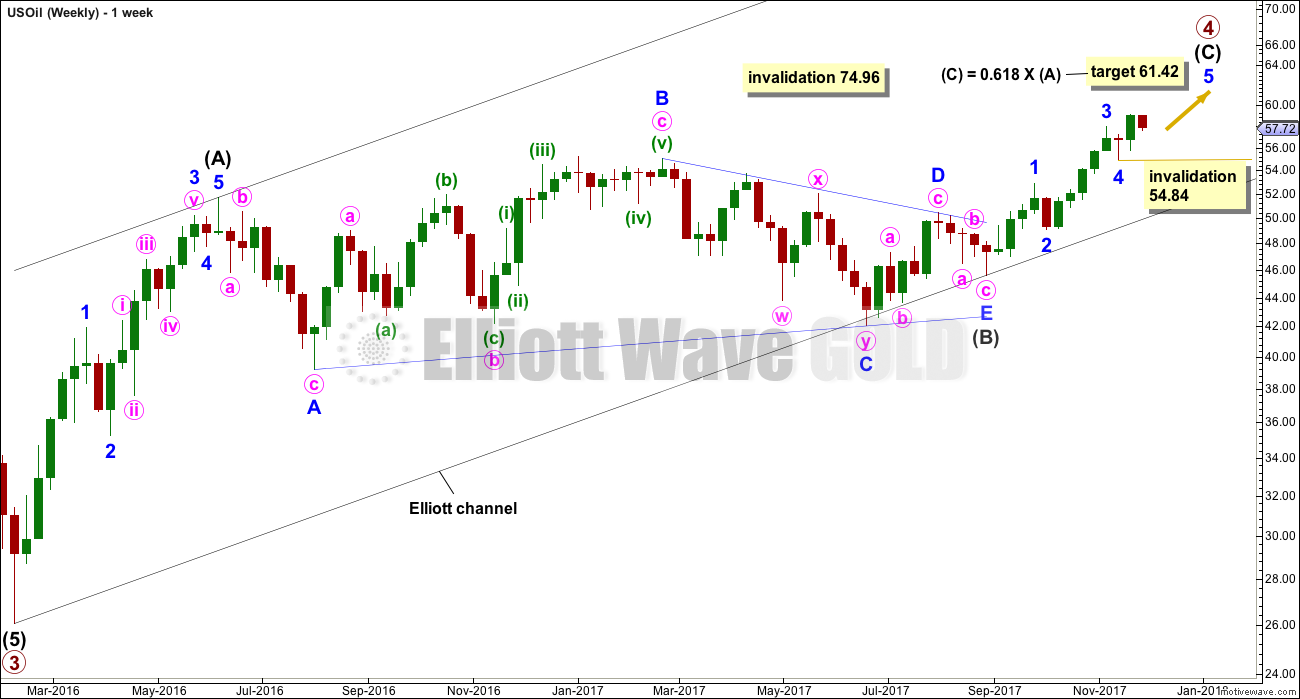
Intermediate wave (C) must subdivide as a five wave structure, either an impulse or an ending diagonal. Within intermediate wave (C), minor waves 1 through to 4 may be complete. Within minor wave 5, no second wave correction may move beyond the start of its first wave below 54.84.
When intermediate wave (C) may again be seen as complete, then a trend change would be expected and a target for primary wave 5 downwards would be calculated. At this stage, for this wave count, a target cannot be calculated for it to end because the start of primary wave 5 is not known.
An Elliott channel is added to this possible zigzag for primary wave 4. A breach of the lower edge of this channel would provide a very strong indication that primary wave 4 should be over and primary wave 5 should be underway.
DAILY ELLIOTT WAVE COUNT
Click chart to enlarge.
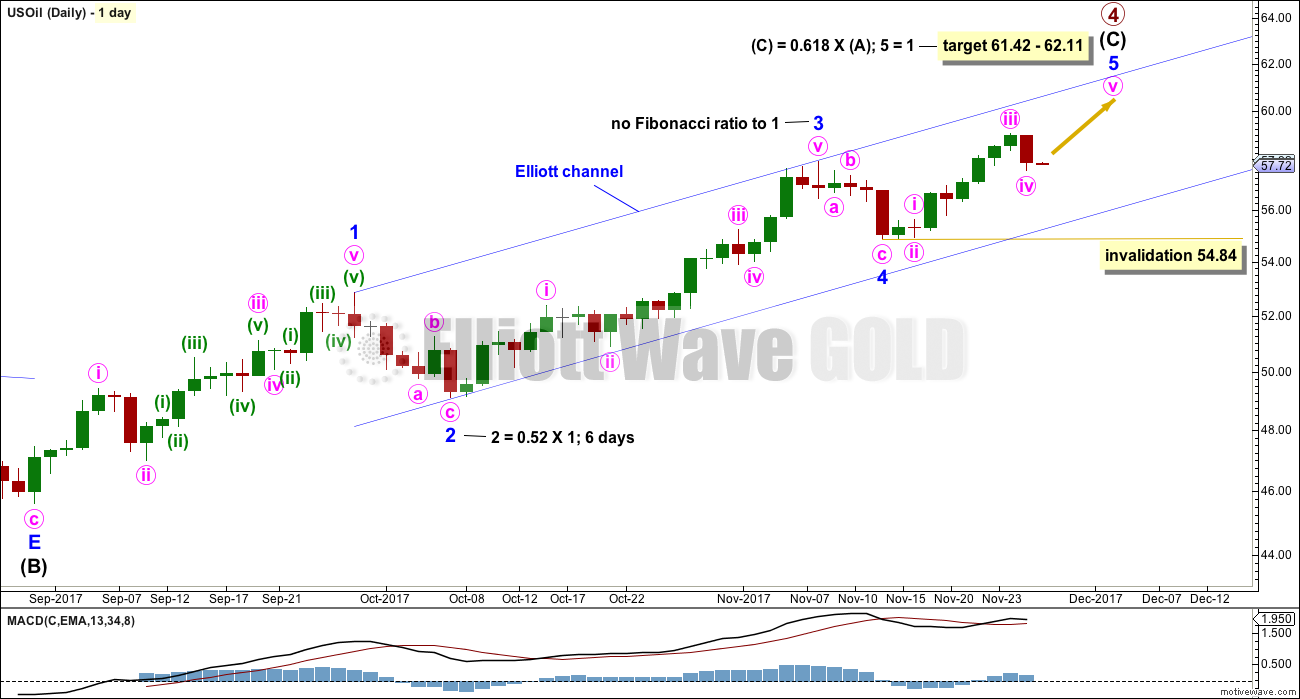
Intermediate wave (C) must complete as a five wave structure. For this wave count, it looks like a possible impulse.
Minor wave 3 is longer than minor wave 1, but it does not exhibit a Fibonacci ratio to minor wave 1. This makes it more likely that minor wave 5 may exhibit a Fibonacci ratio to either of minor waves 3 or 1, and a ratio to minor wave 1 would be more common. The upper edge of the target zone should be favoured as it is calculated at a lower degree.
Both minor waves 2 and 4 are zigzags, so there is inadequate alternation here. There is alternation within the structures though: minor wave 2 has a long minute wave a and a short minute wave c, whereas minor wave 4 has a short minute wave a and a long minute wave c. At this stage, there is alternation in depth: minor wave 2 is deep and minor wave 4 is shallow.
Minor wave 5 may be nearing completion as a five wave impulse as labelled. The degree of labelling within minor wave 5 may also be moved down one degree; it may be only minute wave i which is nearing completion within minor wave 5.
A new low below 54.84 would provide some indication that intermediate wave (C), and primary wave 4, may be over.
TECHNICAL ANALYSIS
DAILY CHART
Click chart to enlarge. Chart courtesy of StockCharts.com.
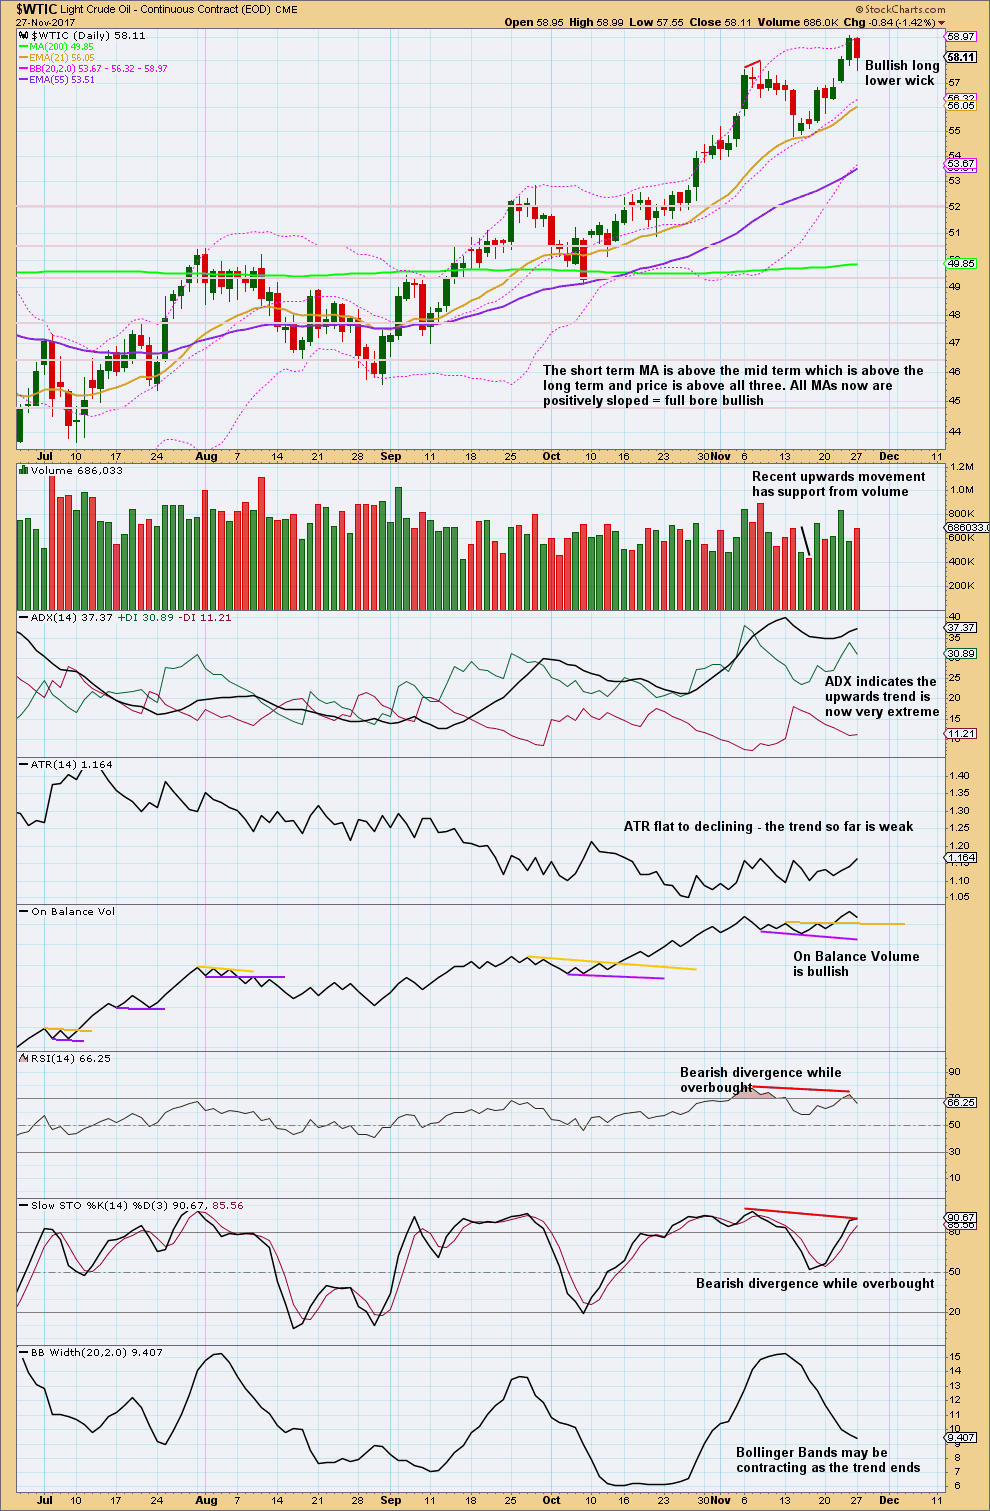
For the very short term, support for downwards movement on the last day from volume suggests a little more downwards movement here. There is more support for recent upwards days still than for downwards days.
ADX, RSI and Stochastics are extreme. With bearish divergence on RSI and Stochastics while overbought, this indicates weakness in price and a possible upcoming end to this upwards trend.
VOLATILITY INDEX
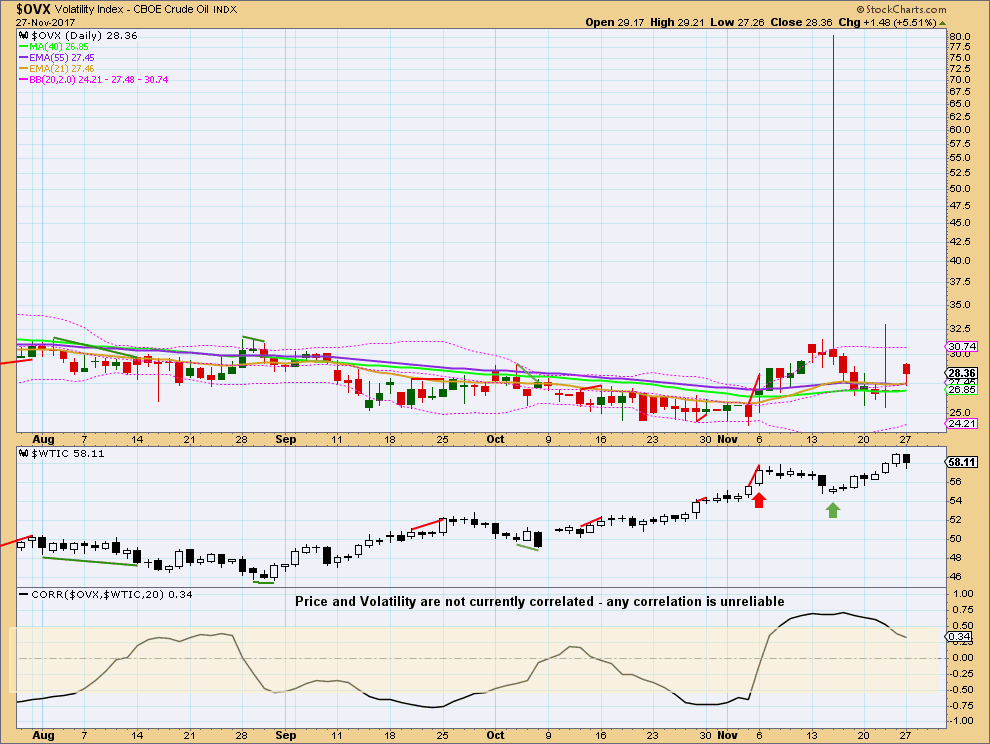
Click chart to enlarge. Chart courtesy of StockCharts.com.
The strange volatility spike for the 15th of November remains. Last week it was interpreted as bullish and this has been now followed by a few days of upwards movement.
At this time no divergence for the very short term is noted between price and volatility.
Published @ 10:10 p.m. EST.
thank you for update
waiting to short this….
You’re welcome 🙂
And yes, me too.