
A bounce is unfolding exactly as expected. The target remains the same and may be met in another day or so.
Summary: A multi day bounce for minor wave 2 has arrived.
The target for minor wave 2 is 1,268, which may be met in another one, three or five days.
Short positions opened on or before 1st of December, and particularly any short positions opened above 1,287.61, may still be held for traders with a longer term horizon.
The trend for now is down. Bounces are opportunities to enter the trend. All trades should remain with the trend.
Always trade with stops and invest only 1-5% of equity on any one trade.
New updates to this analysis are in bold.
Last monthly charts for the main wave count are here, another monthly alternate is here, and video is here.
Grand SuperCycle analysis is here.
MAIN ELLIOTT WAVE COUNT
WEEKLY CHART
Click chart to enlarge.
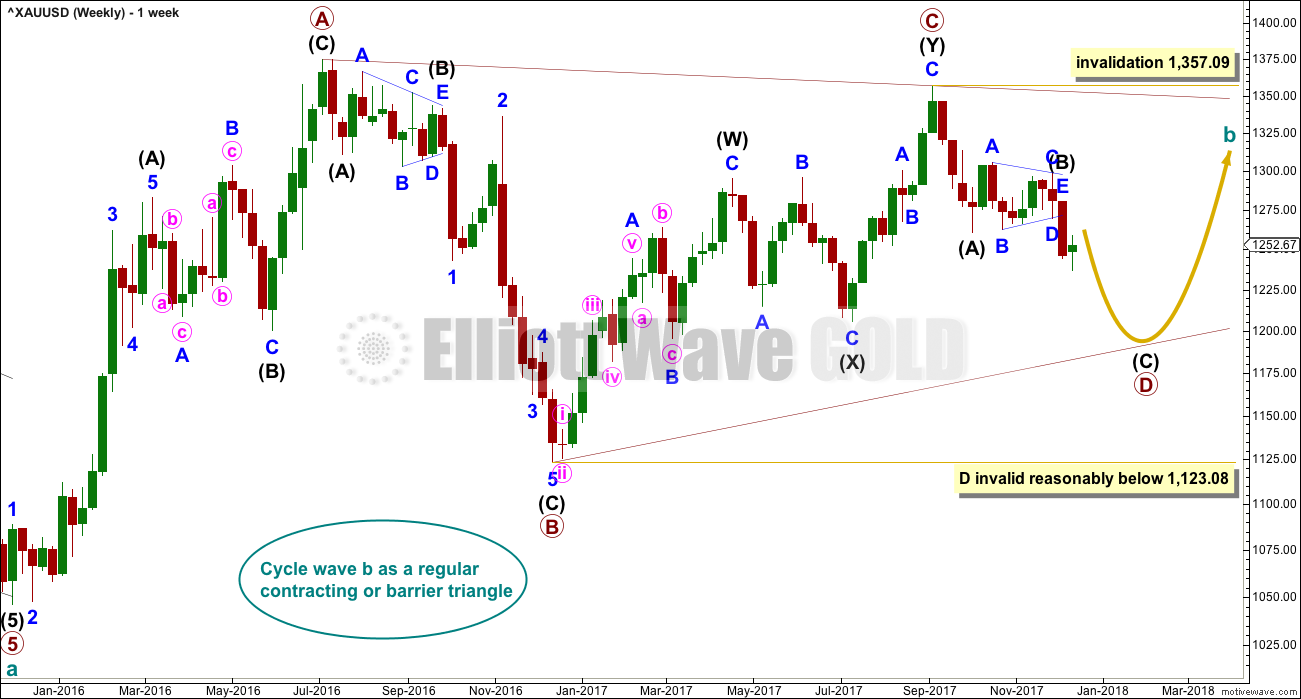
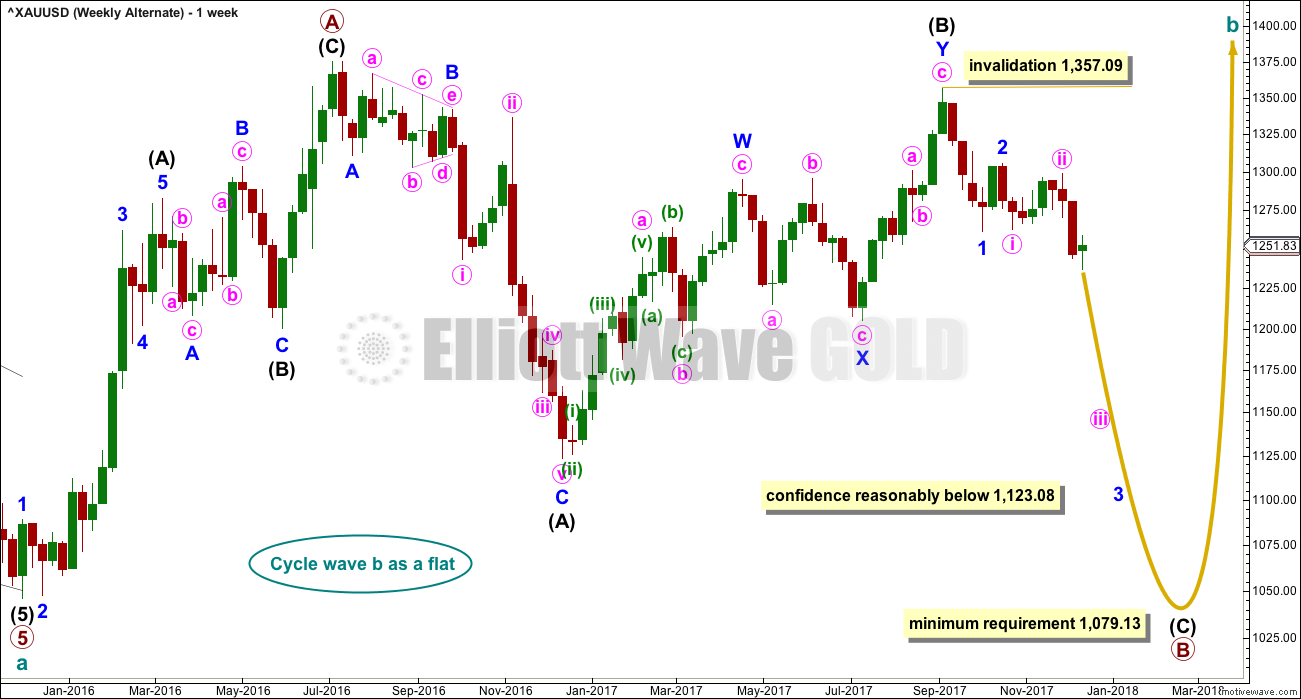
All wave counts expect that Gold completed a large five down from the all time high in November 2011 to the low of December 2015, which is seen on the left hand side of both weekly charts.
If this analysis is correct, then the five down may not be the completion of the correction. Corrective waves do not subdivide as fives; they subdivide as threes. The five down is seen as cycle wave a within Super Cycle wave (a).
All wave counts then expect cycle wave b began in December 2015.
There are more than 23 possible corrective structures that B waves may take. It is important to always have multiple wave counts when B waves are expected.
It looks unlikely that cycle wave b may have been over at the high labelled primary wave A. Primary wave A lasted less than one year at only 31 weeks. Cycle waves should last one to several years and B waves tend to be more time consuming than other Elliott waves, so this movement would be too brief for cycle wave b.
This wave count looks at cycle wave b to be most likely a regular contracting triangle.
The B-D trend line should have a reasonable slope for this triangle to have the right look, because the A-C trend line does not have a strong slope. A barrier triangle has a B-D trend line that is essentially flat; if that happened here, then the triangle trend lines would not converge with a normal look and that looks unlikely.
Primary wave D should be a single zigzag. Only one triangle sub-wave may be a more complicated multiple, and here primary wave C has completed as a double zigzag; this is the most common triangle sub-wave to subdivide as a multiple.
Primary wave D of a contracting triangle may not move beyond the end of primary wave B below 1,123.08.
At its completion, primary wave D should be an obvious three wave structure at the weekly chart level.
For this one weekly chart, two daily charts are presented below. They look at intermediate wave (B) in two different ways, and are presented now in order of probability.
DAILY CHART
Click chart to enlarge.
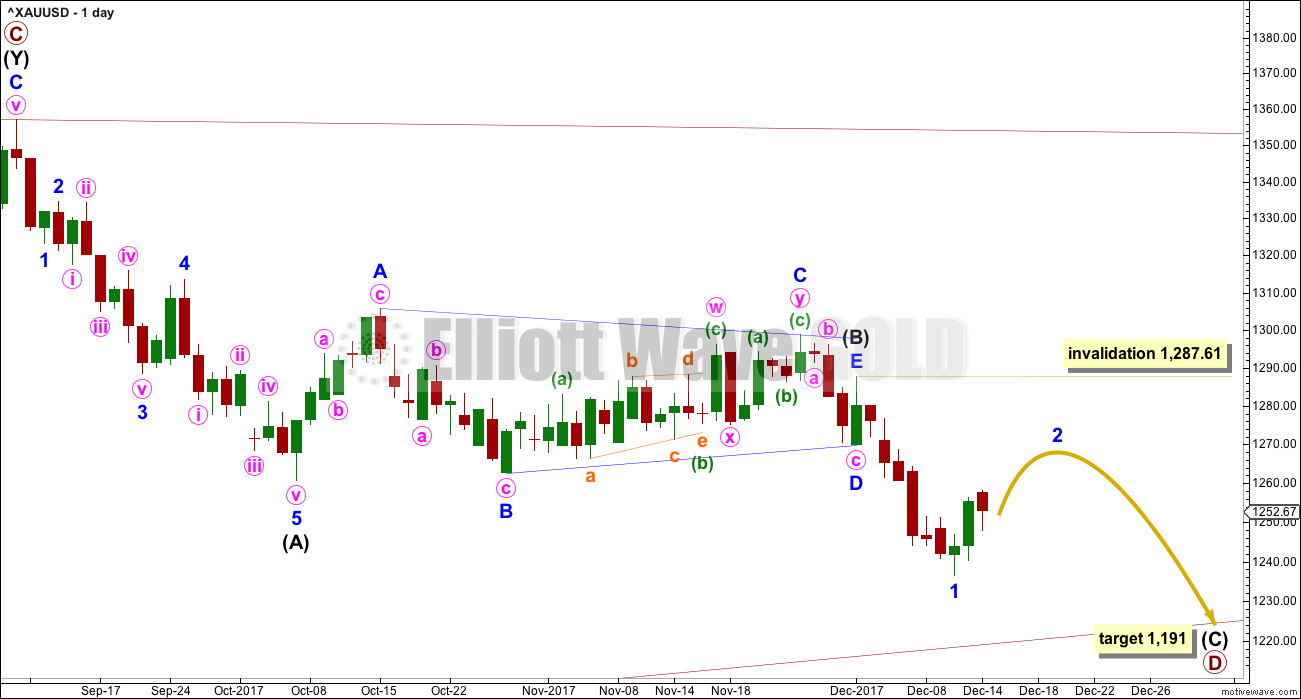
Both daily charts are identical up to the low labelled intermediate wave (A).
This first daily chart shows intermediate wave (B) as a now complete regular contracting Elliott wave triangle. This has support from what looks like a classic downwards breakout from the symmetrical triangle identified on the technical analysis chart below.
The target assumes that intermediate wave (C) may exhibit the most common Fibonacci ratio to intermediate wave (A).
Intermediate wave (C) must subdivide as a five wave structure. Within intermediate wave (C), minor wave 1 may now be complete and minor wave 2 may now have just begun. Minor wave 2 may not move beyond the start of minor wave 1 above 1,287.61.
Intermediate wave (A) lasted twenty sessions. Intermediate wave (C) may be about even in duration as well as length, so twenty or twenty-one sessions looks likely.
Minor wave 1 lasted seven sessions. For the wave count to have the right look, as Gold almost always does, minor wave 2 may be expected to last a Fibonacci three, five or eight sessions. It may be any corrective structure except a triangle, and it is most likely to be a zigzag.
At its end, minor wave 2 may present an opportunity to join the downwards trend in time to catch a third wave down.
HOURLY CHART
Click chart to enlarge.
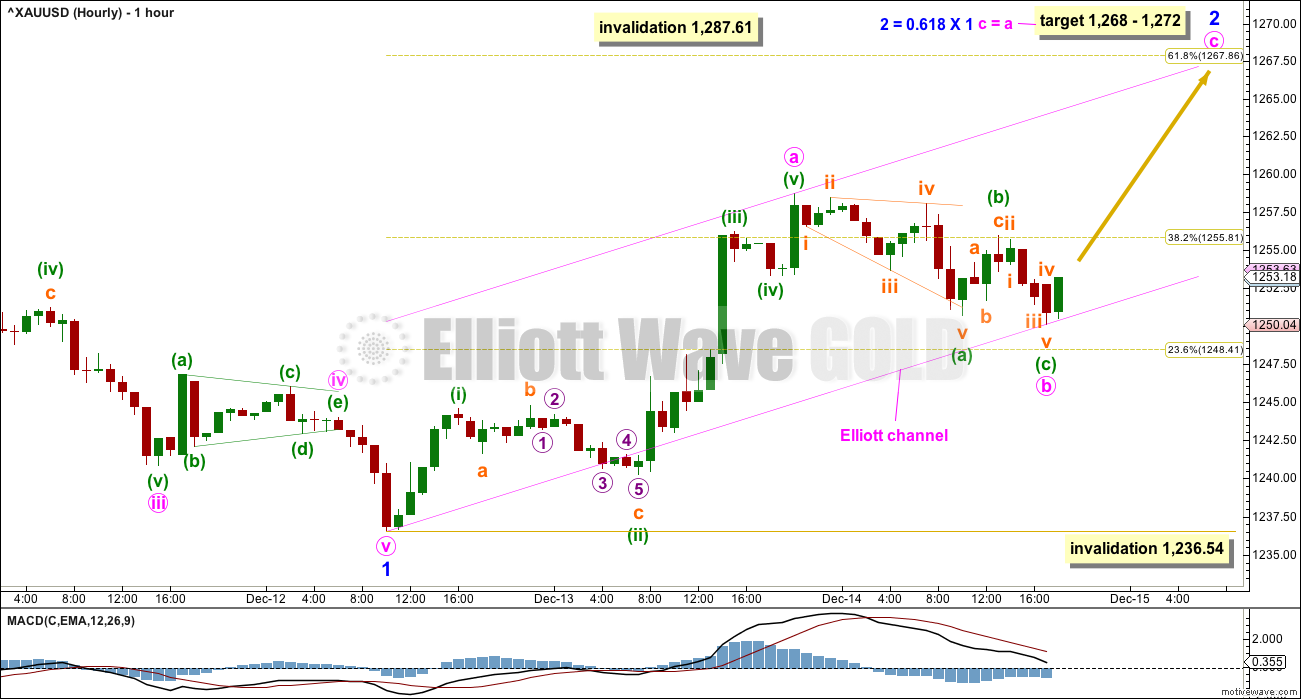
Minor wave 2 may be any one of several corrective structures. For reasonable proportion, it would most likely show up on the daily chart and last a few days.
Minor wave 2 looks like it is subdividing as a zigzag, the most common structure for a second wave. If this analysis is correct in labelling the last wave up as a five for minute wave a, then minute wave b may not move beyond the start of minute wave a, below 1,236.54, if it were to continue lower.
A target zone is now calculated for minute wave c upwards to end. This looks like it is unfolding relatively quickly. It may now be over within one more session, which may see minor wave 2 last only a Fibonacci three days.
When the next five up is complete, then a zigzag upwards would be complete. At that stage, minor wave 2 could be over. But it would also be possible to move the degree of labelling within minor wave 2 all down one degree, and see only a three up for minute wave a complete and minor wave 2 continuing further as a flat correction.
SECOND DAILY CHART
Click chart to enlarge.
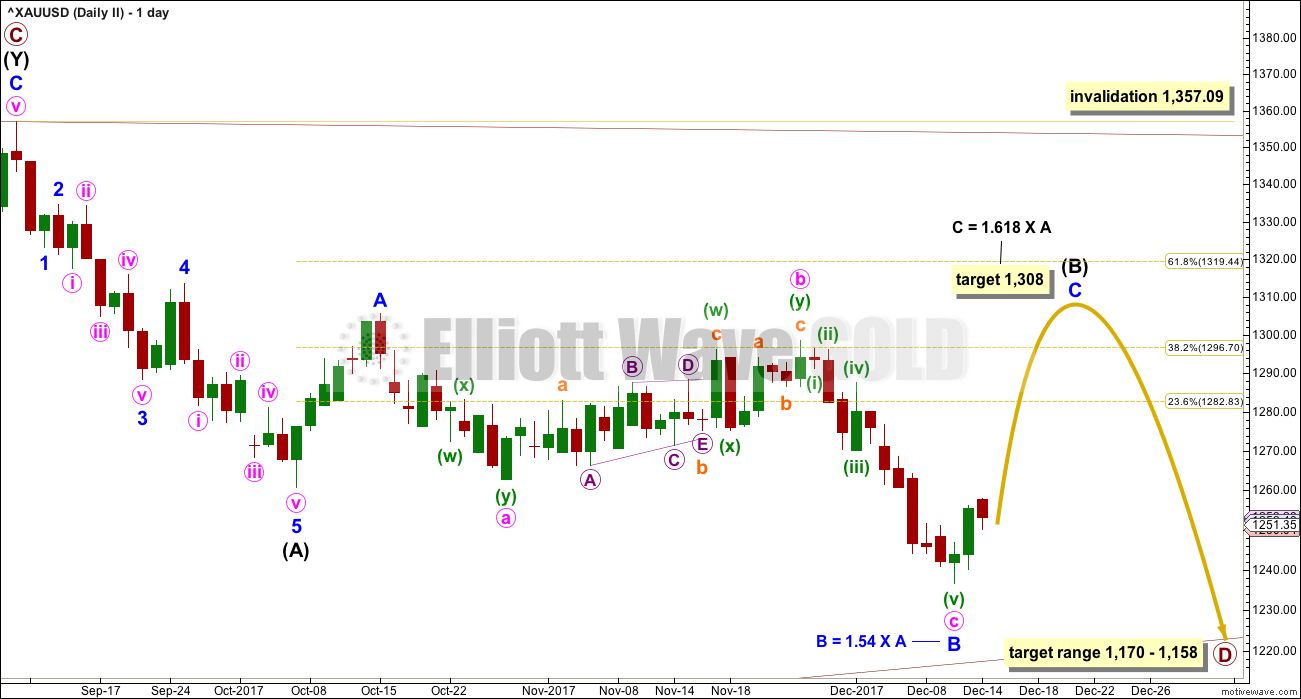
It is very important to always consider an alternate when a triangle may be unfolding. Triangles are very tricky structures, and may even be invalidated after one thinks they are complete.
It is still possible that intermediate wave (B) may be completing as a flat correction.
Within the flat correction, both minor waves A and B are threes. Minor wave B has retraced more than the minimum 0.9 length of minor wave A.
With minor wave B now a 1.54 length to minor wave A, an expanded flat is now indicated. Minor wave C of an expanded flat would most commonly be about 1.618 the length of minor wave A.
Now minor wave C may be required to move price upwards to end at least above the end of minor wave A at 1,305.72 to avoid a truncation.
A new high above 1,298.70 is required now for confidence in this wave count. If the upwards wave does not reach up to 1,298.70, then this second wave count will be discarded.
There should be something wrong or “off” about B waves. In this instance, the downwards wave of the last two weeks has some strength. While the market is falling of its own weight, On Balance Volume is very bearish. Classic technical analysis does not support this wave count, so it looks unlikely now.
ALTERNATE ELLIOTT WAVE COUNT
WEEKLY CHART
Click chart to enlarge.
All wave counts are identical to the low labelled cycle wave a. Thereafter, they look at different possible structures for cycle wave b.
Cycle wave b may be a flat correction. Within a flat primary, wave B must retrace a minimum 0.9 length of primary wave A at 1,079.13 or below.
TECHNICAL ANALYSIS
WEEKLY CHART
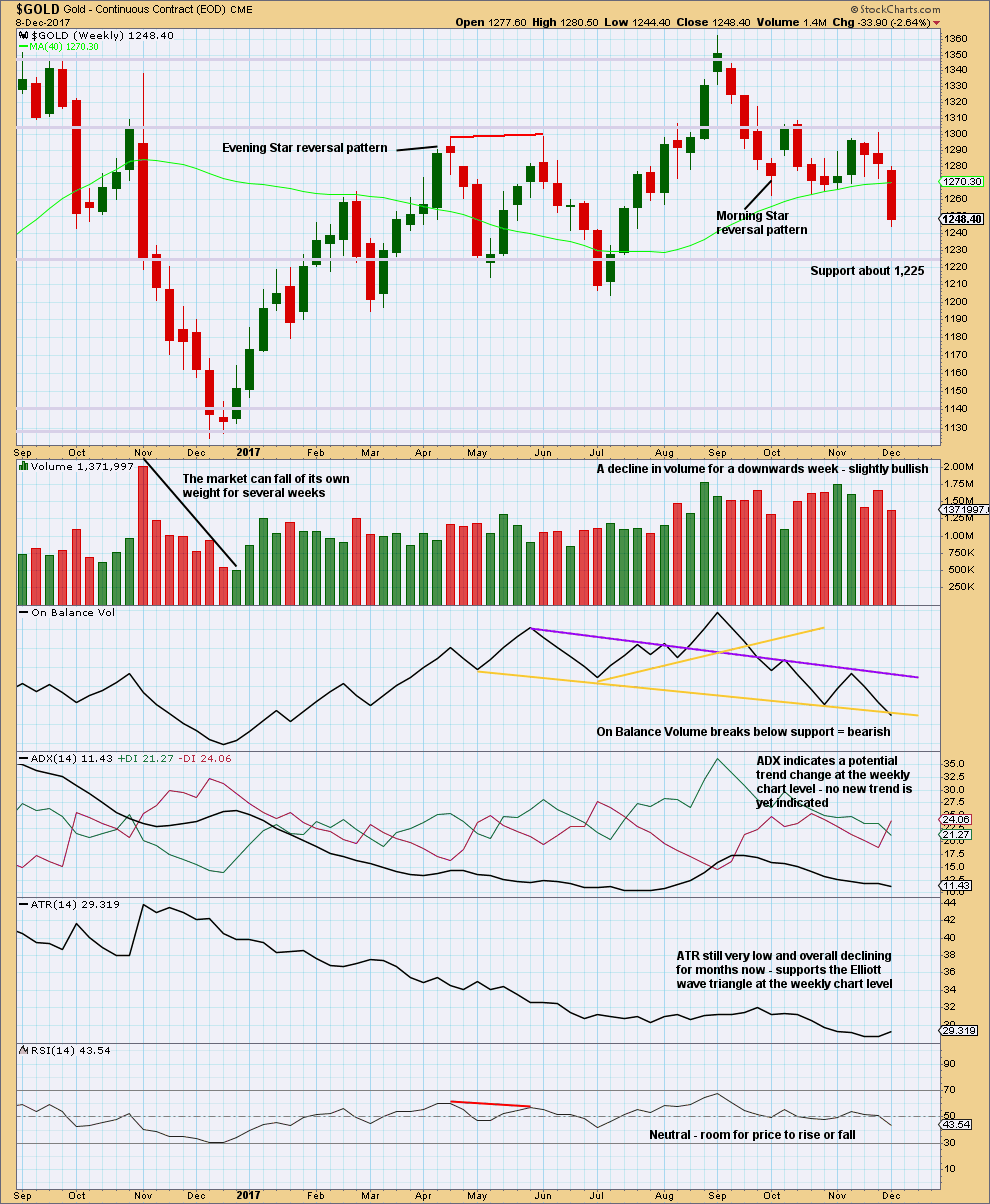
Click chart to enlarge. Chart courtesy of StockCharts.com.
Price has broken below support this week, which was about 1,262. The market this week fell of its own weight, but this can continue for several weeks as recent evidence noted on this chart for November 2016 shows.
The last signal given from On Balance Volume was bearish. Now On Balance Volume gives another clear bearish signal this week. With On Balance Volume now fairly bearish, this offers support to the main Elliott wave count.
DAILY CHART
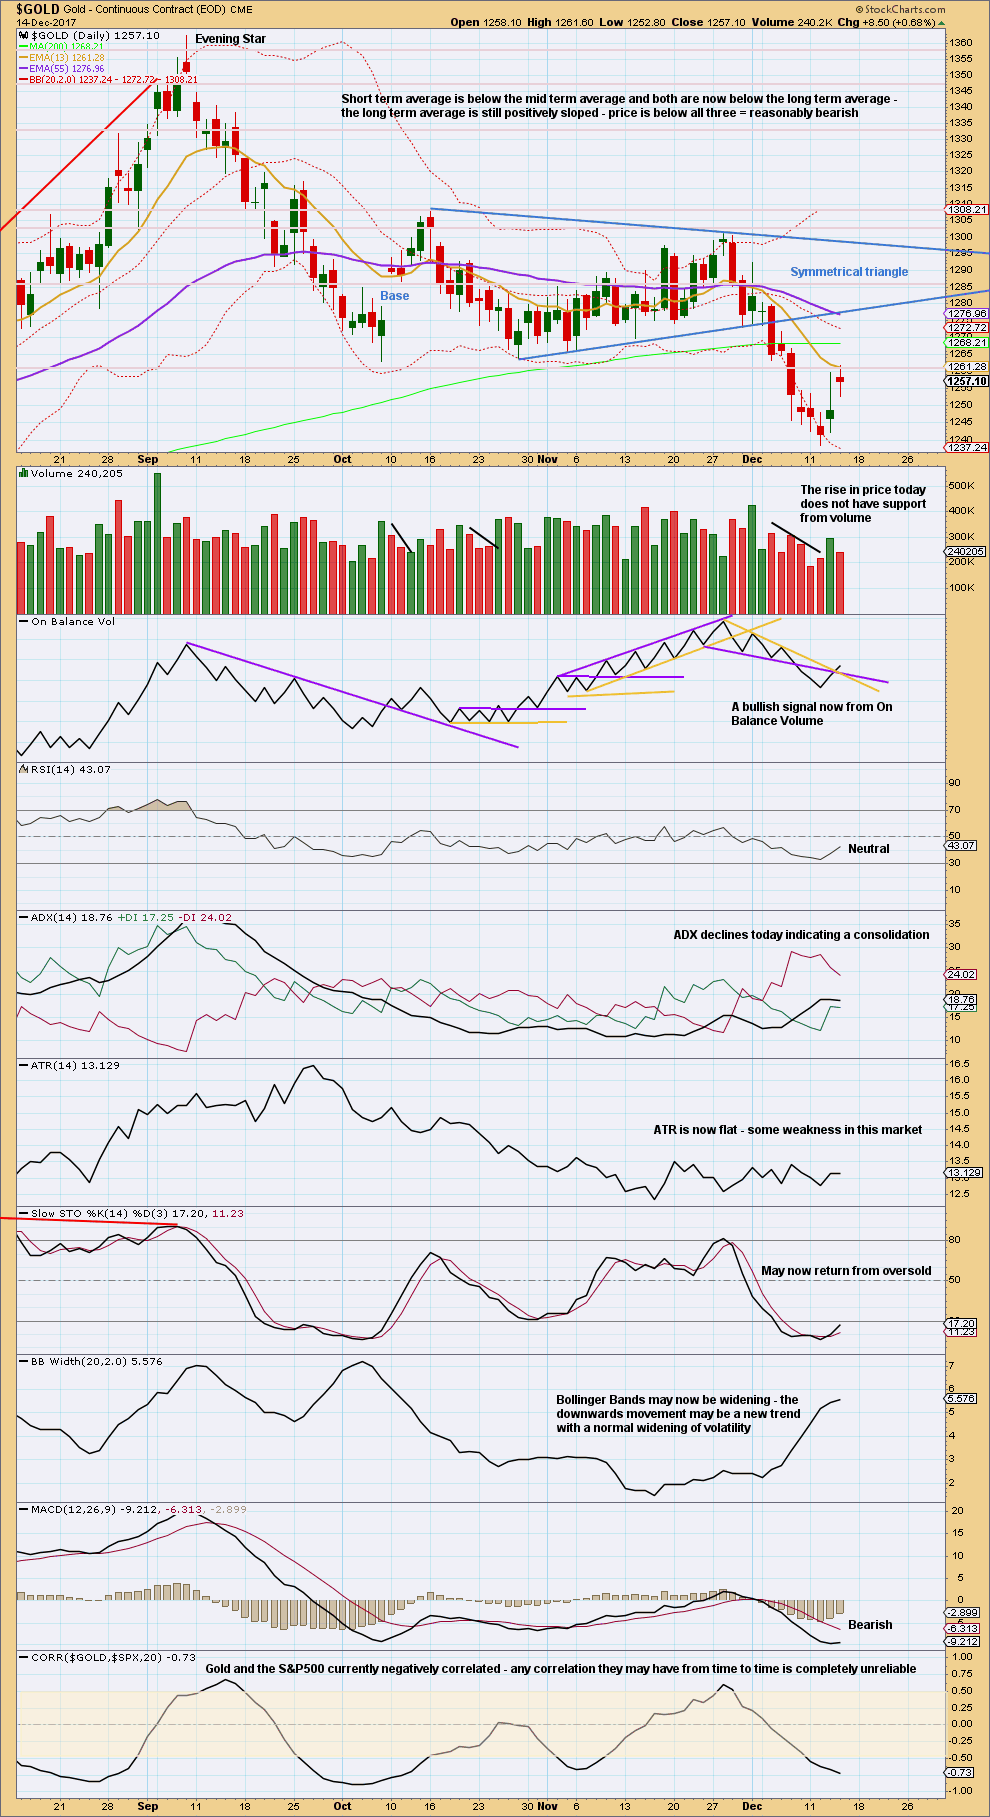
Click chart to enlarge. Chart courtesy of StockCharts.com.
A target calculated using the symmetrical triangle is about 1,228. That target has not yet been met.
On Balance Volume gives a bullish signal today. This offers some support to the main Elliott wave count which expects more upwards movement.
A slight decline in volume and another candlestick with a very small real body sees the trend now at neutral. This looks very much like a pause within a downwards trend, and not necessarily a trend change from down to up.
GDX DAILY CHART
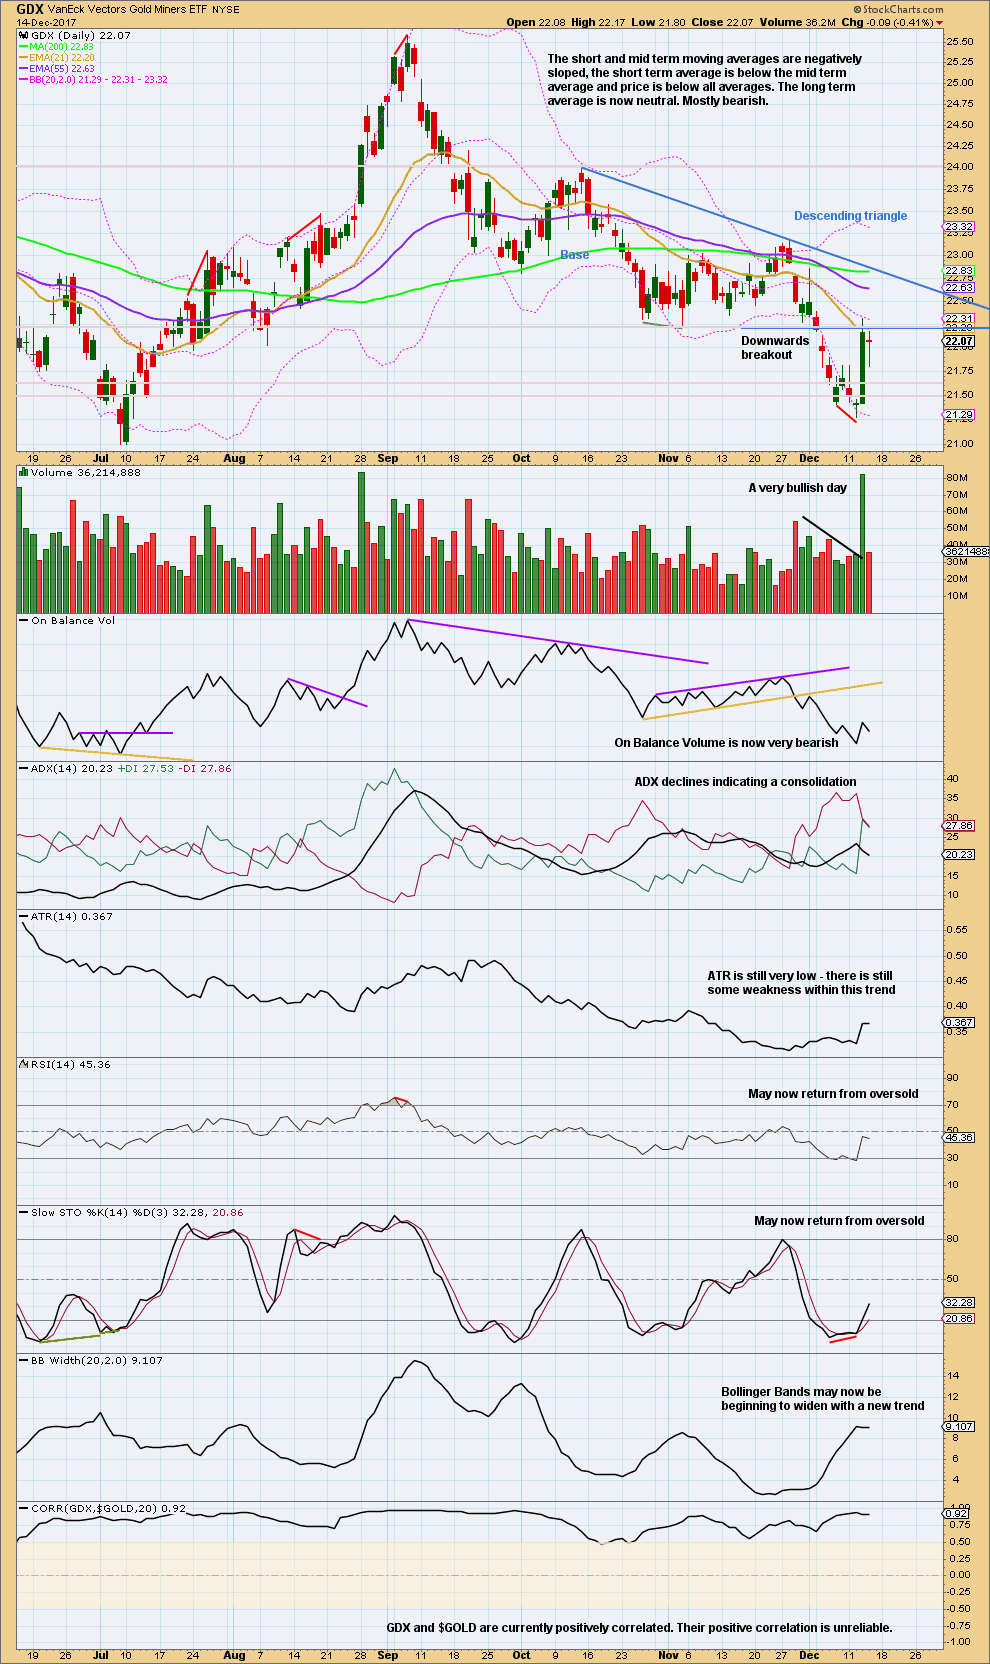
Click chart to enlarge. Chart courtesy of StockCharts.com.
Lighter volume for today, with a balance of volume downwards, is bullish short term. The doji candlestick today looks like a small pause within an upwards bounce.
It looks like price is going to break above resistance here about 22.20. Next resistance is about 22.80, the downwards sloping trend line from the descending triangle.
Published @ 06:56 p.m. EST.
Short version: with price not clearly moving down after a breach of the pink Elliott channel, be suspicious we have a high in place folks.
I leave the decision up to individual traders on how to trade this.
One approach may be to open a small speculative short position with a stop just above todays high. If minor 2 is over now that would be a great entry for a third wave down.
BUT
as you can see from the three charts posted below, there is a reasonable risk to this approach. Which is why I say a small position. Manage risk, reduce position size so that only 1-3% of equity is risked here. Closer to 1% would be my strong advice. Be prepared for a small loss here. Keep some powder dry for another entry later.
Or.. be patient and hold on for higher prices and a better entry.
Yes it is better to wait we always can have a better setup
Well…. not always. Sometimes we miss the best set up because greed or fear.
At the weekly and daily chart level volume and candlesticks look bearish.
This is also possible, and would explain the lack of clear downwards movement upon the breach of the Elliott channel. Double zigzags are actually pretty common structures (triples are very rare). The second zigzag in the double exists to deepen the correction when the first did not move price deep enough, a definition which certainly could fit minute w.
Hourly chart updated:
A zigzag up may now be complete. There is a small breach of the lower edge of the pink Elliott channel, but it’s not by clearly downwards movement which is a slight concern.
If minor 2 is over then a target is calculated for minor 3 which fits with the lower target for intermediate (C) to end.
This is now also possible, I’ll have to make a judgement on how likely when I do the end of week analysis.
Lara. I’ll consider a simple metric. The former supports at 1260.72 on October 6 and 1262.50 on October 27 had proved to be formidable resistance to the current struggle to surge higher. Unless and until these are breached authoritatively, the bull case is an illusion. That the rise yesterday up to 1258.68 and petering out after that may be telling.
Oops. The high yesterday was 1261.40, still short of the current (strong) resistance area.
A good point.
Welcome back Alan! Long time no hear! Glad to see you’re all well and still here 🙂 🙂 🙂
@CMP 1254 looks like Gold price has not yet confirmed minor 2 to be over. Needs a break below 1252 or 1250 to do that? Stochastic %K is still bullish. How to shake out the longs and get on with the business of the downside lol…. hmm interesting scenario with price having stalled at pivot.