
A little more upwards movement to 1,270 was expected. Price has moved higher to reach up to 1,268.58, just 1.42 short of the target.
Summary: A third wave down may begin from here. Some confidence may be had in this view when / if price breaks below the lower edge of the best fit channel on the hourly chart. There will be a higher risk to short positions while price remains within that channel.
The target for the third wave to end is now at 1,218. If this target is wrong, it may not be low enough.
Always trade with stops and invest only 1-5% of equity on any one trade.
New updates to this analysis are in bold.
Last monthly charts for the main wave count are here, another monthly alternate is here, and video is here.
Grand SuperCycle analysis is here.
MAIN ELLIOTT WAVE COUNT
WEEKLY CHART
Click chart to enlarge.
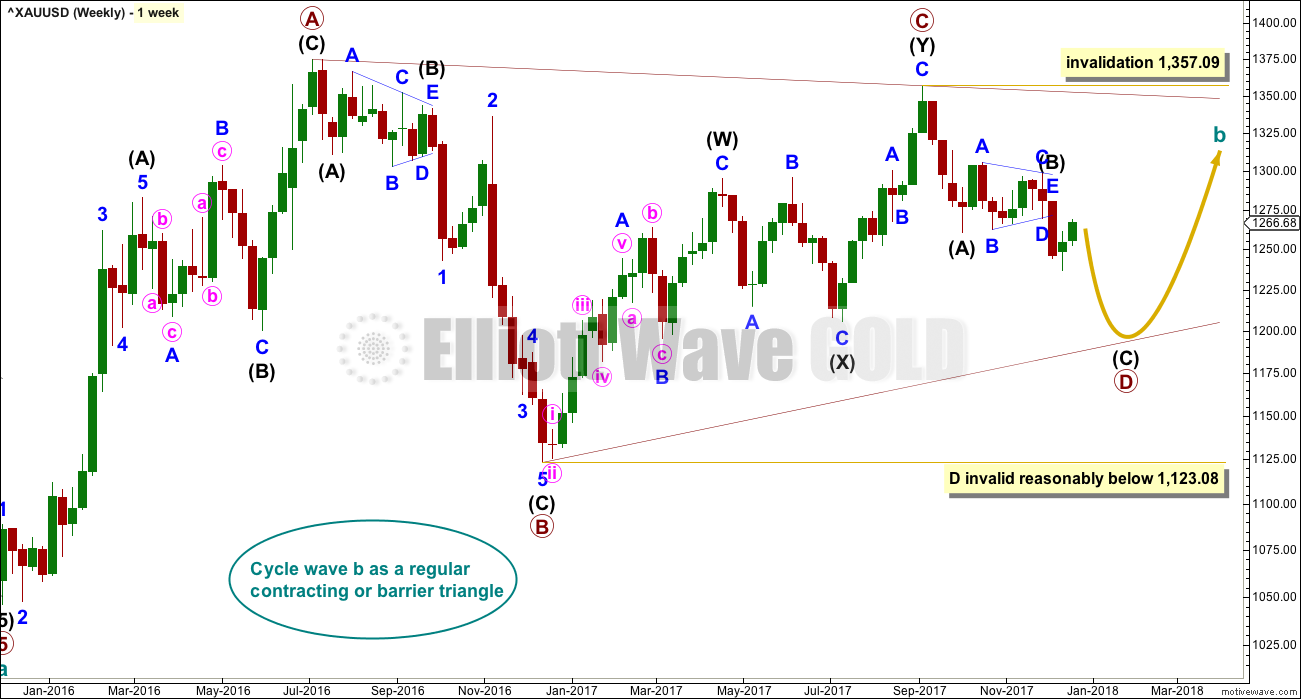
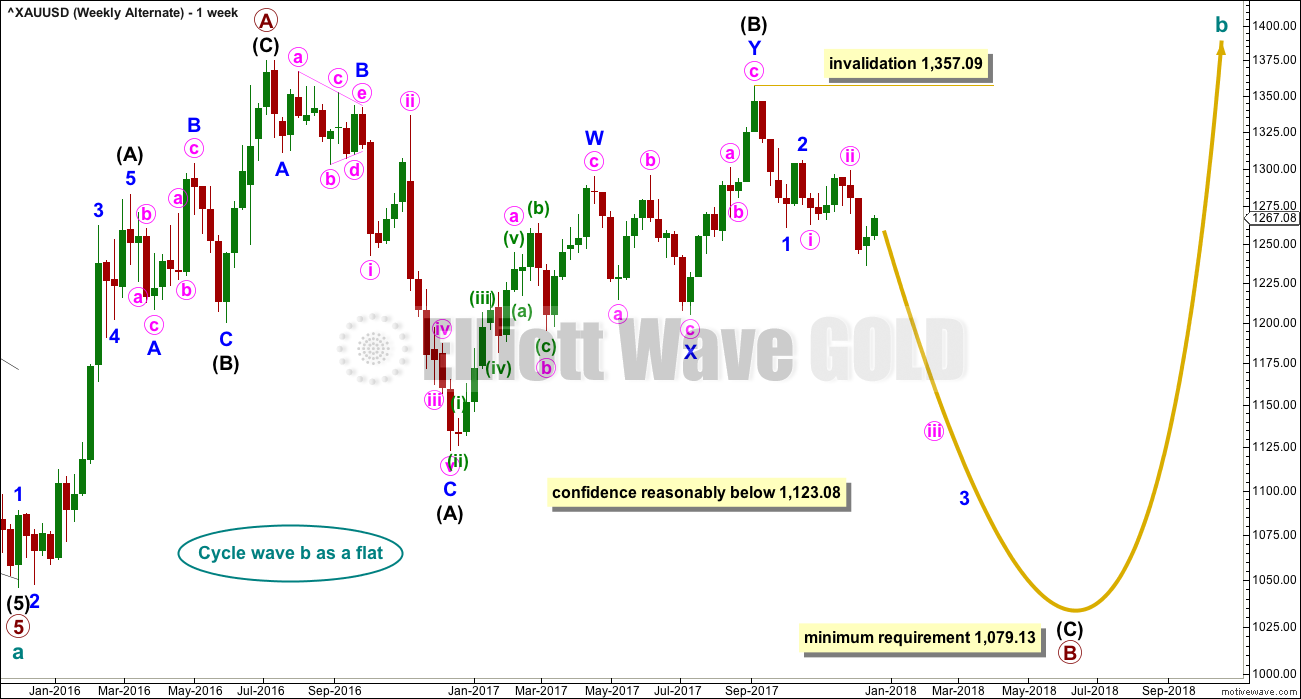
All wave counts expect that Gold completed a large five down from the all time high in November 2011 to the low of December 2015, which is seen on the left hand side of both weekly charts.
If this analysis is correct, then the five down may not be the completion of the correction. Corrective waves do not subdivide as fives; they subdivide as threes. The five down is seen as cycle wave a within Super Cycle wave (a).
All wave counts then expect cycle wave b began in December 2015.
There are more than 23 possible corrective structures that B waves may take. It is important to always have multiple wave counts when B waves are expected.
It looks unlikely that cycle wave b may have been over at the high labelled primary wave A. Primary wave A lasted less than one year at only 31 weeks. Cycle waves should last one to several years and B waves tend to be more time consuming than other Elliott waves, so this movement would be too brief for cycle wave b.
This wave count looks at cycle wave b to be most likely a regular contracting triangle.
The B-D trend line should have a reasonable slope for this triangle to have the right look, because the A-C trend line does not have a strong slope. A barrier triangle has a B-D trend line that is essentially flat; if that happened here, then the triangle trend lines would not converge with a normal look and that looks unlikely.
Primary wave D should be a single zigzag. Only one triangle sub-wave may be a more complicated multiple, and here primary wave C has completed as a double zigzag; this is the most common triangle sub-wave to subdivide as a multiple.
Primary wave D of a contracting triangle may not move beyond the end of primary wave B below 1,123.08.
At its completion, primary wave D should be an obvious three wave structure at the weekly chart level.
For this one weekly chart, two daily charts are presented below. They look at intermediate wave (B) in two different ways, and are presented now in order of probability.
DAILY CHART
Click chart to enlarge.
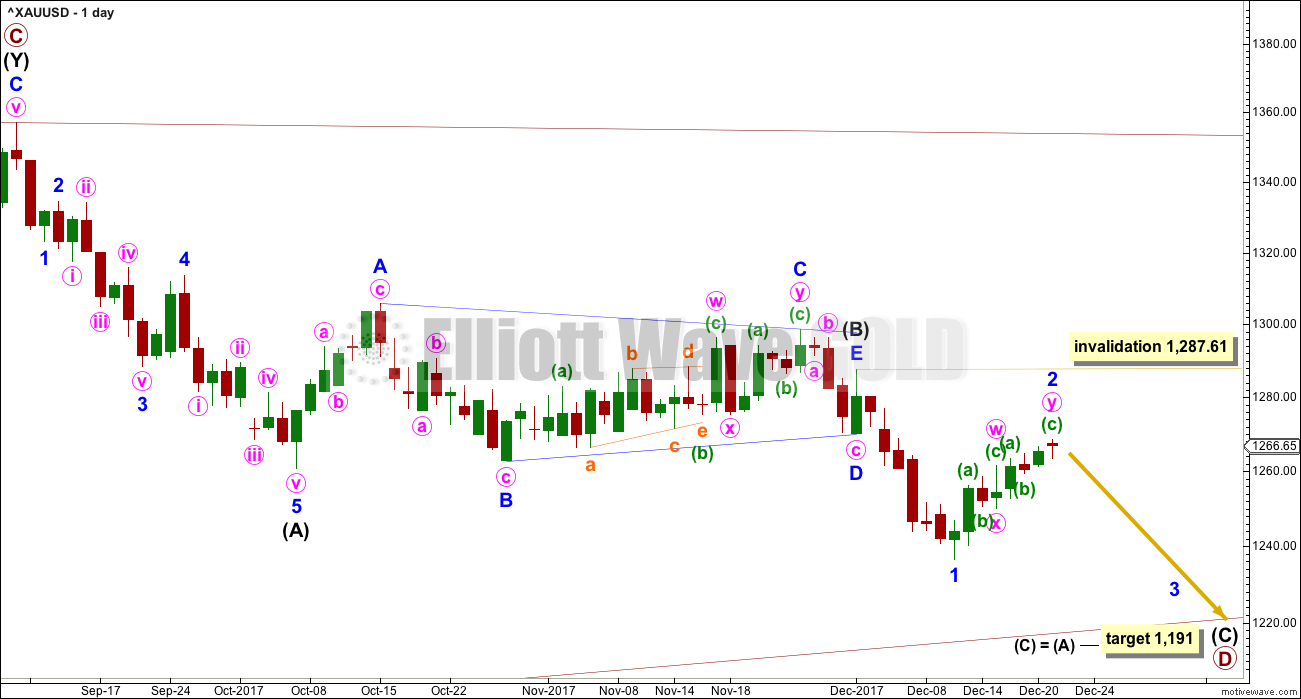
Both daily charts are identical up to the low labelled intermediate wave (A).
This first daily chart shows intermediate wave (B) as a now complete regular contracting Elliott wave triangle. This has support from what looks like a classic downwards breakout from the symmetrical triangle identified on the technical analysis chart below.
The target assumes that intermediate wave (C) may exhibit the most common Fibonacci ratio to intermediate wave (A).
Intermediate wave (C) must subdivide as a five wave structure. Within intermediate wave (C), minor wave 1 may now be complete.
Minor wave 2 so far has lasted seven days while minor wave 1 lasted seven days. Minor wave 2 may be over here, or it may continue a little further and be closer in proportion to minor wave 1.
Intermediate wave (A) lasted twenty sessions. Intermediate wave (C) may be about even in duration as well as length, so twenty or twenty-one sessions looks likely. The next Fibonacci ratio in the sequence would be thirty-four, and it is possible intermediate wave (C) could be this long lasting.
At its end, minor wave 2 may present an opportunity to join the downwards trend in time to catch a third wave down.
HOURLY CHART
Click chart to enlarge.
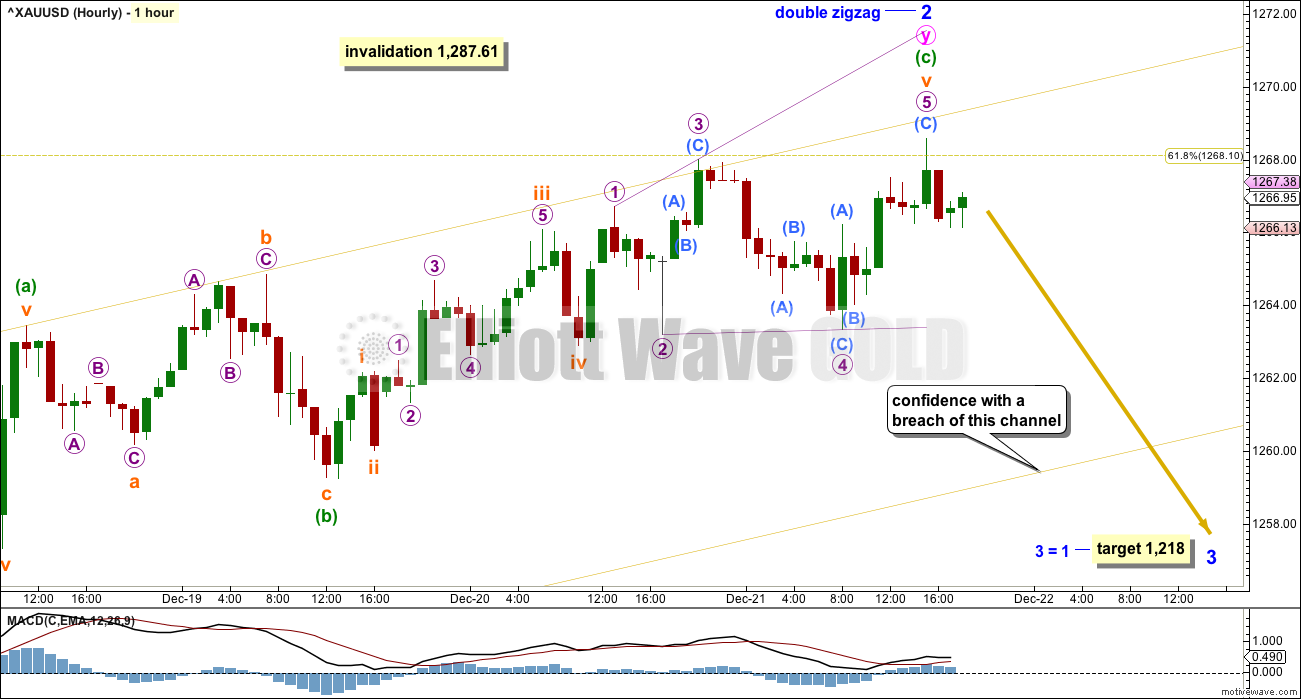
Minor wave 2 so far fits best as a double zigzag structure. These are very common. The second zigzag exists to deepen the correction when the first zigzag does not move price deep enough, and sometimes also when it does not last long enough. Minute wave w ending at only 0.49 of minor wave 1 and lasting only three days fits this description.
Minute wave y is deepening the correction and taking up more time.
The structure of the second zigzag for minute wave y is now complete. Minuette wave (c) fits neatly as a five wave impulse with its subminuette wave v an ending expanding diagonal, meeting all the rules for this structure.
On the five minute chart, the first small downwards wave from the high of minor wave 2 will fit well as an impulse.
When the best fit channel is clearly breached by downwards (not sideways) movement, then it shall provide some confidence that minor wave 2 may be over and minor wave 3 may have begun.
The bottom line is to allow for the possibility that price may continue higher while price remains within the channel. There will be greater risk to any short positions opened while price remains within the channel.
Members with a lower tolerance for risk may choose to wait for confidence in a trend change by a clear breach of the best fit channel.
Minor wave 2 may not move beyond the start of minor wave 1 above 1,287.61.
SECOND DAILY CHART
Click chart to enlarge.
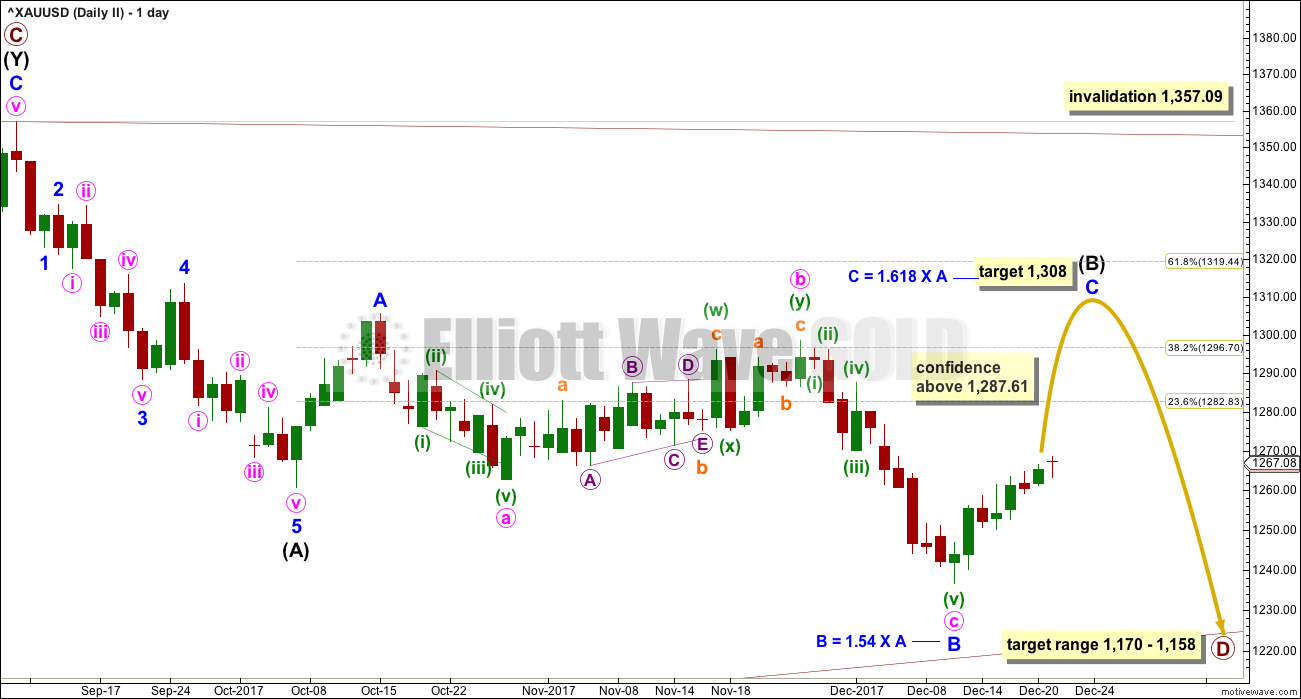
It is very important to always consider an alternate when a triangle may be unfolding. Triangles are very tricky structures, and may even be invalidated after one thinks they are complete.
It is still possible that intermediate wave (B) may be completing as a flat correction.
Within the flat correction, both minor waves A and B are threes. Minor wave B has retraced more than the minimum 0.9 length of minor wave A.
With minor wave B now a 1.54 length to minor wave A, an expanded flat is now indicated. Minor wave C of an expanded flat would most commonly be about 1.618 the length of minor wave A.
Now minor wave C may be required to move price upwards to end at least above the end of minor wave A at 1,305.72 to avoid a truncation.
A new high above 1,287.61 is required now for confidence in this wave count. If the upwards wave does not reach up to 1,287.61, then this second wave count will be discarded.
There should be something wrong or “off” about B waves. In this instance, the last downwards wave has some strength. While the market fell of its own weight, On Balance Volume gave bearish signals. Classic technical analysis does not support this wave count, so it looks unlikely now.
ALTERNATE ELLIOTT WAVE COUNT
WEEKLY CHART
Click chart to enlarge.
All wave counts are identical to the low labelled cycle wave a. Thereafter, they look at different possible structures for cycle wave b.
Cycle wave b may be a flat correction. Within a flat primary, wave B must retrace a minimum 0.9 length of primary wave A at 1,079.13 or below.
TECHNICAL ANALYSIS
WEEKLY CHART
Click chart to enlarge. Chart courtesy of StockCharts.com.
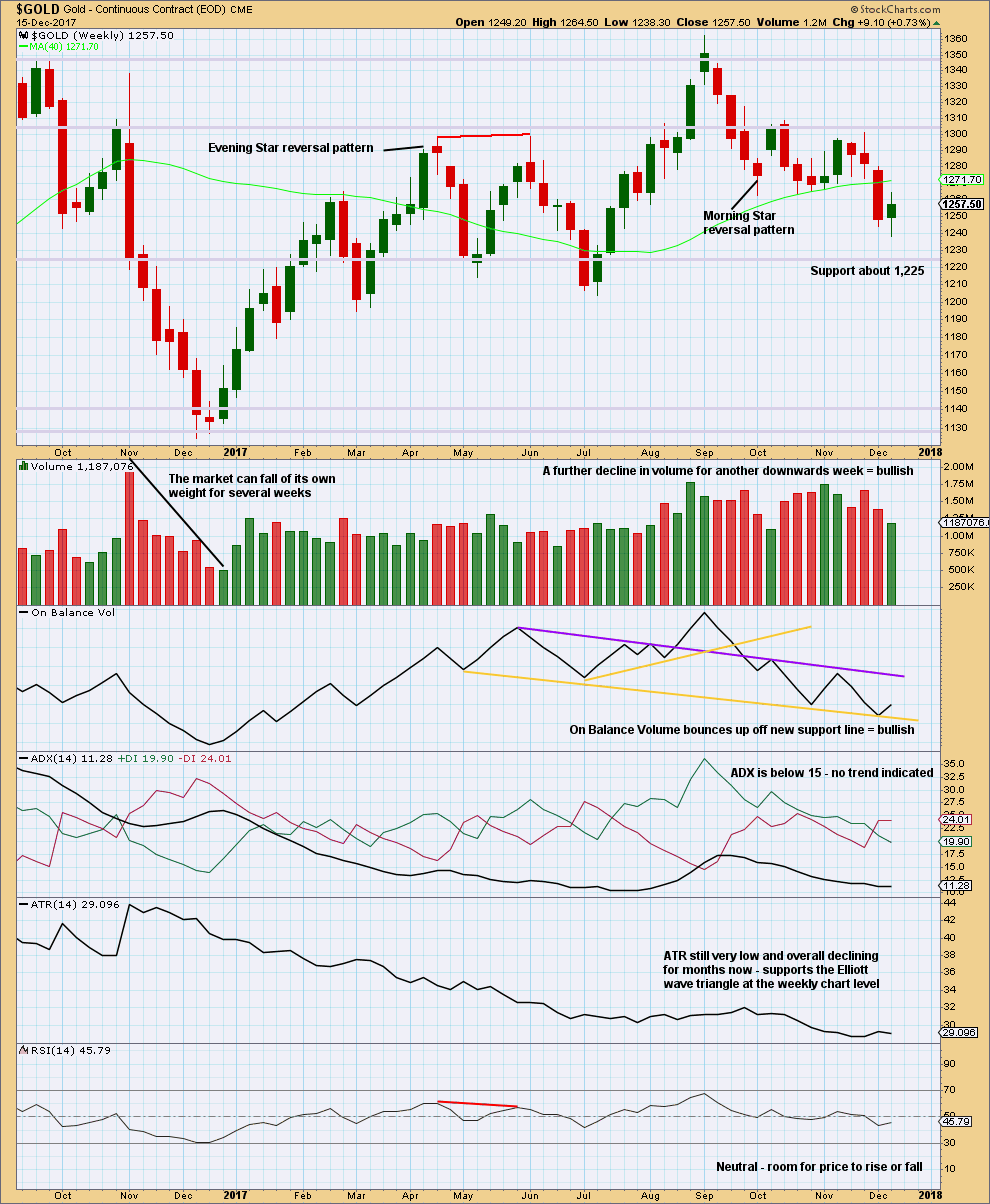
The market is falling of its own weight. Next support is about 1,225.
The small real body of the last weekly candlestick puts the trend from down to neutral.
The support line for On Balance Volume is redrawn. A bounce up this week may be bullish.
DAILY CHART
Click chart to enlarge. Chart courtesy of StockCharts.com.
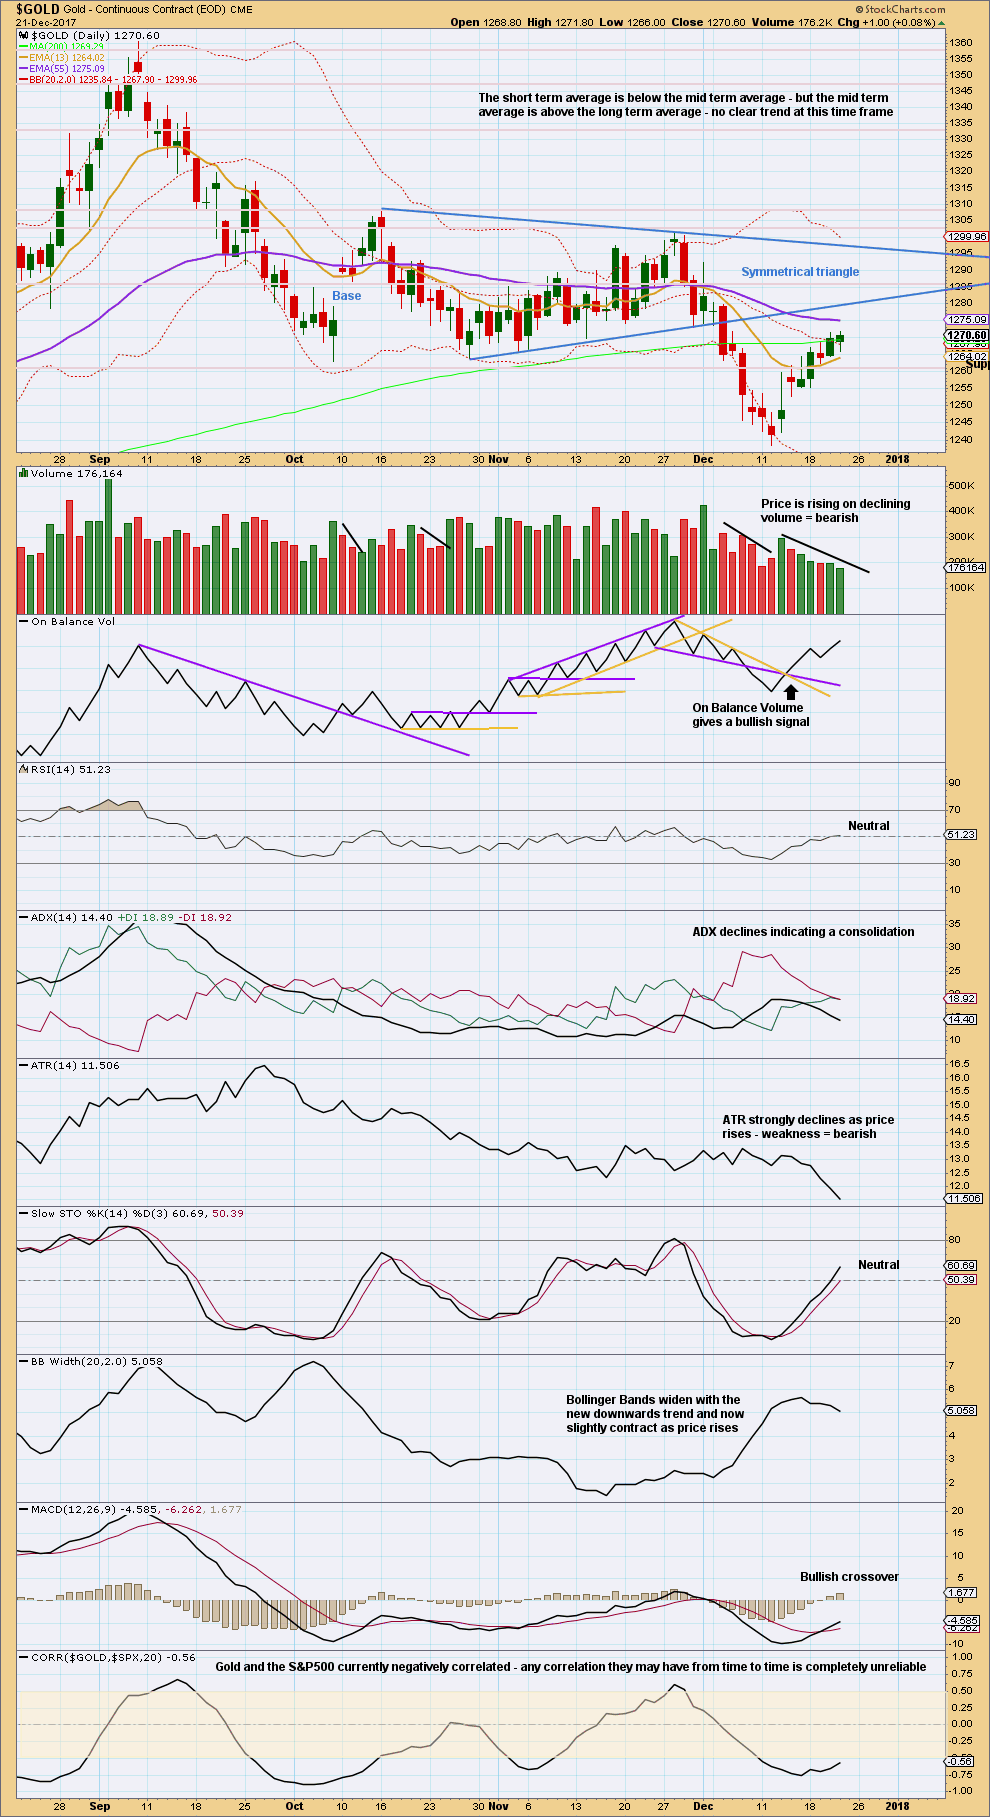
Today’s session saw upwards movement with volume the lightest of all days on this chart. The decline in volume and ATR, at this stage for this upwards movement, now looks very bearish. This does not look like a reasonable and sustainable move in price and looks very much like a counter trend movement.
A throwback to the lower edge of the symmetrical triangle is unlikely (that happens only 37% of the time). So we should expect this bounce to end very soon before it gets that high.
GDX DAILY CHART
Click chart to enlarge. Chart courtesy of StockCharts.com.
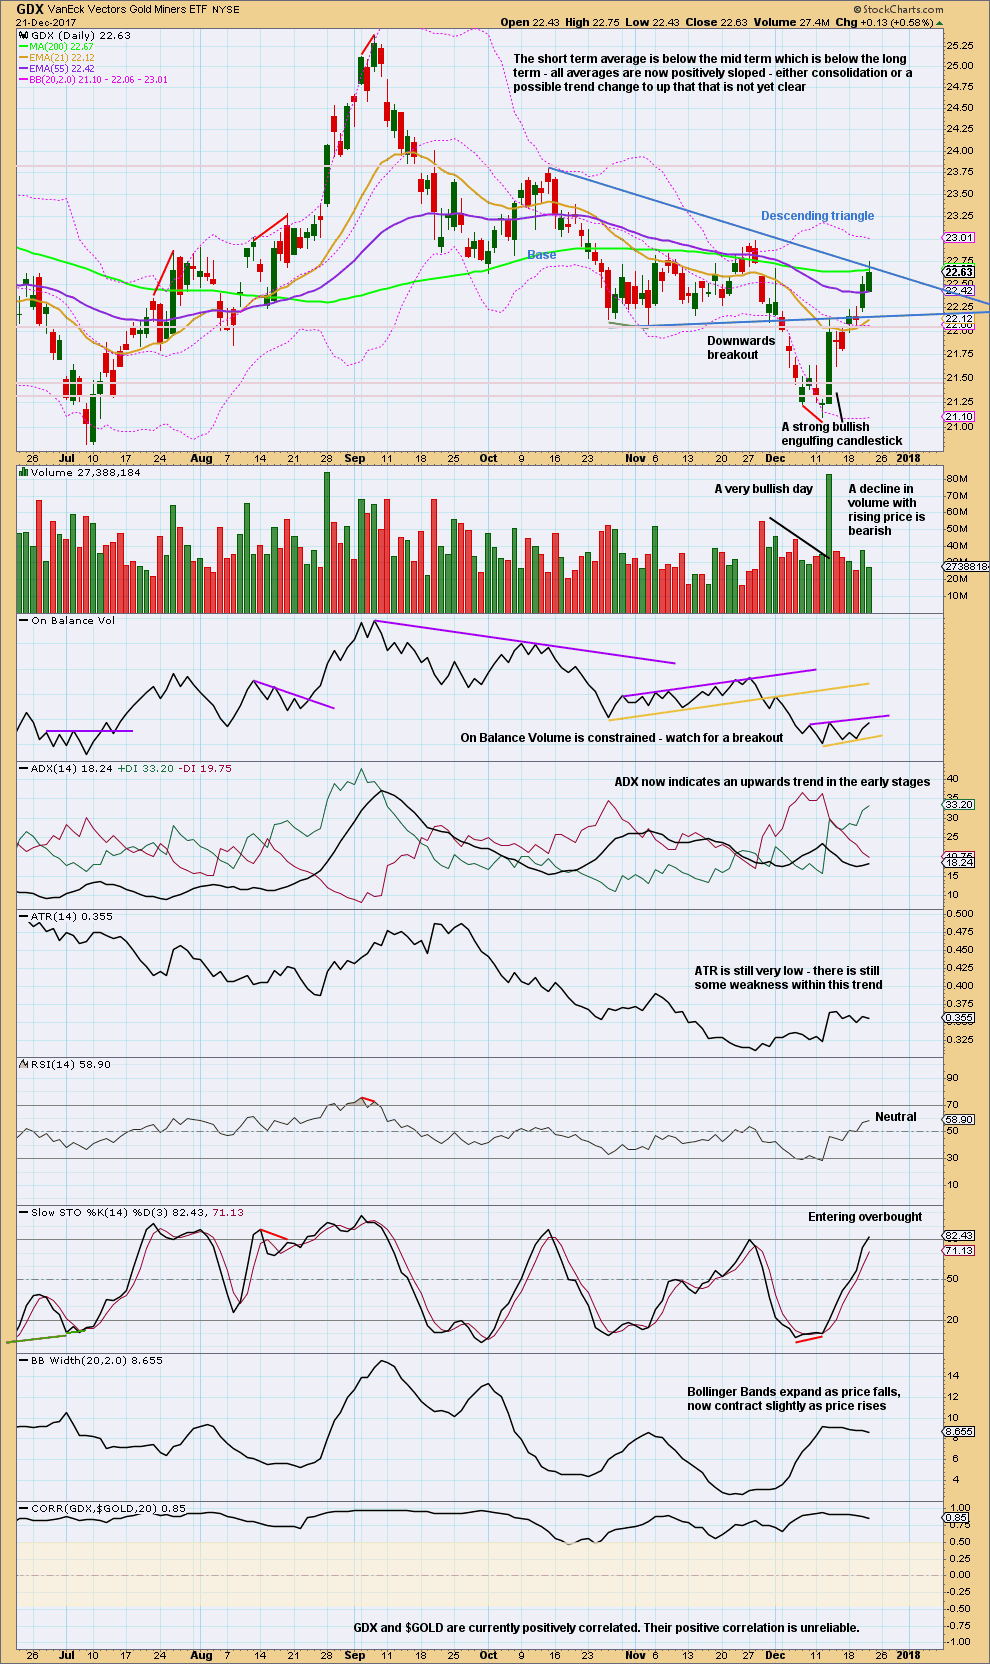
Price may find resistance here about the upper edge of the triangle. The slightly longer upper wick today looks bearish, but only slightly.
Price could certainly continue higher.
TRADING ADVICE
Short positions opened on or before 1st of December, and particularly any short positions opened above 1,287.61, may still be held for traders with a longer term horizon.
The trend for now is down. Bounces are opportunities to enter the trend. All trades should remain with the trend.
Members are advised today to enter short, with stops just above 1,280. Alternatively, members with a lower risk tolerance may prefer to wait for the channel on the hourly chart to be breached before entering short.
The profit target for now is at 1,218 for mid term positions, and 1,191 for longer term positions.
Adjust position size so that only 1-5% of equity is risked on this one trade.
Published @ 07:31 p.m. EST.
Well well well. That’s a surprise. StockCharts data for the session is now available and finalised, and volume shows another drop. That’s the lightest volume day since 31st July 2017.
Still, this time of the year is normally very light on volume and so I don’t know how much should be read into that. The last two years saw very light volume at this time in December through to the second week of January. Both of those times were major lows.
But in both of those instances the days with very light volume were downwards days, which gave a bullish volume profile. And the major upwards trends had some strong upwards days to begin.
I’ll take a deeper look at those two most recent examples, we may learn something here.
Check out wave 2 near nov 2016, (C) of B. That was a nasty 2 wave to shake out all of those shorts!
Short positions should be closed if price moves above 1,287.61. Losses should not exceed 5% of equity.
Any members who were waiting for the channel on the hourly chart to be breached would not have open positions.
It’s time to add this chart to the analysis.
It is possible for Gold (and also for Silver) that wave D of the big triangle is complete.
It may be in the final wave E up. To subdivide as a zigzag.
That could explain the weakness in the beginning of this move up. Wave E of a triangle should be pretty weak.
Well, I got it right every day for about two weeks until today 🙁
Sometimes I get it wrong.
Second wave corrections can be very deep, if volume again does not support this rise in price then the main wave count would still be supported. But if volume shows a spike then the second daily wave count would be slightly indicated.
If this upwards wave is a second wave, then it’s either a single or double zigzag. So I’ll chart both. I can see neither complete at this stage. Targets calculated are very close for both counts.
Double zigzag count above.
Single zigzag count below.
i think we are in the Daily II scenario or we have finished D of the triangle
It’s definitely starting to look like that now isn’t it.
With the data we had in hand yesterday we had rising price on falling volume, and strongly falling ATR. It looked weak.
But today ATR will show an increase, and I bet volume will too. This move looks strong.
It is still possible that the recent low was a backtest of a breakout. This still looks OK on the weekly with a reversal. Cheap gold miners like an early Christmas present again this year? Junior miners looking more positive this week gives this idea some support as they appear to be starting to out-perform gold. The recent lows in gold and the miners look more like capitulation than the start of new downtrend. It is possible the C wave down could already be a complete impulse? Respectfully an alternate view.
That does look good!
I tend to agree.
I do not currently have any open positions in gold and hence not to be construed as being biased. But, gold falling to $700 levels, when a big mac combo costs more today than it did in 2012? US$ sick. Indexes over stretched.
Is this log scale, Stuart?
Thank you kindly.
Yes log scale. Some positives at present. DXY down GNX up. OBV bullish. COT favourable especially silver at present.
My longer term model supports a big upward move for the miners as a high probability (not precise on actual timing) This may sound weird, but gold has to go up to “co-operate” with what I am see in the miners and go up as well to new highs. Not what Lara is modelling, but I am completely OK with that as her analysis is instructive and at times very helpful.
IMO the recent lows in GDX have the kind of signature of capitulation that precedes a big reversal. That recent high volume candle was what I was waiting for. The kind of thing I remember occurring a few times in the bull market 2001-8 although I had much less experience then.
We all have to invest and trade the way our own analysis dictates in the end. I felt there was a good case for buying some of the lesser quality miners in very oversold situations over the last week or so.
Time will tell …..
I have the highest regard for Lara’s Elliott Wave prowess.
And, I also believe in a bullish case for Gold and miners.
Who is to say? Oil, slowly but surely being replaced by greener technology. May be gold will go the way of oil too? A more robust, more secure, State “guaranteed !!” Blockchain? Since the shift to Fiat Currency, the value of Gold as currency has steadily diminished, in the dollar denominated trade-world. The private citizen still holds gold as a store of value… And, China, Russia, India etc have been adding to their gold holdings…..
Yes, you are right, time will tell. Hopefully soon!!
can’t see gold falling this side of Christmas
Hi Nick. Seems like Gold price is cushioning off 20dma (1264.30) gently and consistently probing the 200dma (1269.32). Probably just a matter of time before Gold price breaks above resistance. Unless price failure occurs around this price point and we do get the much awaited third wave down. Real teaser this lol. Have a fine day!
Well, with Christmas on Monday it can’t now. It’s only got another couple of hours.
I’ve never traded bitcoin, but it’s interesting to watch. This may not even be the BIG crash, which will come someday. Regular corrections are huge
https://www.tradingview.com/x/2lvanbtZ/
Uneasy calm prevails over gold price as it continues to remain mostly flat. Test of patience I guess lol. With bullish stochastic & CCI hinting at closing shorts and initiating longs is a matter of concern though whilst 1262 continues to hold (downside risk 1257?). SEASONS GREETINGS AND HAPPY NEW YEAR ALL. GL folks! 🙂