
Upwards movement for Friday’s session has found resistance right at the lower trend line of the symmetrical triangle.
Volume analysis is used to determine the most likely Elliott wave count of four possibilities.
Summary: Volume still does not support this upwards movement. With price right at the lower triangle trend line, this looks like a throwback, which occur 37% of the time after a breakout from a symmetrical triangle.
Have confidence in a trend change to down if price can break below the best fit channel on the hourly chart. There will still be reasonable risk to any short positions while price remains within the channel.
A new low below 1,261.40 would add confidence that a third wave down should be underway. The target would be about 1,225.
A new high above 1,287.61 would switch this analysis to bullish, and at that time both the second and third daily wave counts would then be used. The target would be about 1,308.
Always trade with stops and invest only 1-5% of equity on any one trade.
New updates to this analysis are in bold.
Last monthly charts for the main wave count are here, another monthly alternate is here, and video is here.
Grand SuperCycle analysis is here.
MAIN ELLIOTT WAVE COUNT
WEEKLY CHART
Click chart to enlarge.
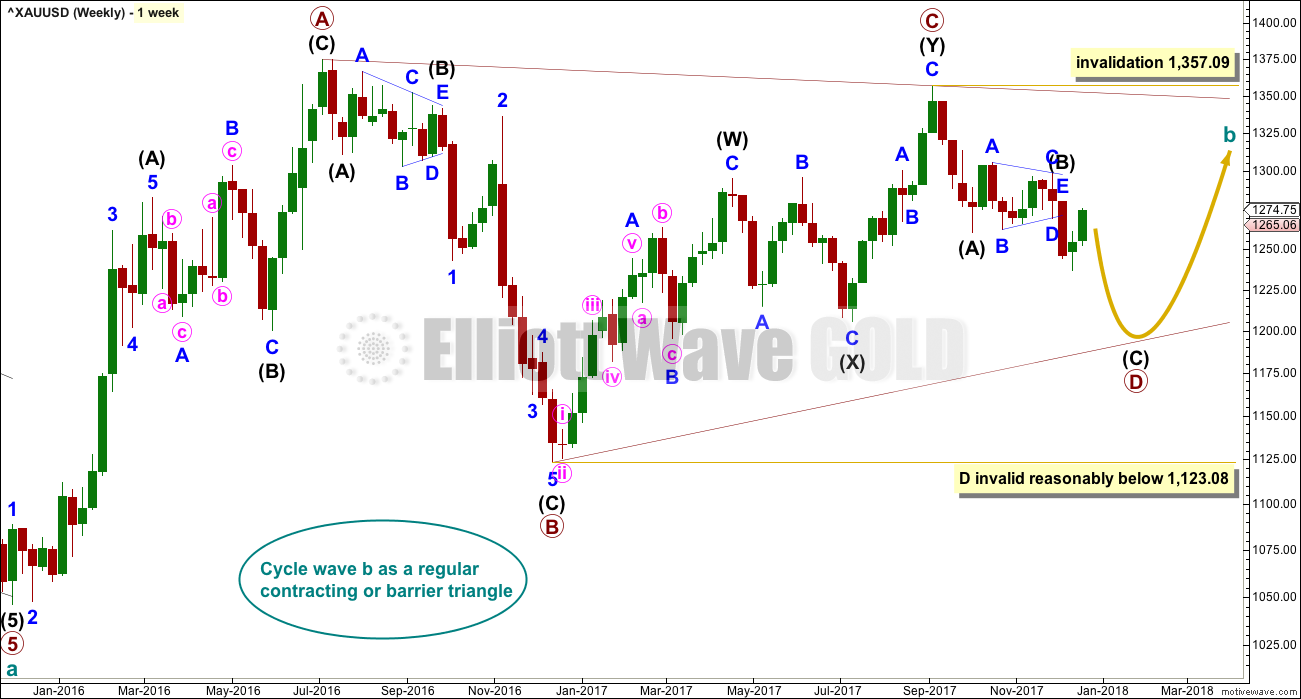
All wave counts expect that Gold completed a large five down from the all time high in November 2011 to the low of December 2015, which is seen on the left hand side of both weekly charts.
If this analysis is correct, then the five down may not be the completion of the correction. Corrective waves do not subdivide as fives; they subdivide as threes. The five down is seen as cycle wave a within Super Cycle wave (a).
All wave counts then expect cycle wave b began in December 2015.
There are more than 23 possible corrective structures that B waves may take. It is important to always have multiple wave counts when B waves are expected.
It looks unlikely that cycle wave b may have been over at the high labelled primary wave A. Primary wave A lasted less than one year at only 31 weeks. Cycle waves should last one to several years and B waves tend to be more time consuming than other Elliott waves, so this movement would be too brief for cycle wave b.
This wave count looks at cycle wave b to be most likely a regular contracting triangle.
The B-D trend line should have a reasonable slope for this triangle to have the right look, because the A-C trend line does not have a strong slope. A barrier triangle has a B-D trend line that is essentially flat; if that happened here, then the triangle trend lines would not converge with a normal look and that looks unlikely.
Primary wave D should be a single zigzag. Only one triangle sub-wave may be a more complicated multiple, and here primary wave C has completed as a double zigzag; this is the most common triangle sub-wave to subdivide as a multiple.
Primary wave D of a contracting triangle may not move beyond the end of primary wave B below 1,123.08.
At its completion, primary wave D should be an obvious three wave structure at the weekly chart level.
For this one weekly chart, three daily charts are presented below. They are presented now in order of probability.
FIRST DAILY CHART
Click chart to enlarge.
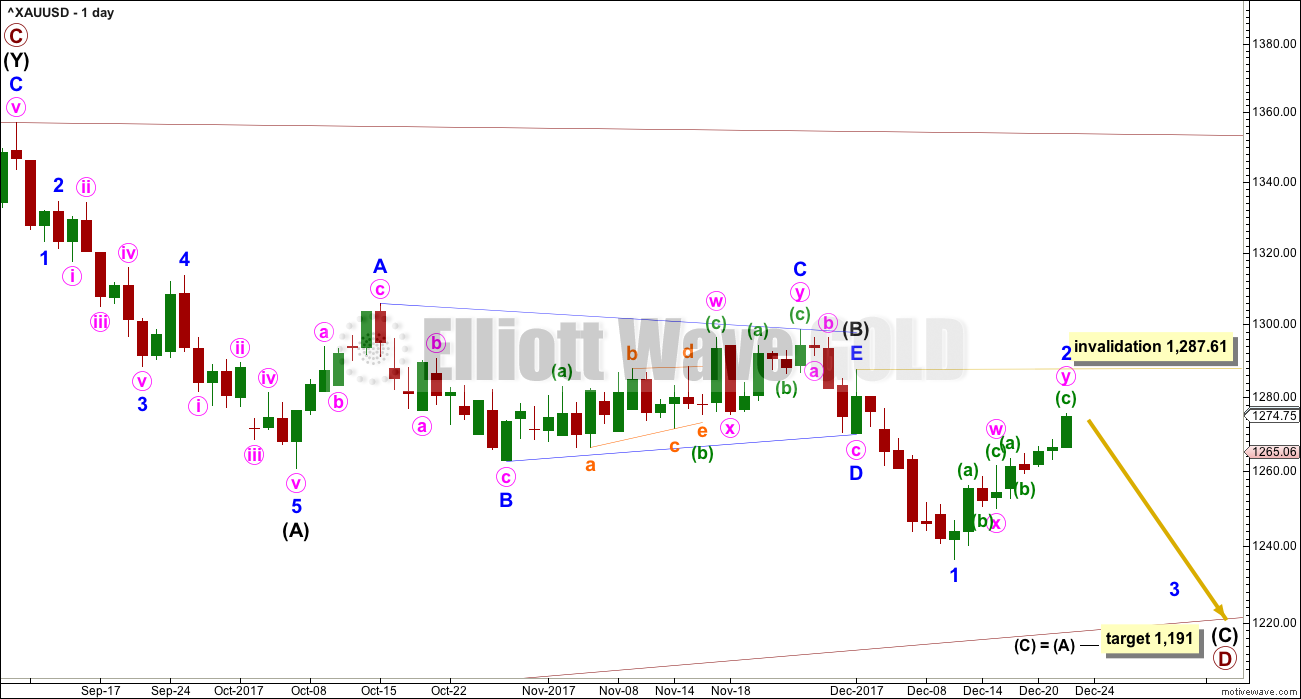
All three daily charts are identical up to the low labelled intermediate wave (A).
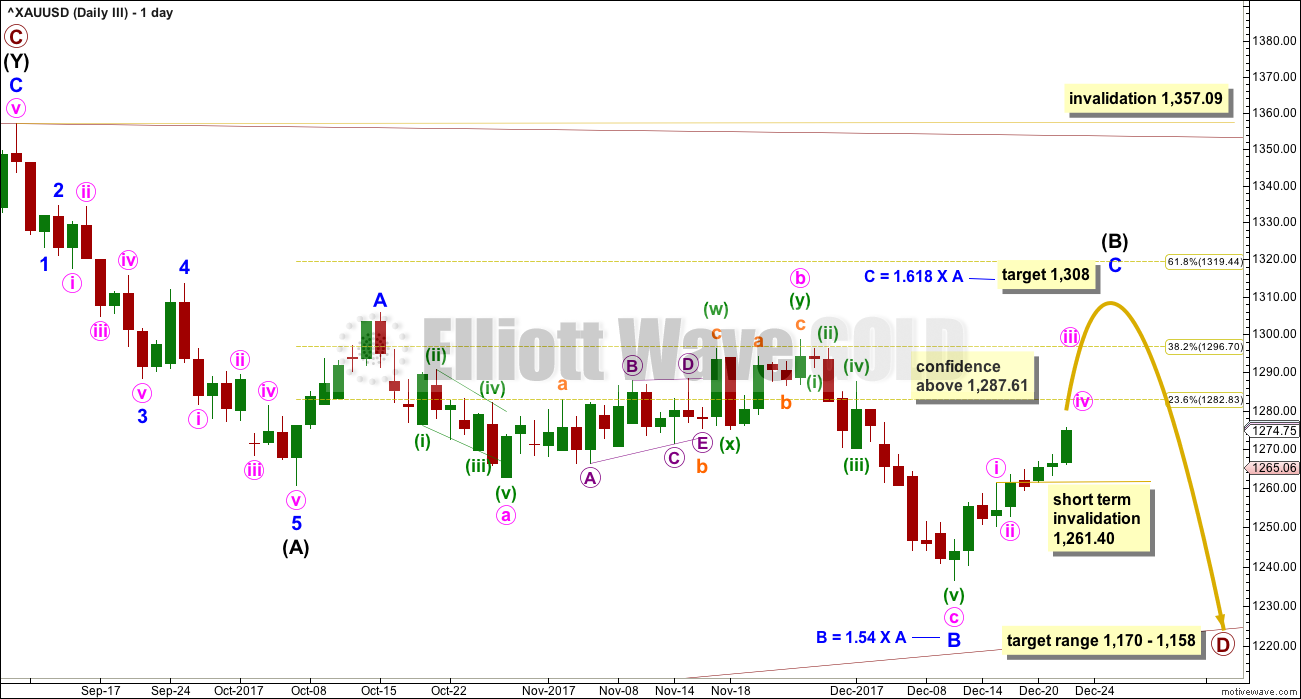
This first daily chart shows intermediate wave (B) as a now complete regular contracting Elliott wave triangle. This has support from what looks like a classic downwards breakout from the symmetrical triangle identified on the technical analysis chart below.
The target assumes that intermediate wave (C) may exhibit the most common Fibonacci ratio to intermediate wave (A).
Intermediate wave (C) must subdivide as a five wave structure. Within intermediate wave (C), minor wave 1 may now be complete.
Minor wave 2 so far has lasted eight days while minor wave 1 lasted seven days. The proportion between them is still acceptable at this stage, and corrections can be more time consuming than impulses.
Intermediate wave (A) lasted twenty sessions. Intermediate wave (C) may be about even in duration as well as length, so twenty or twenty-one sessions looks likely. The next Fibonacci ratio in the sequence would be thirty-four, and it is possible intermediate wave (C) could be this long lasting.
At its end, minor wave 2 may present an opportunity to join the downwards trend in time to catch a third wave down.
HOURLY CHART
Click chart to enlarge.
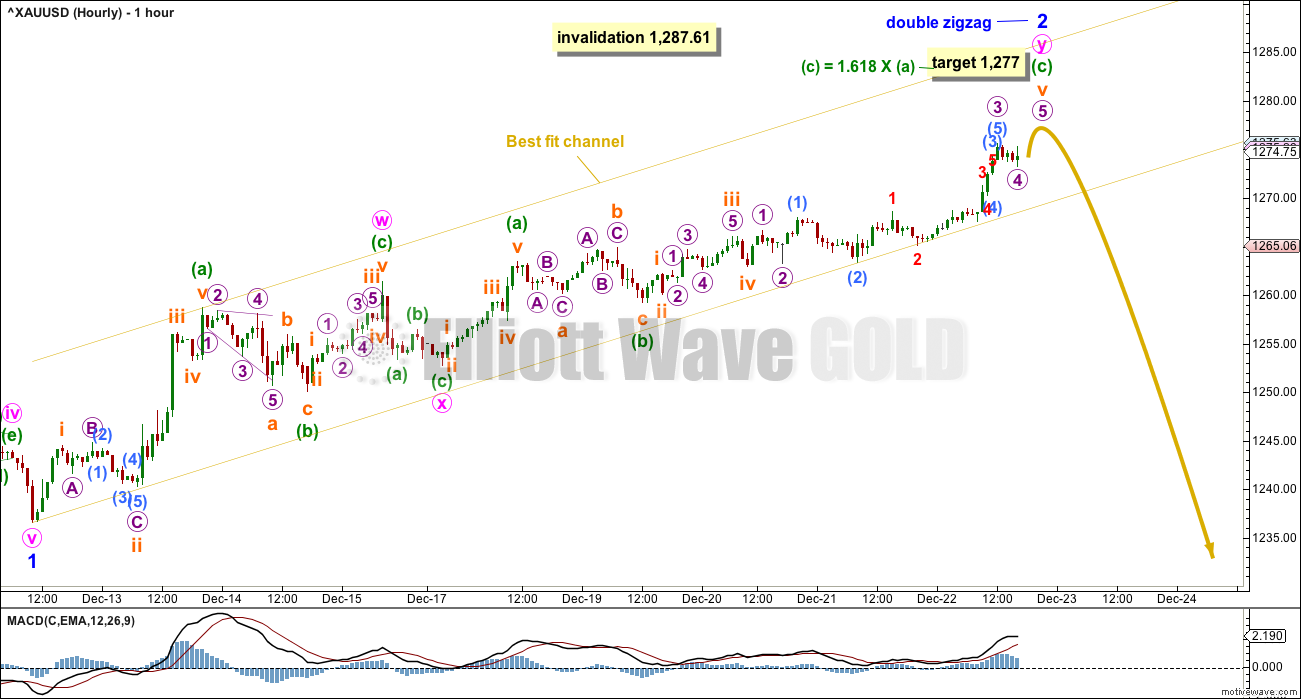
Minor wave 2 so far fits best as a double zigzag structure. These are very common. The second zigzag exists to deepen the correction when the first zigzag does not move price deep enough, and sometimes also when it does not last long enough. Minute wave w ending at only 0.49 of minor wave 1 and lasting only three days fits this description.
Minute wave y is deepening the correction and taking up more time. Minor wave 2 is now 0.77 the depth of minor wave 1. Second wave corrections can be very deep.
The structure of the second zigzag is now incomplete with Friday’s upwards movement. It looks now like it requires at least one final fifth wave up to complete it.
The best fit channel is adjusted to contain all of this upwards trend. When the best fit channel is clearly breached by downwards (not sideways) movement, then it shall provide some confidence that minor wave 2 may be over and minor wave 3 may have begun.
The bottom line is to allow for the possibility that price may continue higher while price remains within the channel. There will be greater risk to any short positions opened while price remains within the channel.
Members with a lower tolerance for risk may choose to wait for confidence in a trend change by a clear breach of the best fit channel.
Minor wave 2 may not move beyond the start of minor wave 1 above 1,287.61.
SECOND DAILY CHART
Click chart to enlarge.
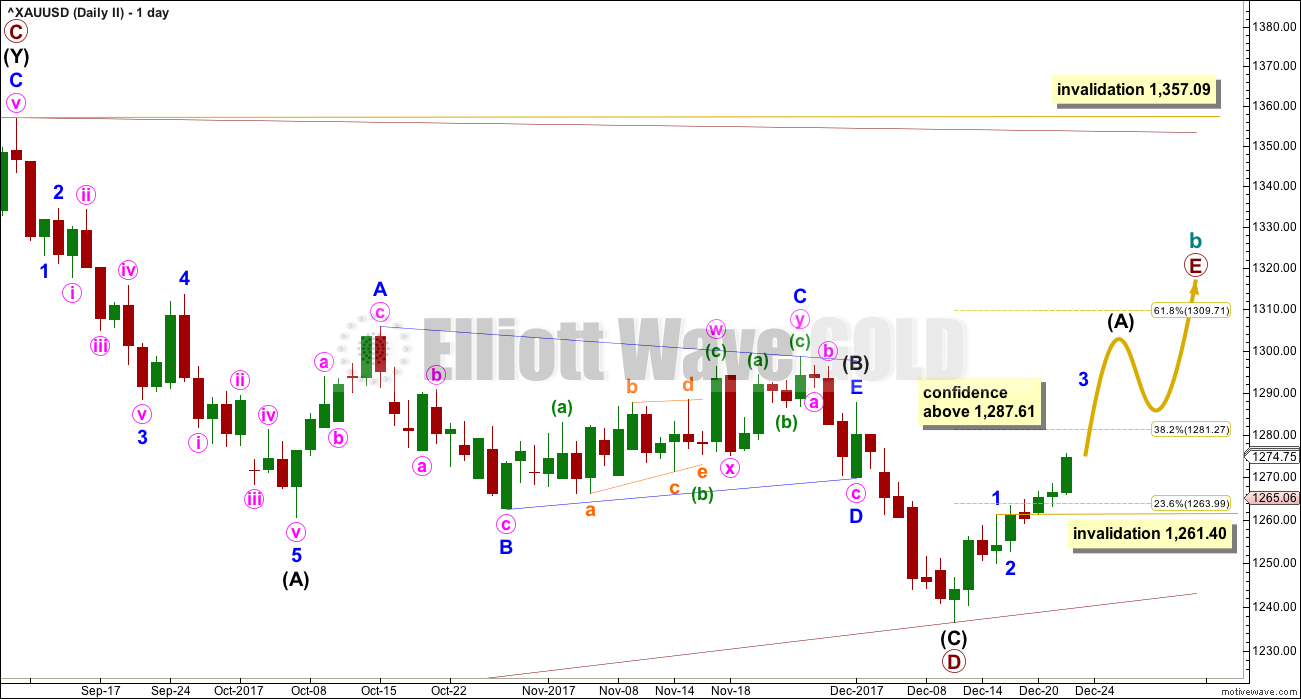
It is possible that primary wave D is over and primary wave E has begun.
The final sub-wave of a triangle should exhibit increasing weakness, and so rising price on declining volume here could make sense considering the larger context of a huge Elliott wave triangle coming to its conclusion.
Some reasonable confidence in this second (and the third) Elliott wave count may be had if price makes a new high above 1,287.61. If that happens, then the target for upwards movement to end would be about 1,310 or a little higher.
Primary wave E, when it is complete, should be a big obvious three wave structure at the daily and also weekly time frames. During that big three wave structure, there would be intermediate wave (B) which may take a few weeks to unfold and most likely be a choppy overlapping consolidation.
Primary wave E would most likely subdivide as a zigzag. Within the zigzag, intermediate wave (A) would be incomplete. Within intermediate wave (A), minor wave 4 may not move into minor wave 1 price territory below 1,261.40.
Primary wave E may not move beyond the end of primary wave C above 1,357.09.
When the huge triangle for cycle wave b could be seen as complete, then a fast and strong downwards breakout should be expected for the start of cycle wave c to new lows.
THIRD DAILY CHART
Click chart to enlarge.
It is still possible that intermediate wave (B) may be completing as a flat correction.
Within the flat correction, both minor waves A and B are threes. Minor wave B has retraced more than the minimum 0.9 length of minor wave A.
With minor wave B a 1.54 length to minor wave A, an expanded flat is indicated. Minor wave C of an expanded flat would most commonly be about 1.618 the length of minor wave A.
Now minor wave C may be required to move price upwards to end at least above the end of minor wave A at 1,305.72 to avoid a truncation.
A new high above 1,287.61 is required now for confidence in this wave count. If the upwards wave does not reach up to 1,287.61, then this third wave count will be discarded.
This third wave count expects the same direction next as the second wave count but not the same structure. For this third wave count, minor wave C may be only either an impulse or ending diagonal, and at this stage an impulse looks like it could be possible. Within the impulse of minor wave C, minute wave iv may not move into minute wave i price territory below 1,261.40.
ALTERNATE ELLIOTT WAVE COUNT
WEEKLY CHART
Click chart to enlarge.
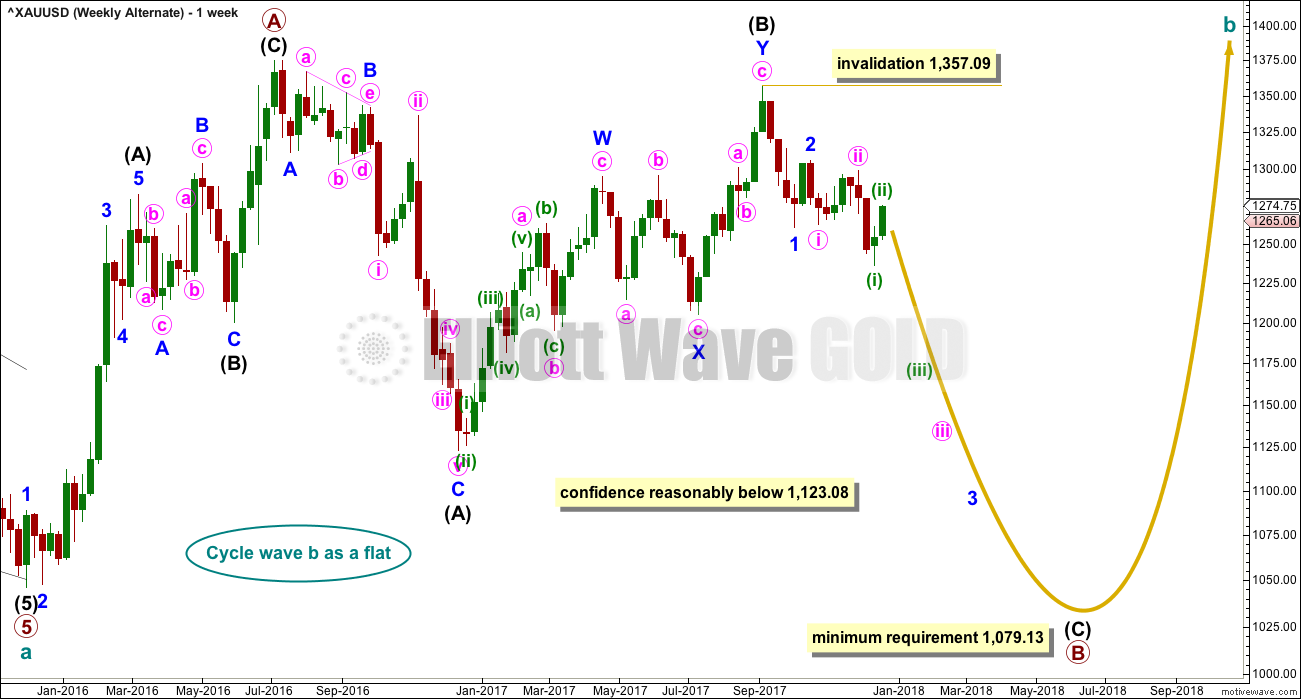
All wave counts are identical to the low labelled cycle wave a. Thereafter, they look at different possible structures for cycle wave b.
Cycle wave b may be a flat correction. Within a flat primary, wave B must retrace a minimum 0.9 length of primary wave A at 1,079.13 or below.
TECHNICAL ANALYSIS
WEEKLY CHART
Click chart to enlarge. Chart courtesy of StockCharts.com.
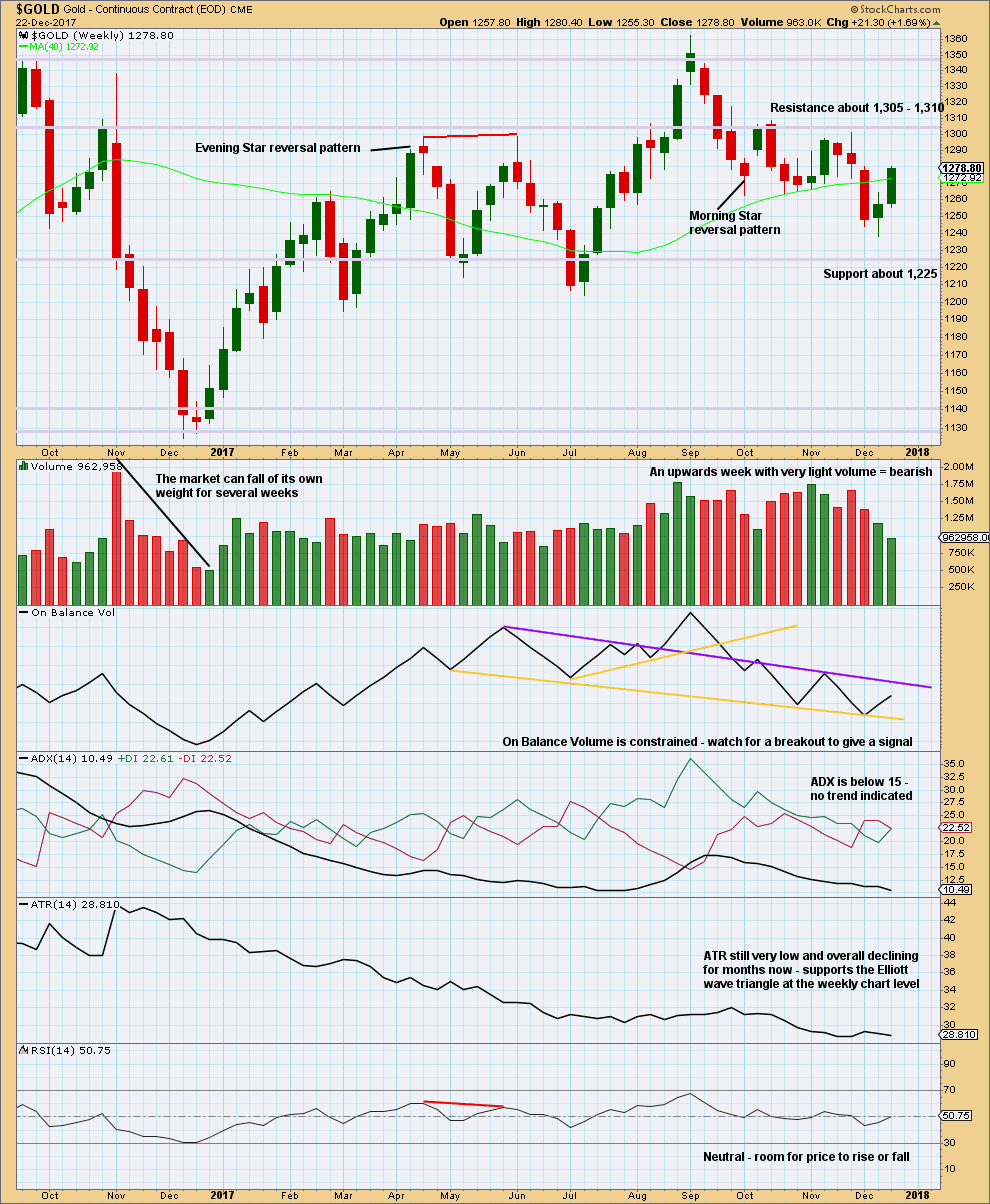
Volume does not support the rise in price this week. This is bearish.
ADX is declining and the directional lines are whipsawing. There is no clear trend at this time frame.
ATR has been declining all year. This strongly supports a huge Elliott wave triangle at the weekly chart level.
DAILY CHART
Click chart to enlarge. Chart courtesy of StockCharts.com.
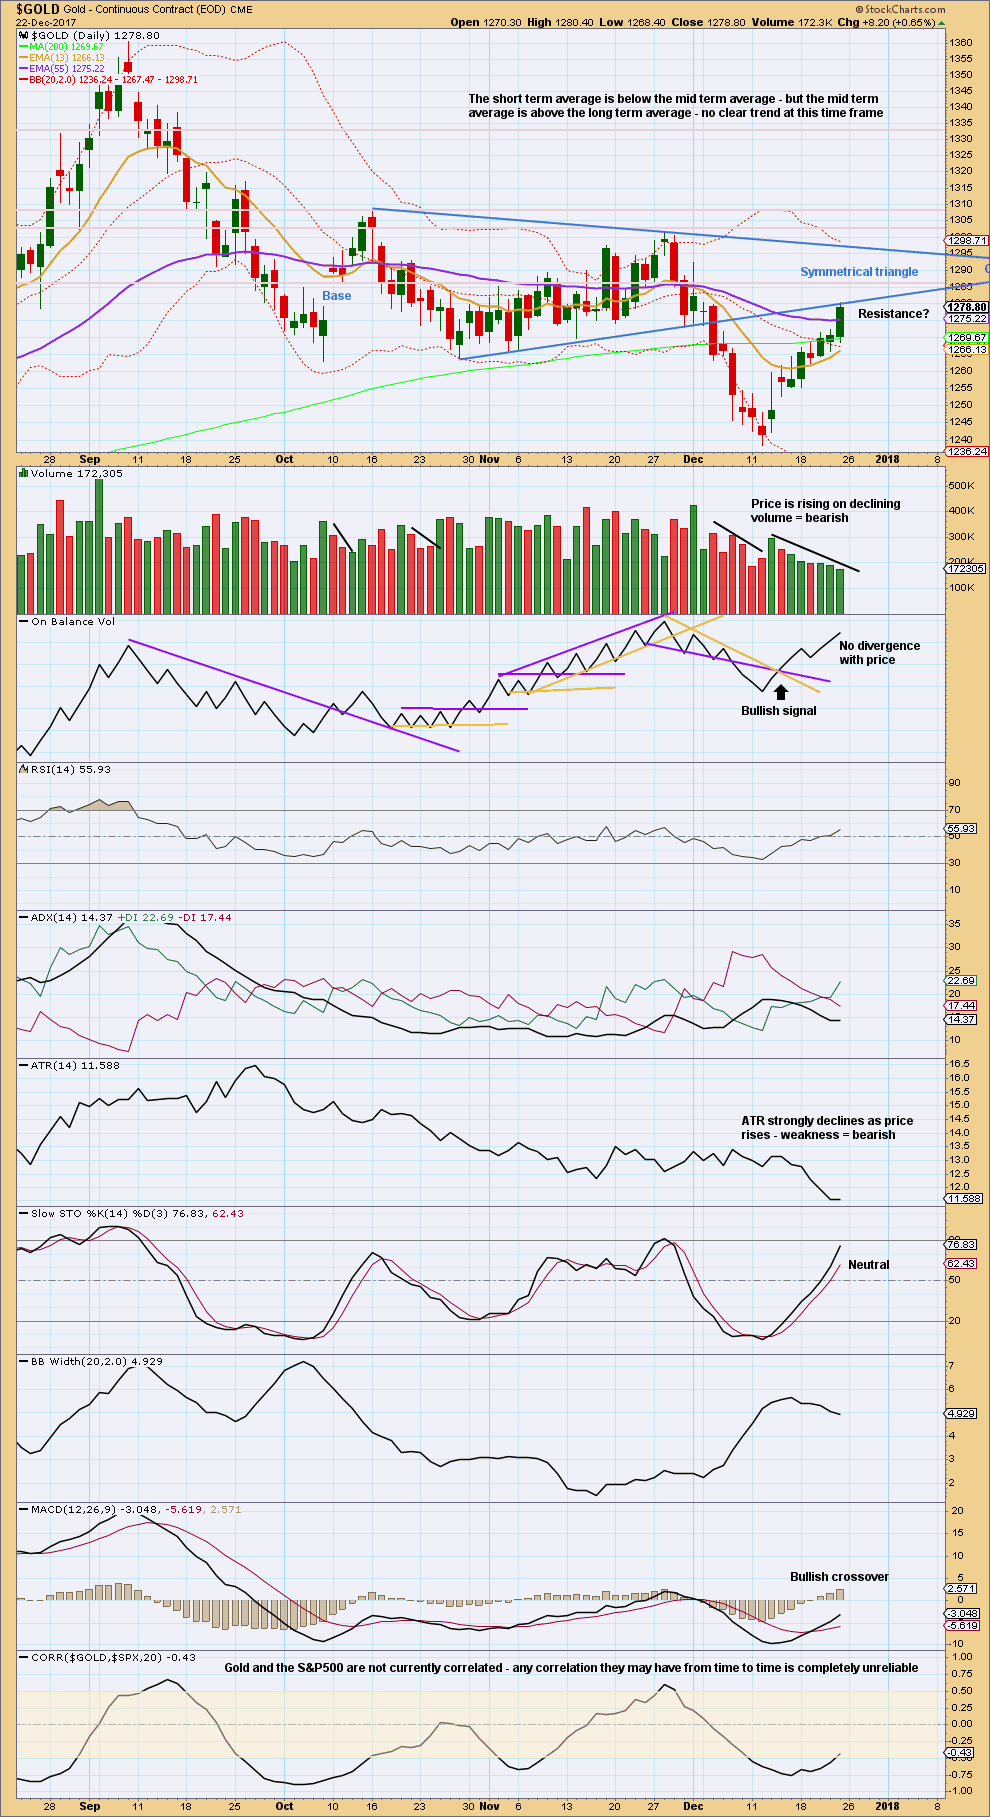
While a throwback to the lower trend line of the symmetrical triangle was unlikely, it does occur 37% of the time. And that is the problem with low probability outcomes. They are never what was expected because they are less likely. But they do occur.
The last low forms a V bottom. Looking at volume in particular, this upwards movement still looks to be very weak although price has been rising now for eight days in a row.
The last bullish signal from On Balance Volume was not a strong one as the trend lines broken both had reasonable slopes, were not long held and had only been tested three times. But it was still a bullish signal, and is the only indication that a major low may now be in place.
There was no bullish divergence with price and RSI or Stochastics at the low, and neither were oversold.
In the first instance, expect resistance here at the lower triangle trend line. If price breaks through here, then the possibility of a more sustained upwards trend would substantially increase.
Let us look at the last two major lows in December 2016 and December 2015 to see if there are similarities to today:
DAILY CHART – DECEMBER 2016
Click chart to enlarge. Chart courtesy of StockCharts.com.
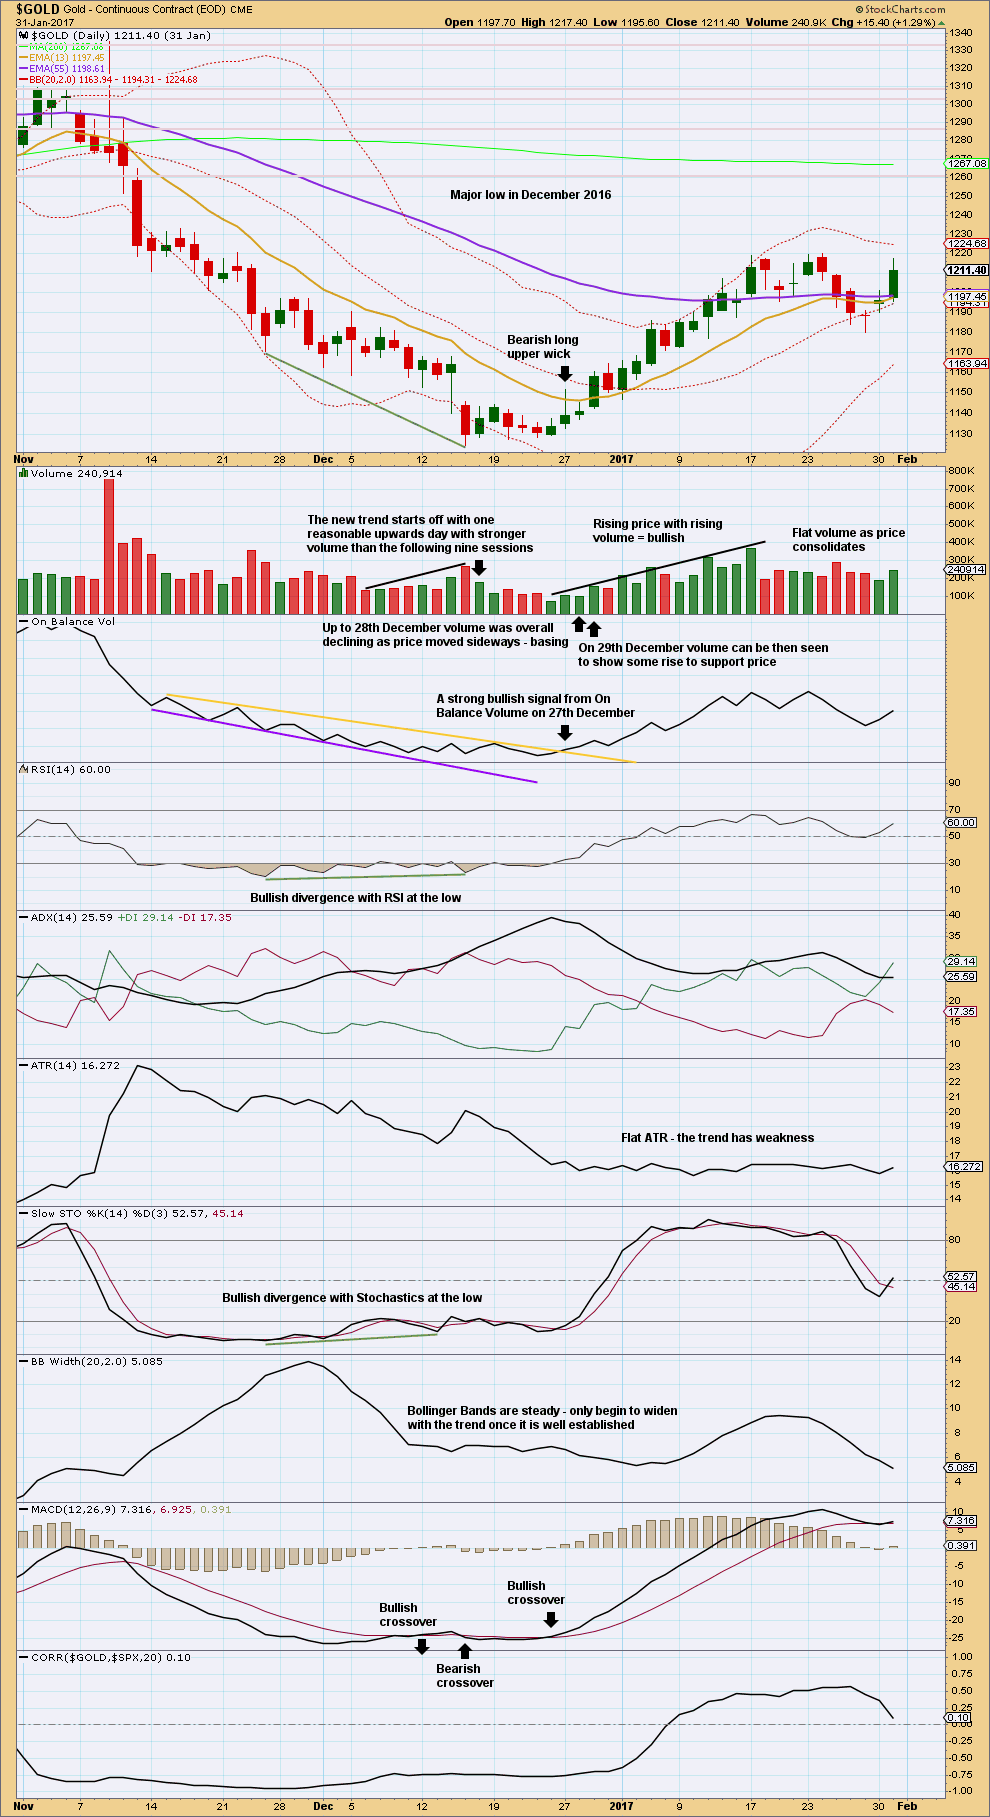
The last major December 2016 low began with a slow start to the upwards trend. There was no bullish candlestick reversal pattern at the low, and up to the 28th of December price essentially moved sideways while volume declined. This was typical basing action, and not the same as today, which is a V bottom.
The only signal that something big may have been about to happen to the upside would have been the bullish signal from On Balance Volume on the 27th of December. The trend line which was breached there had been long held, was tested at least four times, and it did not have too steep a slope. This was a reasonable bullish signal.
By the 29th of December a pattern of rising price with rising volume overall could then be seen. Along with a bullish signal from On Balance Volume, the picture was by then reasonably bullish.
ATR declined for a reasonable time during the start of that trend.
There was at the low clear and strong bullish divergence between price and RSI and Stochastics, and both had been oversold.
DAILY CHART – DECEMBER 2015
Click chart to enlarge. Chart courtesy of StockCharts.com.
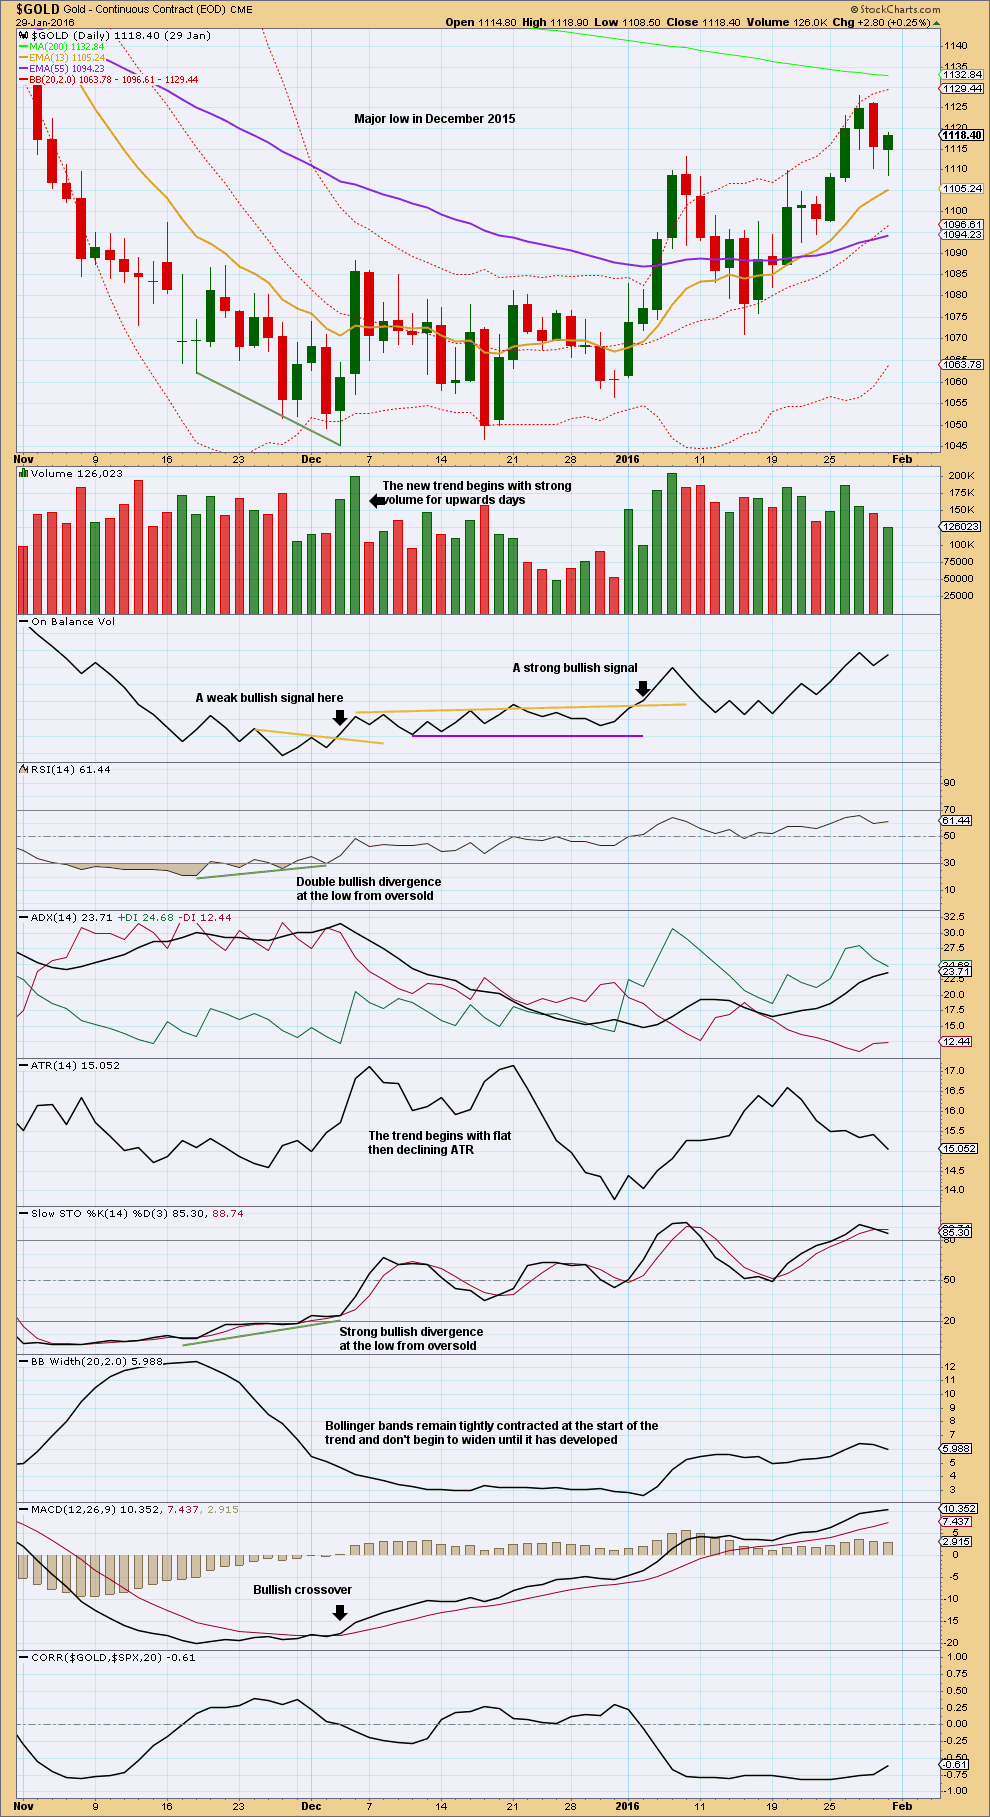
December 2015 was a very major low. This too looks quite different to the current situation.
The start of the first two days of upwards movement had strong support from volume. The next 18 sessions essentially moved price sideways.
There was at the low clear and strong multiple divergence between price and RSI and Stochastics, both of which had been oversold.
On the 4th of January, On Balance Volume gave a strong bullish signal. The signal was strong because the trend line breached had been long held, was close to horizontal, and it had been tested at least five times. The next day, the 5th of January, saw price break out of a trading range to move above resistance and do so with strong volume.
Price essentially moved sideways from the low to the breakout; again, typical basing action and very different from today’s V bottom.
GDX DAILY CHART
Click chart to enlarge. Chart courtesy of StockCharts.com.
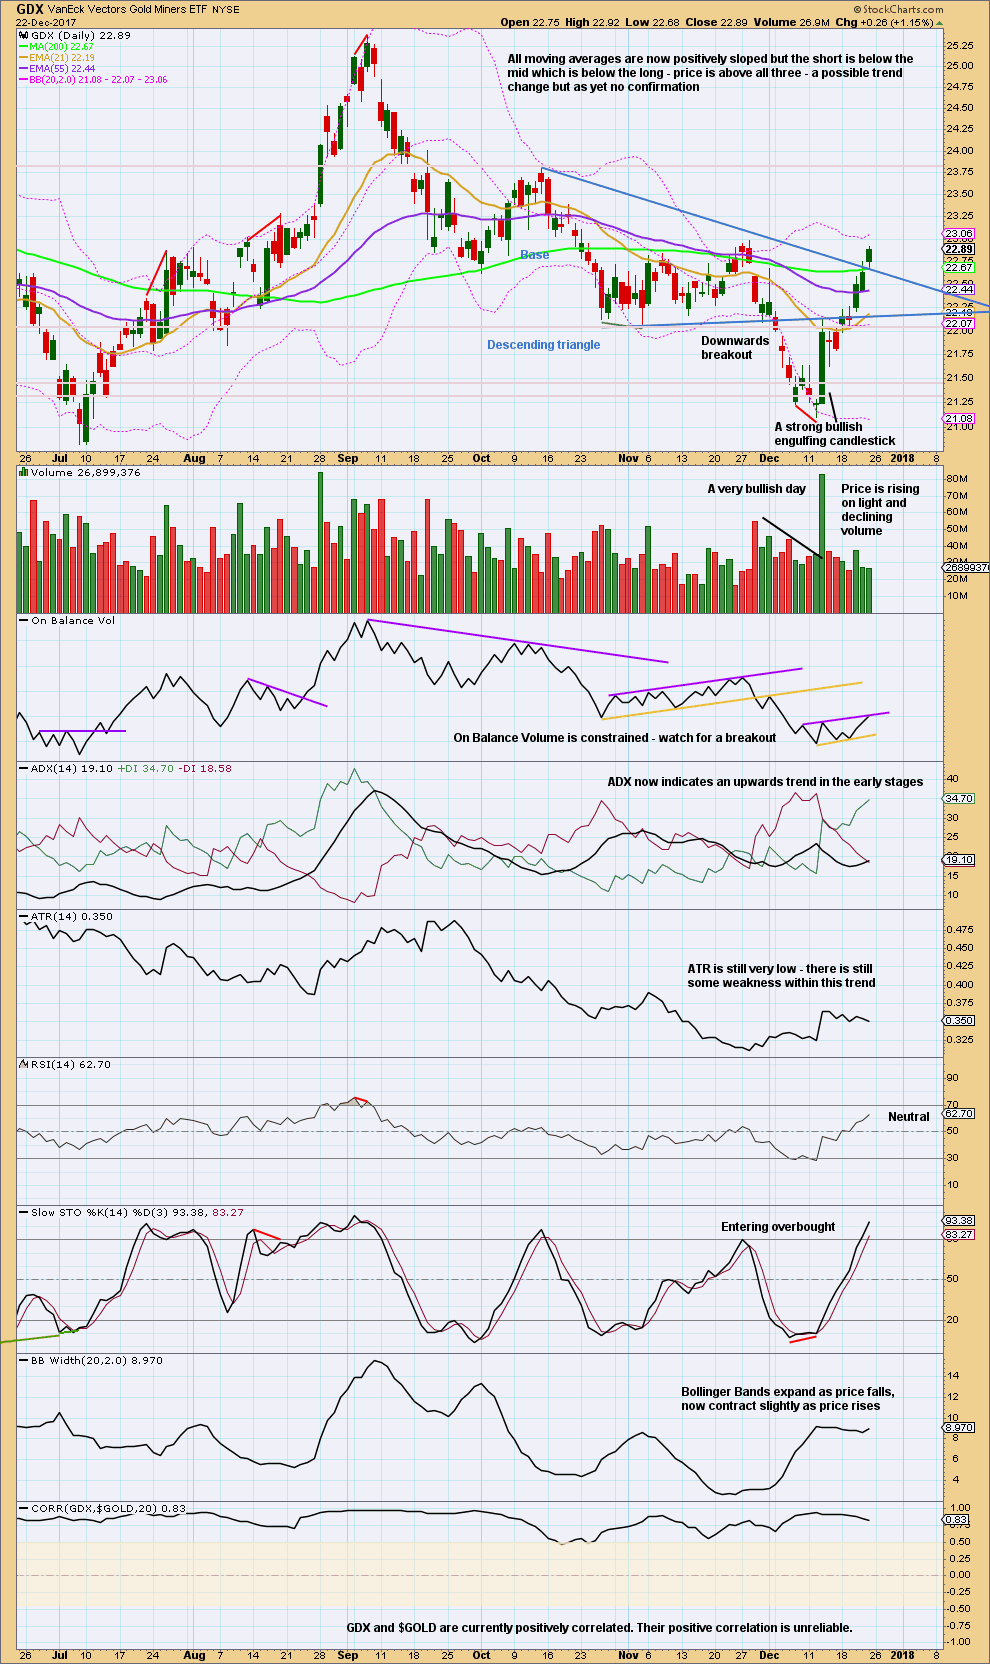
Price has broken through resistance.
Have some confidence in a bullish trend if On Balance Volume gives a bullish signal. Look then for a pullback down to support, which may be at the triangle trend lines now.
With Stochastics entering overbought, a pullback may come soon.
Published @ 10:25 p.m. EST.
Welcome back Lara, hope you had a wonderful time and started 2018 well
..good to have you back
Welcome back Lara from your well deserved Holidays! Hope it was a good one. Your sane analysis was sorely missed in the midst of a lot of “irrational exuberance” all over the internet expecting Gold to reach to the skies!!!
I have an EW question, please! Couldn’t wait for your return 😀
When a move fits a triangle quite perfectly in all aspects especially with a clear 1-2-3 so far and this is the 4th wave correction. The pattern already has a W-X-Y as a sideways combo for it’s C wave. However, the last wave would not fit in except as a clear double zigzag W-X-Y. In other words, is it okay to have 3 single zigzags, one sideways combination and one multiple zigzag.
Thank you kindly.
Hi David.
The short answer to your question is no. There may only be one complicated multiple wave within a triangle.
Thank you Lara.
Analysis resumes today after NY is closed and after StockCharts have finalised their data for the session. That usually happens about 6:30pm EST.
Updated daily chart:
This is still the preferred wave count, a huge triangle almost complete at cycle degree.
E waves most commonly fall reasonably short of the A-C trend line. If they don’t end there, then the next likely look (less common) is for wave E to slightly overshoot the A-C trend line.
Primary wave E when it is done would most likely look like an obvious three wave movement at the daily and weekly chart level. It does not have to, but that would give the wave count the most typical look.
Updated 2 hourly chart to show all of intermediate wave (A).
Bottom line: while price remains within the yellow best fit channel assume it can keep going up.
Intermediate (B) would be indicated when price breaks below the lower edge of the channel. At that stage we should expect either a shallow sideways consolidation, or a sharper pullback. The Fibonacci ratios would be targets, favouring neither the 0.236, 0.382 nor 0.618. B waves are unpredictable corrections.
Hiii Lara
We Are Waiting for Gold Analysis.
Regards
Venu
Analysis will resume after the close for Monday’s session tomorrow.
Ok Lara
Thank you
a pullback is expecting for Gold price; a break below 1314 should set the cat amongst the pigeons for the bulls; possibly time to start going short the rally’s 🙂
Syed. Good call.
The correction has already started. If price manages to drop below 1305.93, then a target of 1290 (38.2% retracement) is in the cards, and it could go down to 1280-1270 levels. I might consider going bullish at those levels.
Hi Alan. Not too sure if the correction has already started; appeared from Fridays price action though (with a break below 1316) that a correction is in the early stages of having started. Anyhow, probably still a game of cat & mouse with daily RSI constantly tagging 70+ and daily ADX almost at 40. Cant see daily RSI sustaining 70+ for an extended period. Weekly stochastic is still overbought/bullish which eased off a little earlier today helping Gold price to gravitate towards 1314. Alas, we did not get a break below 1314 yet. Momemtum appears to have slowed down suggesting a pullback. Let’s see if we get one to test a break below 1311. Upside risk a break above 1325-1326. Gold price is behaving like a candle in the wind, flickering from within lol. Agree, imo a break below 1301 is needed to really turn this around!
https://kimblechartingsolutions.com/2018/01/gold-bulls-gotta-love-pattern-says-joe-friday/
I’m still looking at the possibility that the $USD topped in Jan 2017. This is likely necessary for the bullish gold idea.
Short term, I think the $USD may drop for a few days before a correction for maybe 2 weeks.
If this takes place, gold may be experiencing another 4th wave and may make another new high before a couple week correction starts. Let’s see how this works out.
https://www.tradingview.com/x/HK5J68Vk/
https://kimblechartingsolutions.com/2018/01/junior-miners-gdxj-breaking/
Thank you Dreamer.
Only one more session (tomorrow) then I’ll be back with you after Monday next week.
Thank you all so very much for your continued support, especially as I try to take a holiday at this time. I really do appreciate every single one of you so much, that you continue to remain subscribed and support me here is invaluable.
THANK YOU
Oh yeah, and I hope everybody is having the best start to the new year possible 🙂
Classic TA is still looking very bullish, but Stochastics is now overbought. This may initiate a small pullback or consolidation here then there would be room for new highs.
It’s very interesting that this trend began slowly with weakness. On BarChart data the first green candlestick was stronger, but with StockChart data it looks weaker as a… spinning top? That real body is real small.
But then after four days of weakness it began to really take off.
Updated preferred EW count daily:
A small consolidation possibly for intermediate (B) here. If support about 1,305 – 1,310 remains strong it may be very shallow. If that gives way then look for next support about 1,288 and below that 1,268.
Thank you Lara, for sparing some valuable time during your Holidays. Very kind of you.
But, seriously, enjoy your time off to relax. The markets will still be here next week, unless some madman/men decide to go nuts.
Cheers!
GDX Rounded Bottom / Inverse H&S
Symmetry is looking pretty good
https://www.tradingview.com/x/4d7TX28j/
Dreamer,
Are you bullish now on GDX and GDXJ? Is the current move up, the slingshot move after the final E in your triangle scenario?
Thank you kindly.
The picture is not 100% clear, but sure looks like this could be the start of the 2nd leg up from the early 2016 low. I’ve been trading NatGas lately. I think GDX may be a strong buy after a pullback. Now if we can only get Lara on board with bullish Gold and GDX counts 🤔 Maybe soon….
Thanks you.
Get Lara on board with bullish Gold count? In your dreams, Dreamer !!!!!
Cheers!
Update:
https://www.tradingview.com/x/nt1sJNo8/
Looks like gold may be showing the 1st sign of weakness. Since Dec 12th, the trend has gone up and the angle of ascent has increased. Today for the 1st time, price has broken a trendline. The lower trendline will need to break to truly confirm a B or 2nd wave. A 13/34 bear cross will also signify a move lower.
https://www.tradingview.com/x/isRjrD9G/
Dreamer, wonderful observation.
In my book, this is going to be a 4th wave correction.
Nice call🙂
Aussie Miners appear to be constructive for higher gold prices. Ascending triangle breakout!
Nice to have a different perspective. Looks good!
This is the best I can do to find a resistance line on either gdx or gdxj
Thanks for sharing it, Stuart.
Nice. I like the volume breakout 🤑
Thank you Stuart. Good volume combined with RSI divergence and currently consolidating at the A-C (possible) trend line. The previous capitulation and the move that followed – a repeat now ?
Also thank you for highlighting the pattern in OBV.
Thank you Dreamer for always sharing your thoughts. It is a great help and much appreciated. Very interesting point about angle of ascent.
At cmp 1312+, the technical readings are quite bizarre lol…. with 1310 holding, imo a sustained break above 1314 should seek 1322+. Bravo bulls, probably has everyone baffled 🙂
Syed. Brilliant foresight.
Good day Alan. Doesn’t look like Gold price is not done & dusted with the upside just yet! After a high of 1321+ and drop, appears 1311-1309 is holding. There is no let up yet in weekly stochastic which remains highly bullish indicative of further upside to follow. With an increase in volume, rising ADX etc. Imo a break above 1321 for 1328-1330s looks pretty much to be on the cards unless the upper band and high RSI reading (70+) on the 4hourly/daily can restrict Gold price rise…..? Good luck to everyone making hay lol and let Rumplestiltskin spin it to GOLD 🙂
Syed. I concur with you.
I am trading a wave count that I have constructed; it is very bullish. That wave count considers 1205.41 as the low, and we are on an uptrend ever since. Yesterday’s 1321.08 was a nice third wave, and the current drop is a 4th wave. The 5th wave will culminate in the 1330-1340 region, depending on where the 4th wave stops. I do have two possible lows to this drop: 1294 or 1264.
I have 1450 and 1555 as my next targets. These agree with the postings put up by Dreamer and Tarboush.
Alan, Happy New Year btw. Gold price has certainly begun with a rollicking start for 2018. It has been relentless lol. I won’t be surprised if there is a gap fill in 1340s which Gold price had left behind a month or two ago. After the drop to 1236, the daily HeikinAshi candles have been absolutely fascinating to watch. But how long will this upswing last; surely a correction for below 1287-80 must be in the making somewhere. Will the FOMC minutes later today have any impact? Trade safe everyone & GL.
Cycle analysis supports higher gold prices
https://surfcity.co/2017/12/29/longer-cycles-for-gold-and-the-dollar/
Thx for sharing it, Dreamer. Happy 2018!
I like this chart by “allstarcharts”. It shows the significance of the neckline. An upwards break of gold could correspond with a downwards break of the USD.
Note that USD is inverted in this chart.
An update on this long term gold channel that I have posted previously. Price once again found support at the bottom of the channel. As long as price stays in the channel, the bull case should be given considerable weight. A move above the inverted H&S neckline around 1,350 would be very bullish.
https://www.tradingview.com/x/VBDpcFQp/
May 2018 be prosperous for all.
HAPPY NEW YEAR!
I would like to read comments on my charts
Looks good. Could be a rounded bottom / inverted H&S forming
For the very bullish case
https://www.seeitmarket.com/gold-bulls-hope-chart-pattern-leads-big-rally-17625/
Lara, a very big thank you for taking time off from your holiday rest to provide some direction for gold’s continued movement.
For the past couple of weeks, I had been merrily riding the bull. Since the status quo had not changed, I did not post anything. Now that I expect the uptrend to be temporarily halted, I’ll be switching to shorts in the coming weeks. It would be wonderful to touch base and discuss with you all.
I append a graphic that looks at gold’s future movement through Ichimoku and also Wolfe Waves. First off, I can’t seem to annotate the graph. The 5 waves of the Wolfe Waves are at respectively 1278.50, the top at 1354 (number blocked by the legend), 1262.80, 1301.30, and a point at or slightly higher than yesterday’s high at 1307.23.
If the Wolfe Wave analysis is done correctly, gold price should now drop or there could be just a slight movement up. This is confirmed in Wolfe analysis by drawing the purple line through 1-4 and intersecting it with the price line. We are now at or very near to that intersection point. Prices have also reached very close to the top red cloud boundary, which is at 1309.30. Since the cloud is red all the way through until February, the chances of respecting the top cloud boundary is rather good. It would take more effort from the bulls to surge past that. However, if prices do rise much more, then of course the Wolfe analysis becomes invalidated.
Moving on, the 2-4 line happens to be also the downtrend line, and so my expectation is for a backtest of that line, as shown by the green dotted arrow. After a successful backtest, prices ought to resume the bullish uptrend. Now, where it ends is going to be interesting. Lara’s Daily II count expects this rise to be the third wave of Primary E, and a huge drop should ensue. The more bullish diehards would take it to be a strong third wave up rising past 1357.09. We’ll just take it one step at a time.
In the meantime, a very Happy New Year to everyone.
That falling wedge breakout and proposed backtest looks good!
Thx for sharing yr analysis, Alan. Wish u a happy new yr!
Thanks Weiquan. And a very happy and prosperous New Year to you.
The strong surge in the gold price in the first two days of the new year has overshot the Wolfe Wave target. Some traders attribute this to Trump’s tweet on Pakistan. So now, unless price retreats very deep, the bears are increasingly pushed to a corner.
https://www.mcoscillator.com/learning_center/weekly_chart/golds_8-year_cycle/
“As we head into early 2018, we have both the 8-year cycle and the 13-1/2 month cycle in their ascending phases. That means both horses are pulling in the same direction, and it should mean good things for gold prices especially in the first half of the year.”
Tom McClellan
The situation after the last two days is looking now fully bullish.
But ATR is still very low.
Intermediate (A) may now be about the 0.618 Fibonacci ratio.
Hourly chart update for new preferred wave count:
Bottom line: while price remains within the best fit yellow channel expect price to keep going up.
This upwards trend may not yet be done, but it looks like it is losing strength. MACD shows persistent divergence. Stochastics is overbought. There is not yet enough weakness to indicate a change, and as yet no trend channel breach and so no trend change yet indicated.
When price breaks below the lower edge of this channel then draw a Fibonacci retracement along the length. Use the 0.382 and 0.618 Fibonacci ratios as targets for a pullback, favouring neither.
Thanks for update
Happy new year
You’re welcome.
And happy New Year to you too, and all EWG members 🙂
Classic TA: Price is now above the lower edge of the triangle. Look now for resistance at the upper edge of the symmetrical triangle.
There is also very strong resistance ahead at 1,305 – 1,310. If price keeps going up from there it would be extremely likely to see a downwards reaction about that range.
This is now the preferred wave count. Price may now be in the very last wave of a huge triangle that began at the low of December 2015.
Primary wave E needs to be an obvious three wave structure at the weekly chart level. And so within it intermediate wave (B) needs to last at least a week, and may most likely be much longer than that.
Intermediate wave (A) may be over at todays high, or it may move a little higher. A small volume spike today on overall declining volume with rising price looks like a small scale blowoff top… possibly.
GLD printing a doji at upper B band so at least a temporary pullback likely at hand. Buying back GLD 121 puts. Selling 122/122 Jan 19 bear call spread.
With Gold price so overheated at around 1292+, a price dump should be huge lol. Question is will Gold price first drive through 1296 for 1304 before a fall and will Gold price be able to drop below 1279-1278 when it does fall? No let up yet by the bulls!
Happy holidays. I believe gold has penetrated $1287.61 if my data is correct. My friends showed me some analysis from other bloggers in U.S. here, but I am still looking forward to reading Lara’s interpretations… Rest well and happy new yr! 🙂
We can work on day 2 and 3
MERRY CHRISTMAS AND A HAPPY NEW YEAR, ALL.
And to you too David 🙂
I’m livin’ in the future down here, it’s already Christmas!
Thank you Lara.
Since you live in the future, could you take a peep and tell us what Gold is doing there now (your now and our future !!!). 😀
No, take your well deserved time off. Relax, do all the surfing and other sea-wave-fun stuff, so that when you come back to the grind of the market, you are fully charged.
Thank you kindly for being the best EW teacher.