
Further downwards movement should have given all members of Elliott Wave Gold profits today, if trading advice was taken.
A new short term target is given and a new channel is used to indicate when downwards movement may be over.
Summary: The short term target is about 1,236. The longer term classic analysis target is about 1,228. The Elliott wave target for downwards movement to end is at 1,191. The lower Elliott wave target may be met in about four weeks time.
I will leave it up to members to decide on when to take profits, as each trader may have a different preferred time frame for trading. For maximum profits, positions entered prior to the breakout may possibly be held until the target is reached.
The trend for now is down. Bounces are opportunities to enter the trend.
Always trade with stops and invest only 1-5% of equity on any one trade.
New updates to this analysis are in bold.
Last monthly charts for the main wave count are here, another monthly alternate is here, and video is here.
Grand SuperCycle analysis is here.
MAIN ELLIOTT WAVE COUNT
WEEKLY CHART
Click chart to enlarge.
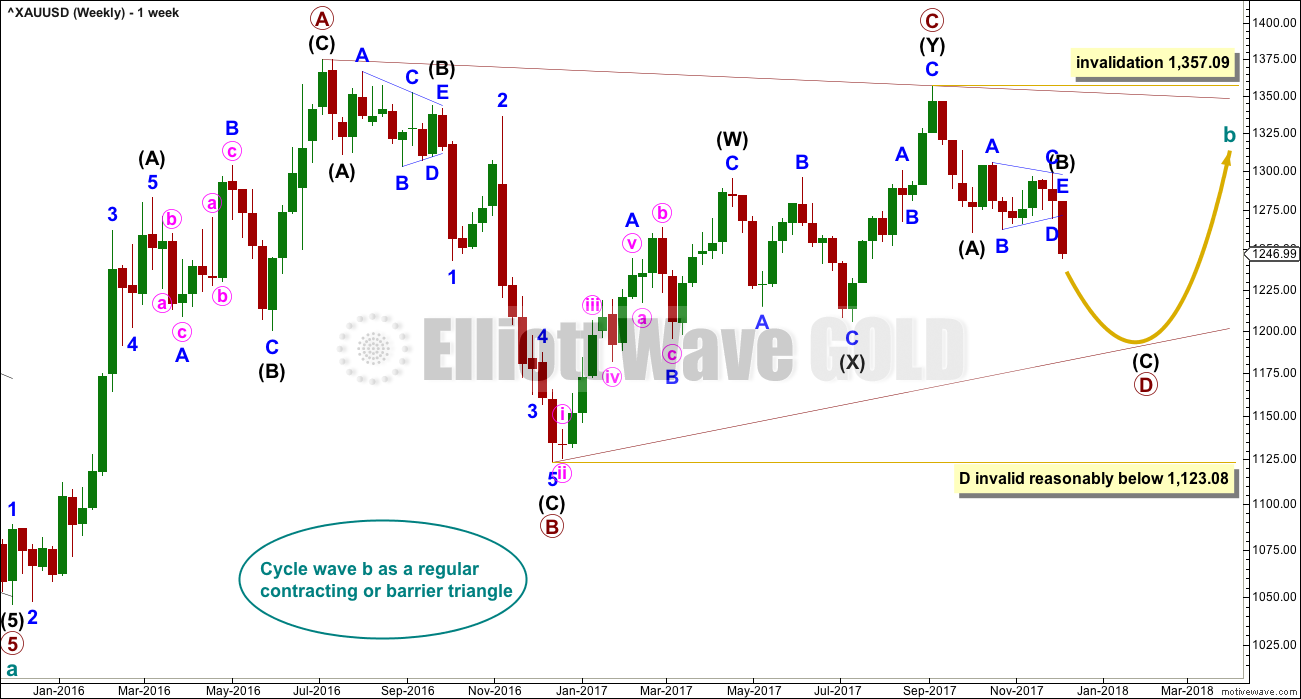
Both wave counts expect that Gold completed a large five down from the all time high in November 2011 to the low of December 2015, which is seen on the left hand side of both weekly charts.
If this analysis is correct, then the five down may not be the completion of the correction. Corrective waves do not subdivide as fives; they subdivide as threes. The five down is seen as cycle wave a within Super Cycle wave (a).
Both wave counts then expect cycle wave b began in December 2015.
There are more than 23 possible corrective structures that B waves may take. It is important to always have multiple wave counts when B waves are expected.
It looks unlikely that cycle wave b may have been over at the high labelled primary wave A. Primary wave A lasted less than one year at only 31 weeks. Cycle waves should last one to several years and B waves tend to be more time consuming than other Elliott waves, so this movement would be too brief for cycle wave b.
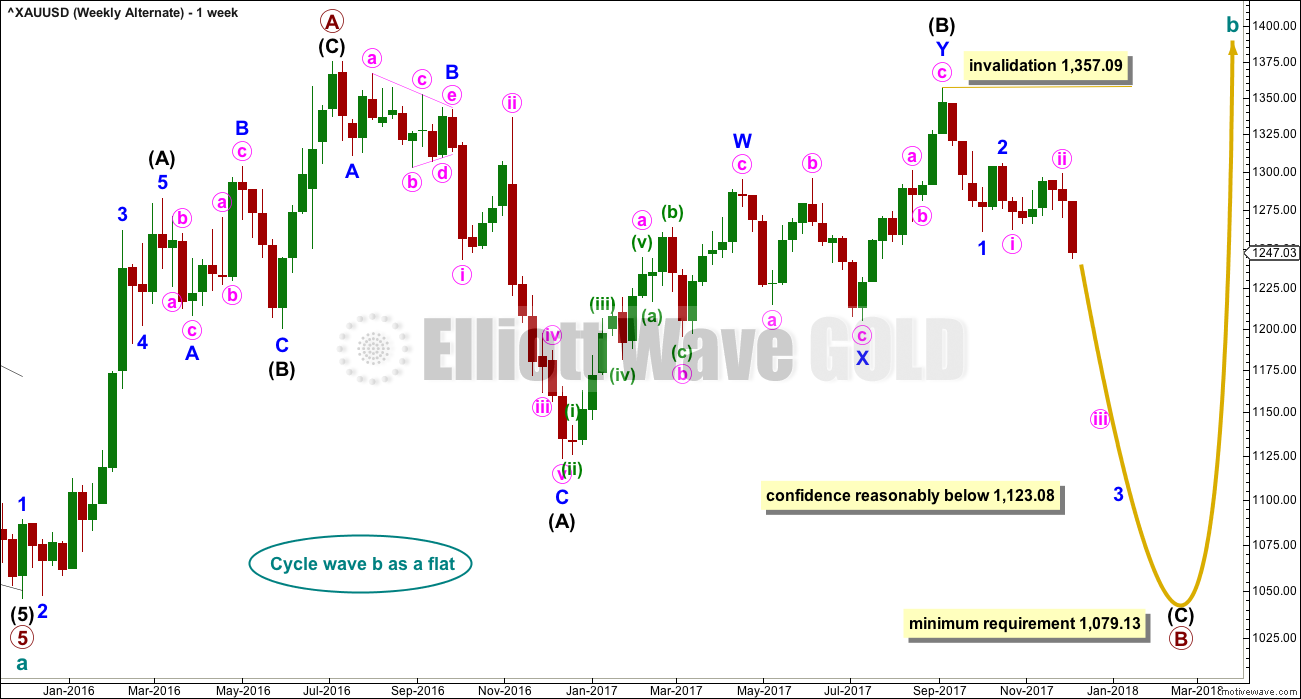
This wave count looks at cycle wave b to be most likely a regular contracting triangle.
The B-D trend line should have a reasonable slope for this triangle to have the right look, because the A-C trend line does not have a strong slope. A barrier triangle has a B-D trend line that is essentially flat; if that happened here, then the triangle trend lines would not converge with a normal look and that looks unlikely.
Primary wave D should be a single zigzag. Only one triangle sub-wave may be a more complicated multiple, and here primary wave C has completed as a double zigzag; this is the most common triangle sub-wave to subdivide as a multiple.
Primary wave D of a contracting triangle may not move beyond the end of primary wave B below 1,123.08.
At its completion, primary wave D should be an obvious three wave structure at the weekly chart level.
For this one weekly chart, two daily charts are presented below. They look at intermediate wave (B) in two different ways, and are presented now in order of probability.
DAILY CHART
Click chart to enlarge.
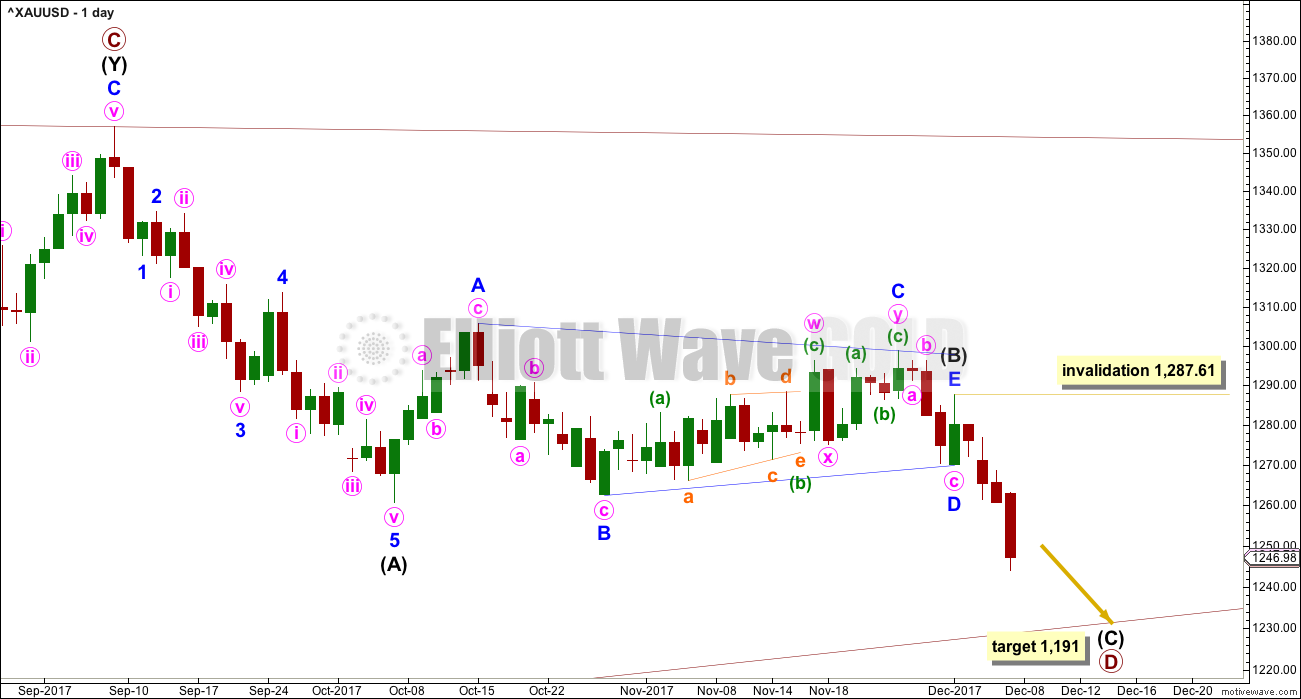
Both daily charts are identical up to the low labelled intermediate wave (A).
This first daily chart shows intermediate wave (B) as a now complete regular contracting Elliott wave triangle. This has support from what looks like a classic downwards breakout from the symmetrical triangle identified on the technical analysis chart below.
The target assumes that intermediate wave (C) may exhibit the most common Fibonacci ratio to intermediate wave (A).
Intermediate wave (C) must subdivide as a five wave structure. Within intermediate wave (C), the second wave correction to come may not move beyond the start of the first wave above 1,287.61.
Intermediate wave (A) lasted twenty sessions. Intermediate wave (C) may be about even in duration as well as length, so twenty or twenty-one sessions looks likely.
HOURLY CHART
Click chart to enlarge.
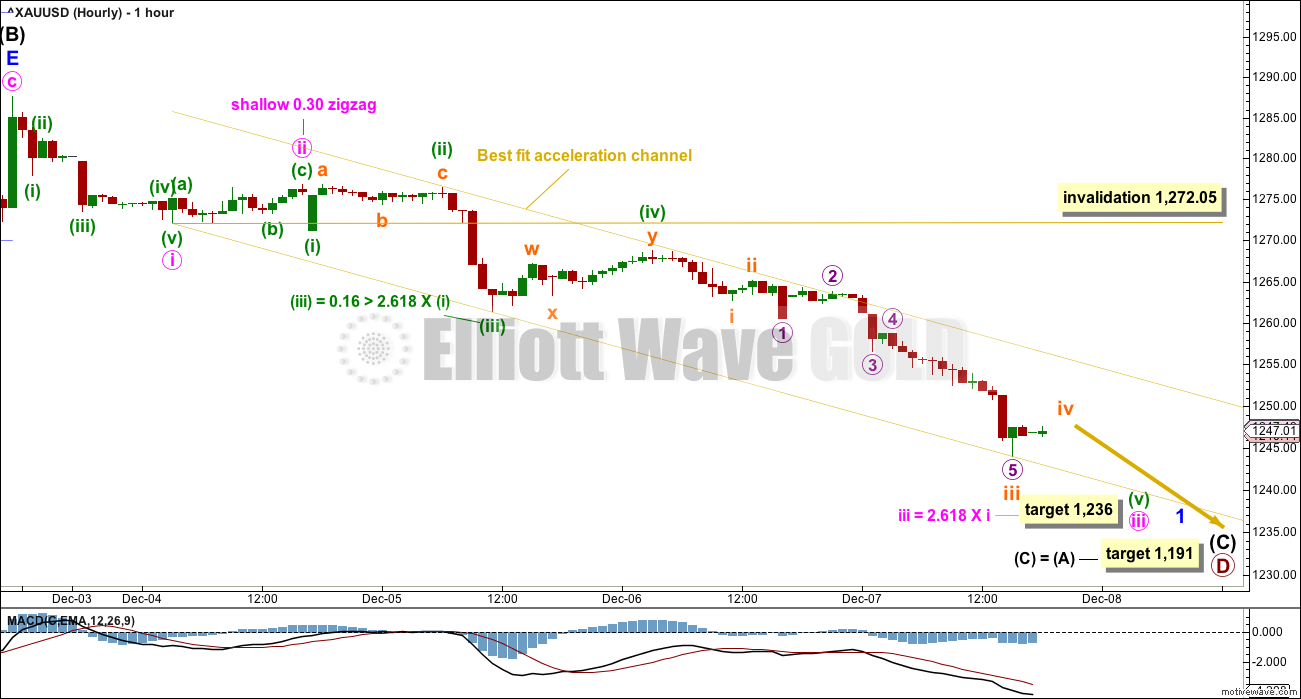
If a new trend at intermediate degree is beginning, then a five down should develop at the daily chart level. That would so far be incomplete and will be labelled here minor wave 1.
Within minor wave 1, minute wave iii is now labelled as an incomplete impulse. Minute wave iii has passed 1.618 the length of minute wave i; the next Fibonacci ratio in the sequence, 2.618, is used to calculate a target for minute wave iii to end.
Minute wave ii lasted only a few hours, so minute wave iv may also be relatively brief. This wave count does not expect to see a reasonable bounce until minor wave 1 is complete.
Minute wave ii was a shallow zigzag. To exhibit alternation minute wave iv may be a more shallow sideways flat, combination or triangle. It may not move into minute wave i price territory above 1,272.05.
When minute wave iv is complete, then minute wave v downwards may unfold to new lows. A target for minute wave v cannot be calculated until minute wave iv is complete and the start of minute wave v is known.
Along the way down, while minor wave 1 is still unfolding, it would be most likely that price may remain within the best fit acceleration channel. Draw this acceleration channel from the end of minute wave i to the latest low, then place a parallel copy higher up to contain all movement. Minute wave iv may find resistance about the upper edge of that channel. Minute wave v may end about the lower edge of the channel.
When price breaks above the upper edge of this channel, it would be an early indication that minor wave 1 may be over and minor wave 2 may have begun.
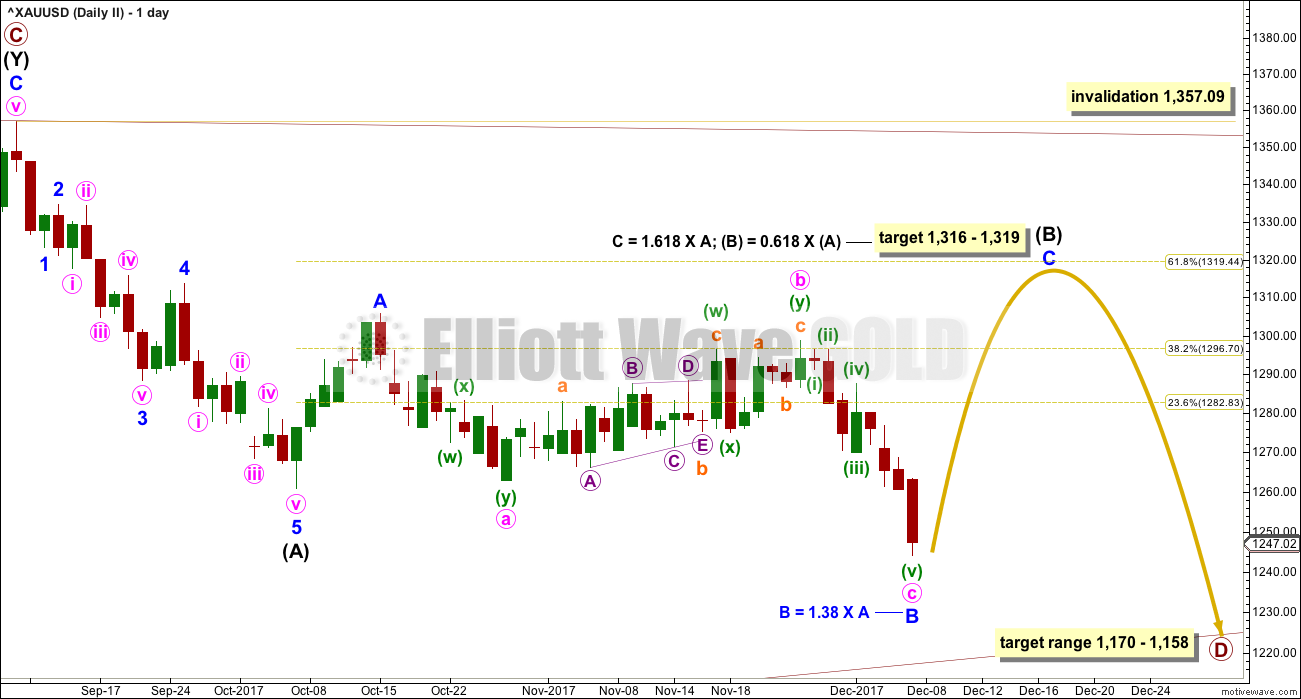
SECOND DAILY CHART
Click chart to enlarge.
It is very important to always consider an alternate when a triangle may be unfolding. Triangles are very tricky structures, and may even be invalidated after one thinks they are complete.
It is still possible that intermediate wave (B) may be completing as a flat correction.
Within the flat correction, both minor waves A and B are threes. Minor wave B has retraced more than the minimum 0.9 length of minor wave A.
With minor wave B now a 1.38 length to minor wave A, an expanded flat is now indicated. Minor wave C of an expanded flat would most commonly be about 1.618 the length of minor wave A.
Now minor wave C may be required to move price upwards to end at least above the end of minor wave A at 1,305.72 to avoid a truncation.
A new high above 1,298.70 is required now for confidence in this wave count.
ALTERNATE ELLIOTT WAVE COUNT
WEEKLY CHART
Click chart to enlarge.
Both wave counts are identical to the low labelled cycle wave a. Thereafter, they look at different possible structures for cycle wave b.
Cycle wave b may be a flat correction. Within a flat primary, wave B must retrace a minimum 0.9 length of primary wave A at 1,079.13 or below.
TECHNICAL ANALYSIS
WEEKLY CHART
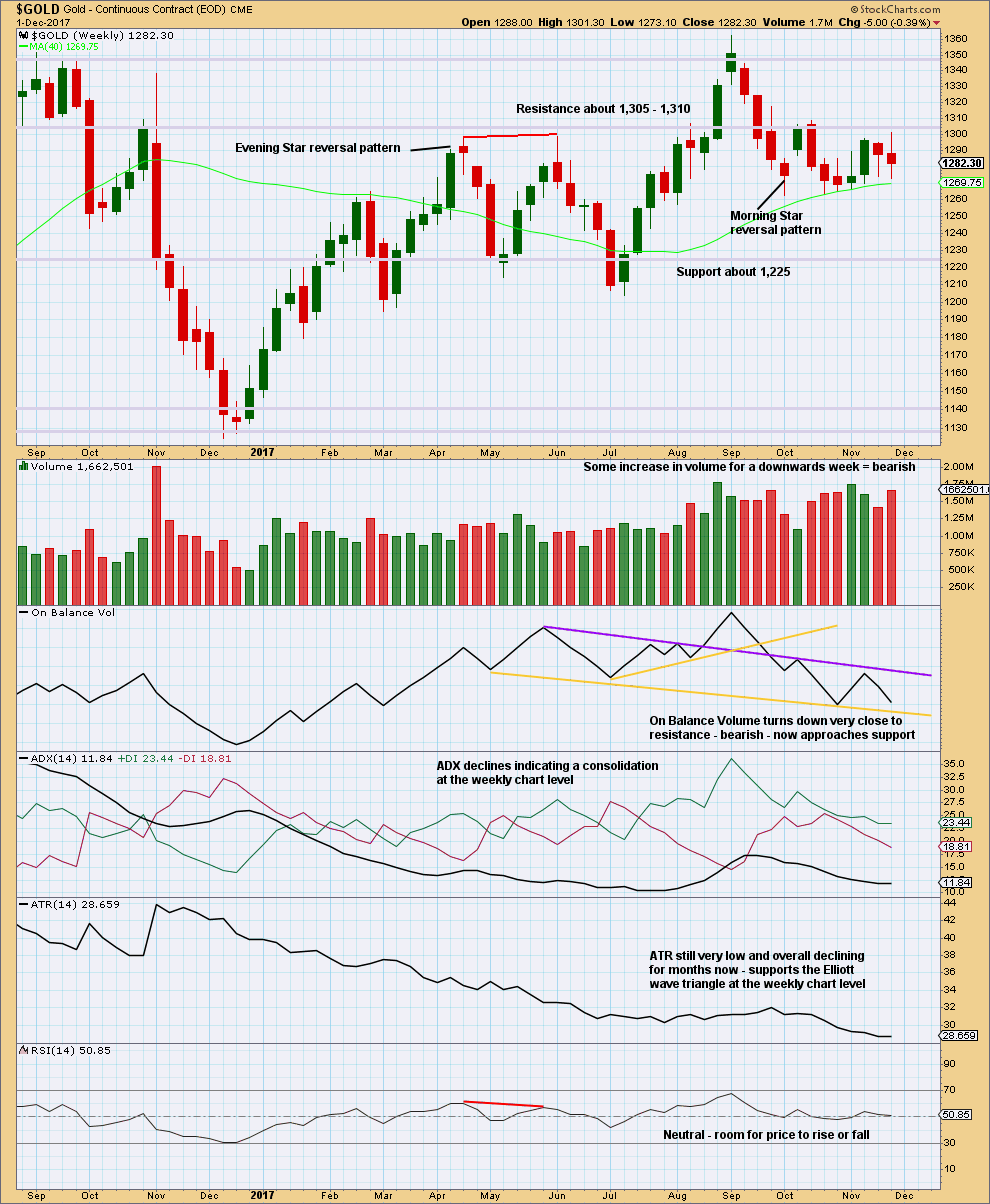
Click chart to enlarge. Chart courtesy of StockCharts.com.
On Balance Volume is still constrained. The last signal given was bearish.
DAILY CHART
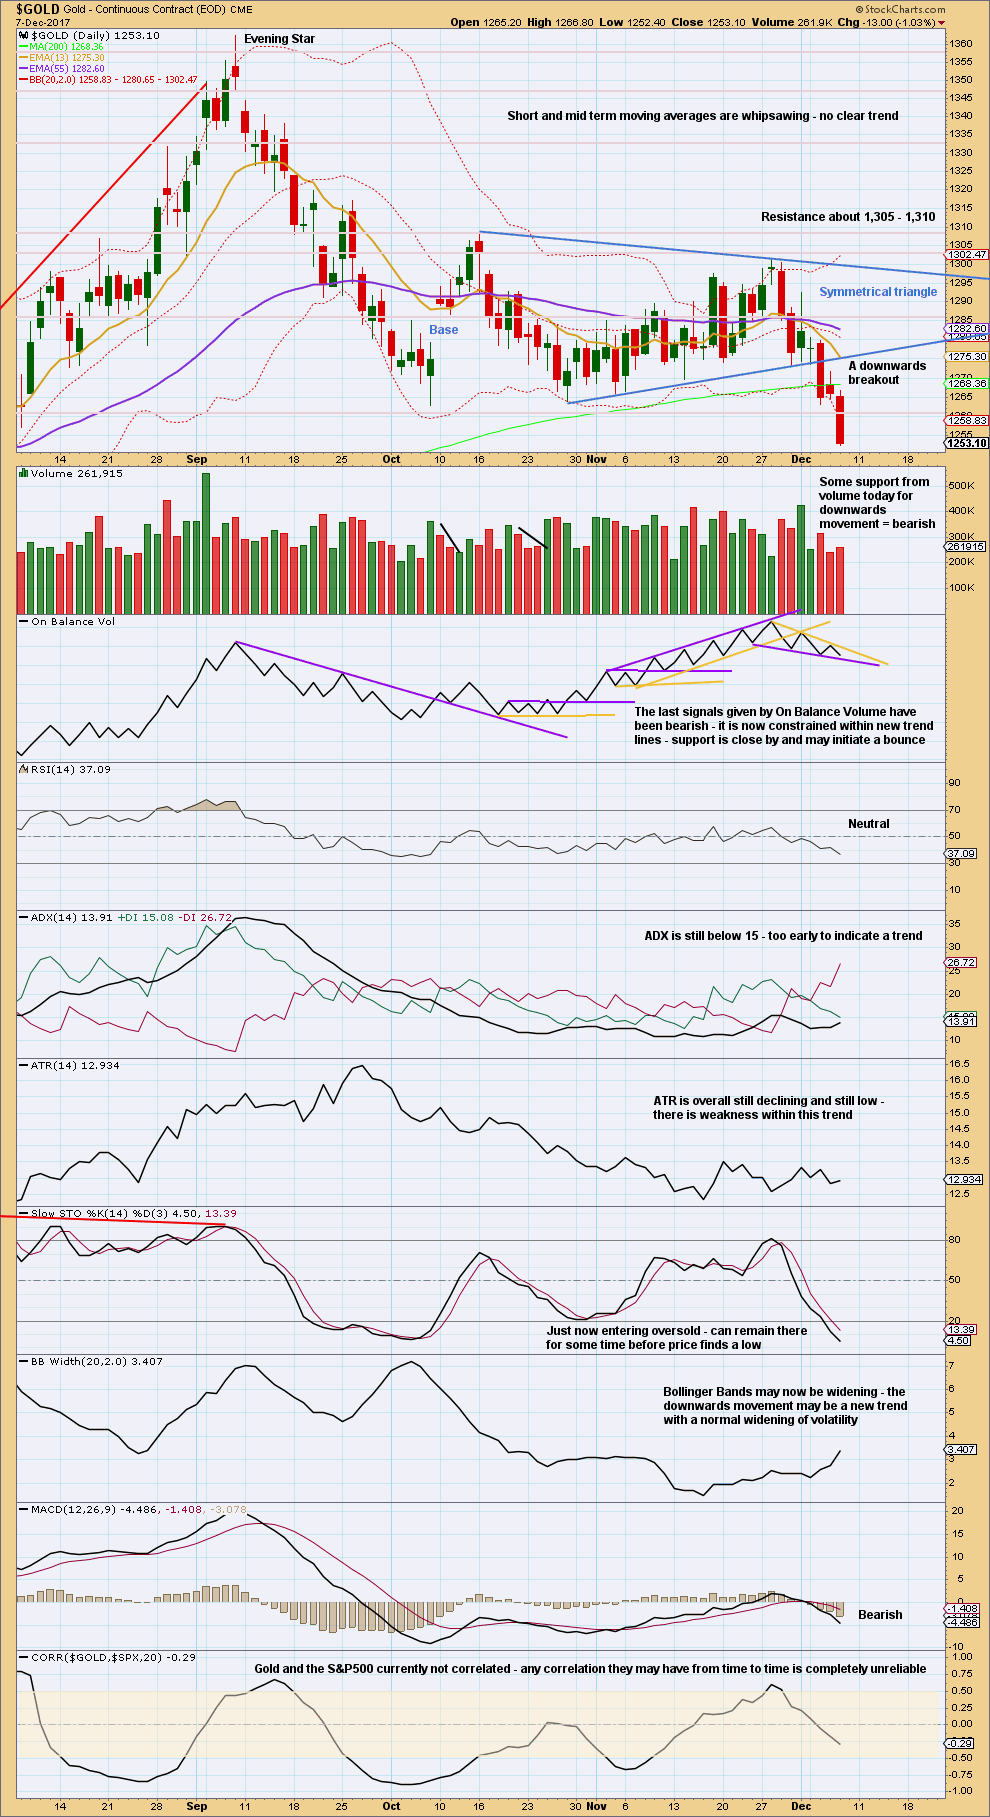
Click chart to enlarge. Chart courtesy of StockCharts.com.
A target calculated using the symmetrical triangle is about 1,228.
Members are warned that a throwback to the lower trend line of the triangle is unlikely.
Candlesticks for the last three sessions all look bearish. Volume is now slightly bearish, and On Balance Volume remains bearish. With RSI not yet oversold and Stochastics only just now entering oversold, there is plenty of room for price to fall here. There is a congestion zone below about 1,226, and strong support below that at 1,214 to 1,204.
Always remember to manage risk as the most important aspect of trading. Always use a stop and invest only 1-5% of equity on any one trade.
GDX DAILY CHART
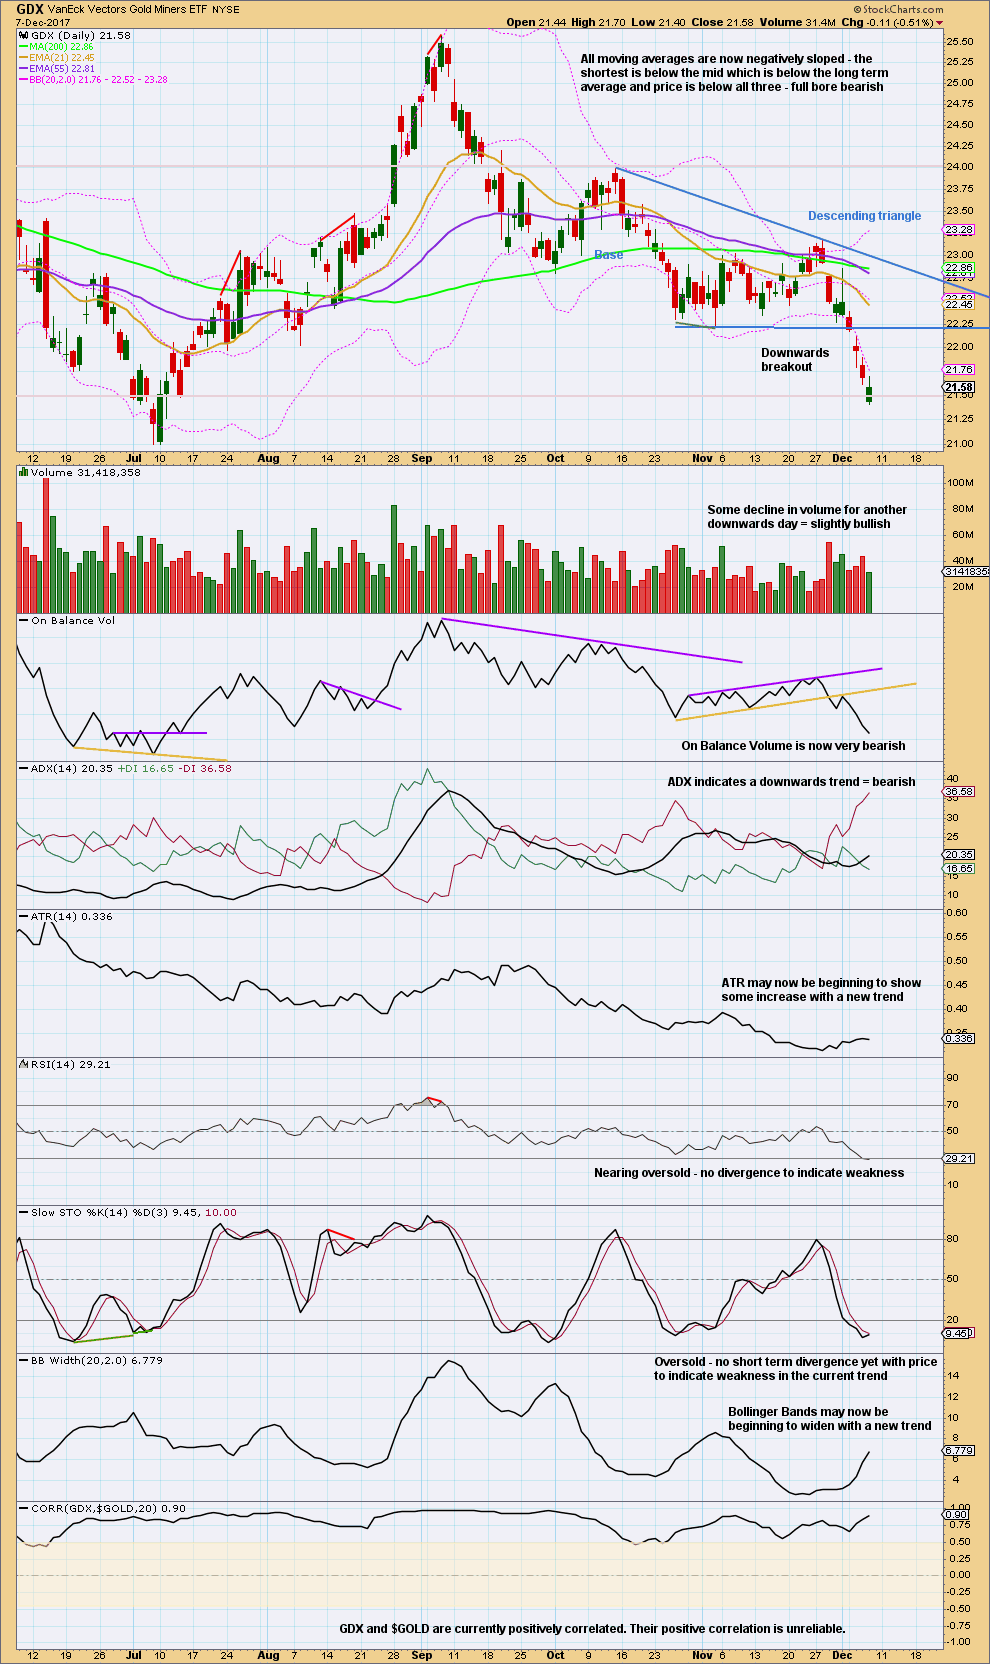
Click chart to enlarge. Chart courtesy of StockCharts.com.
A target calculated from the width of the triangle and applied to the breakout point is at 20.43.
With RSI and Stochastics only just now reaching oversold and neither exhibiting short term divergence with price at lows, there is still room here for price to fall. There is a next area of support about 21.00.
Published @ 08:35 p.m. EST.
Price is at the upper edge of the channel, it perfectly reacted down from there. That was another perfect opportunity to go short.
I’m changing the wave count to see minute iii and iv now over, the proportions look good. While there’s no Fibonacci ratio between minute i and iii with this change, there is a very good Fibonacci ratio between minuette (v) and (iii).
The invalidation point can now be moved down. While minute v is underway no second wave correction may move beyond its start. For short term traders stops can be moved down to this.
But for positions opened prior to 5th December they may still have a higher stop to allow the market room to move. A longer term position may still be held until the target is reached or the structure is complete.