
Sideways movement during Friday’s session has reacted exactly off the upper edge of the channel given on the hourly Elliott wave chart.
A new short term target is now calculated for this downwards movement to end and a bounce to begin.
Summary: The short term target is about 1,236. Assume the short term trend remains down while price remains below 1,251.54. A breach of the channel on the hourly chart and a new high above 1,251.54 would indicate the first bounce may have begun, to last about one to three days.
The longer term classic analysis target is about 1,228. The Elliott wave target for downwards movement to end is at 1,191. The lower Elliott wave target may be met in about four weeks time.
I will leave it up to members to decide on when to take profits, as each trader may have a different preferred time frame for trading. For maximum profits, positions entered prior to the breakout may possibly be held until the target is reached.
The trend for now is down. Bounces are opportunities to enter the trend.
Always trade with stops and invest only 1-5% of equity on any one trade.
New updates to this analysis are in bold.
Last monthly charts for the main wave count are here, another monthly alternate is here, and video is here.
Grand SuperCycle analysis is here.
MAIN ELLIOTT WAVE COUNT
WEEKLY CHART
Click chart to enlarge.
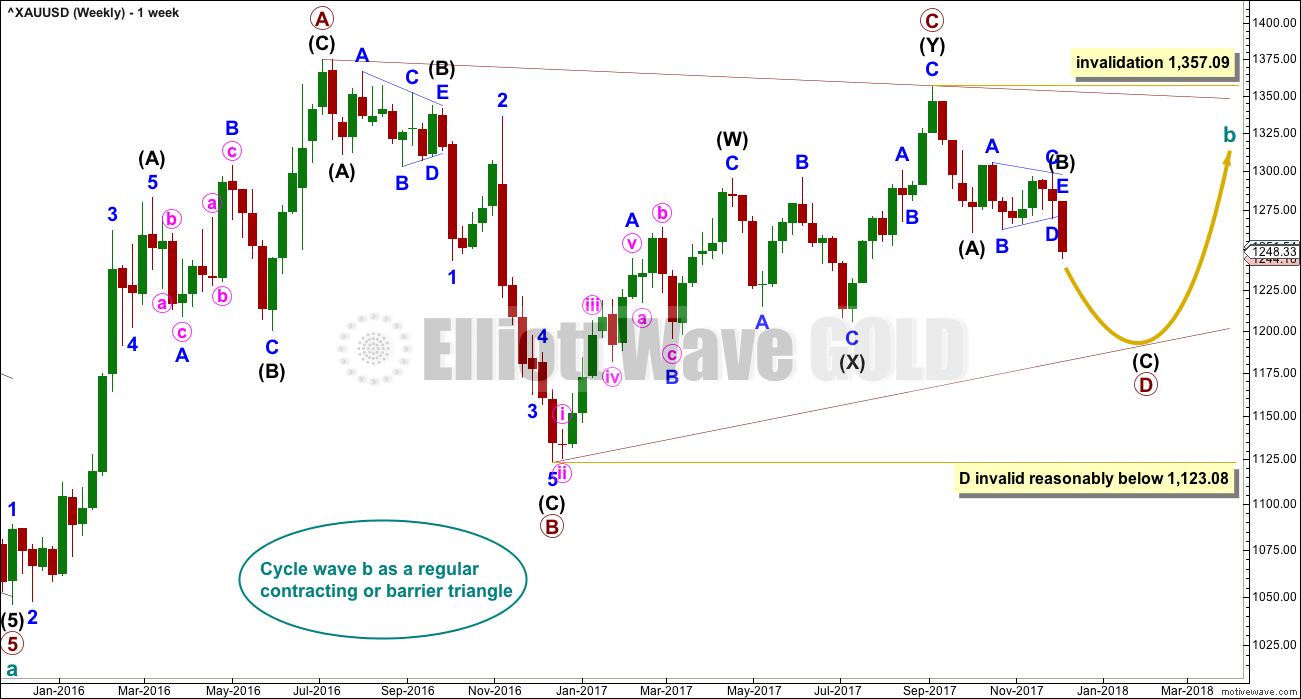
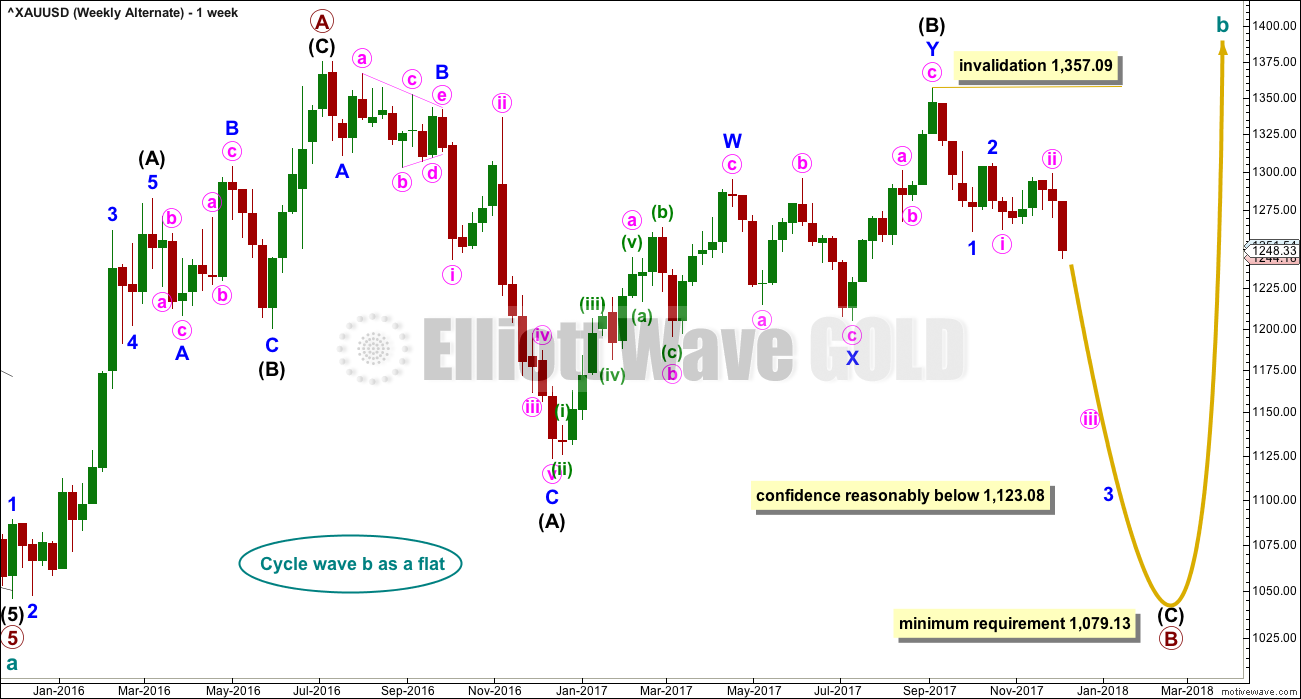
All wave counts expect that Gold completed a large five down from the all time high in November 2011 to the low of December 2015, which is seen on the left hand side of both weekly charts.
If this analysis is correct, then the five down may not be the completion of the correction. Corrective waves do not subdivide as fives; they subdivide as threes. The five down is seen as cycle wave a within Super Cycle wave (a).
All wave counts then expect cycle wave b began in December 2015.
There are more than 23 possible corrective structures that B waves may take. It is important to always have multiple wave counts when B waves are expected.
It looks unlikely that cycle wave b may have been over at the high labelled primary wave A. Primary wave A lasted less than one year at only 31 weeks. Cycle waves should last one to several years and B waves tend to be more time consuming than other Elliott waves, so this movement would be too brief for cycle wave b.
This wave count looks at cycle wave b to be most likely a regular contracting triangle.
The B-D trend line should have a reasonable slope for this triangle to have the right look, because the A-C trend line does not have a strong slope. A barrier triangle has a B-D trend line that is essentially flat; if that happened here, then the triangle trend lines would not converge with a normal look and that looks unlikely.
Primary wave D should be a single zigzag. Only one triangle sub-wave may be a more complicated multiple, and here primary wave C has completed as a double zigzag; this is the most common triangle sub-wave to subdivide as a multiple.
Primary wave D of a contracting triangle may not move beyond the end of primary wave B below 1,123.08.
At its completion, primary wave D should be an obvious three wave structure at the weekly chart level.
For this one weekly chart, two daily charts are presented below. They look at intermediate wave (B) in two different ways, and are presented now in order of probability.
DAILY CHART
Click chart to enlarge.
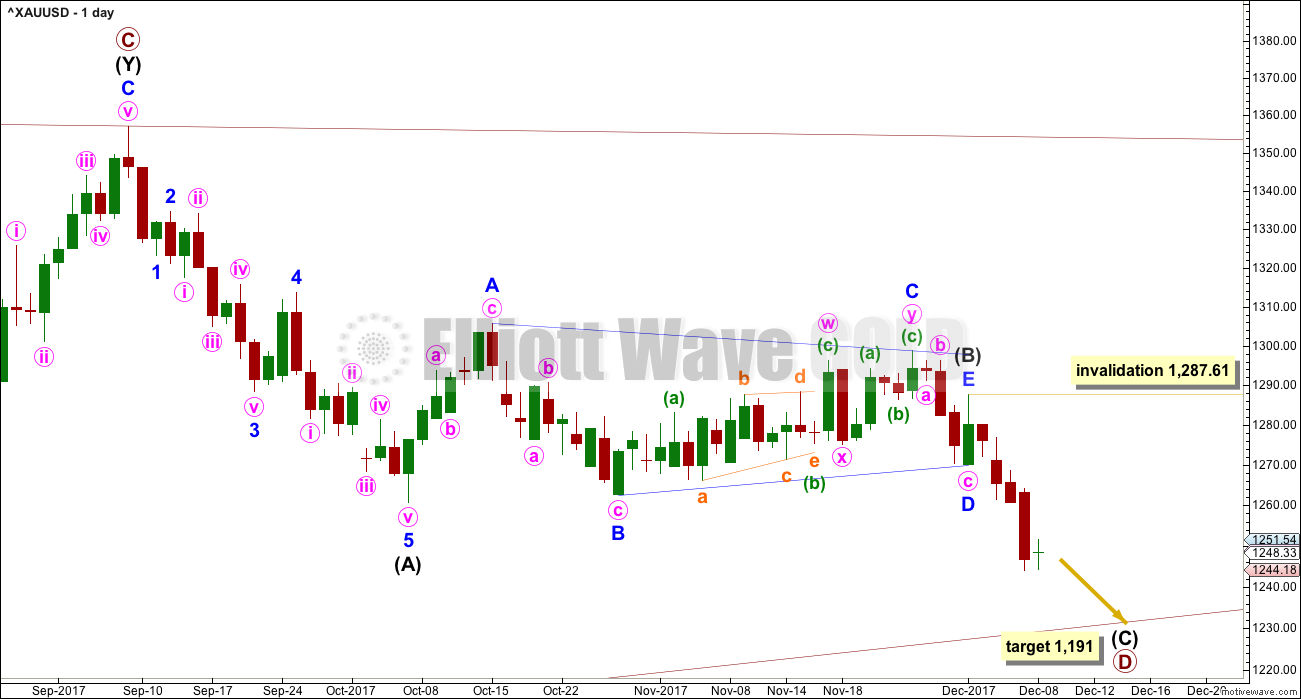
Both daily charts are identical up to the low labelled intermediate wave (A).
This first daily chart shows intermediate wave (B) as a now complete regular contracting Elliott wave triangle. This has support from what looks like a classic downwards breakout from the symmetrical triangle identified on the technical analysis chart below.
The target assumes that intermediate wave (C) may exhibit the most common Fibonacci ratio to intermediate wave (A).
Intermediate wave (C) must subdivide as a five wave structure. Within intermediate wave (C), the second wave correction to come, which will be labelled minor wave 2, may not move beyond the start of the first wave above 1,287.61.
Intermediate wave (A) lasted twenty sessions. Intermediate wave (C) may be about even in duration as well as length, so twenty or twenty-one sessions looks likely.
HOURLY CHART
Click chart to enlarge.
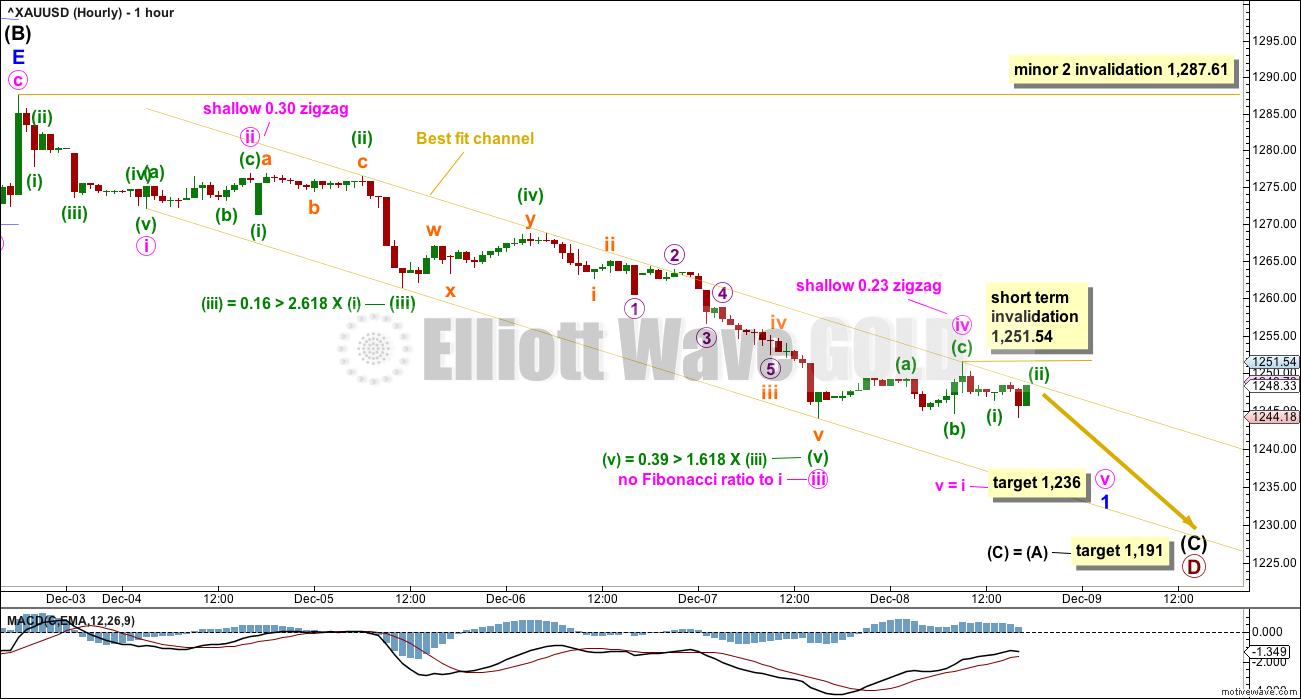
If a new trend at intermediate degree is beginning, then a five down should develop at the daily chart level. That would so far be incomplete and will be labelled here minor wave 1.
Minute waves iii and iv may now be over. There is only a very small amount of alternation within the structure between minute waves ii and iv: minute wave ii has a short minuette wave (a) and a longer minuette wave (c), whereas minute wave iv has a long minuette wave (a) and a short minuette wave (c). Alternation is a guideline, not a rule, and is not always met.
Within minute wave iii, there are extremely close Fibonacci ratios for all three actionary waves of minuette waves (i), (iii) and (v).
While minute wave v is underway, minuette wave (ii) within it may not move beyond the start of minuette wave (i) above 1,251.54.
Minute wave v may be complete as soon as price makes a new low, and the short term invalidation point will no longer apply.
Minor wave 2 may unfold over about one to three days after minor wave 1 is complete, and may not move beyond the start of minor wave 1 above 1,287.61.
For members not yet holding a short position, the highs of minor wave 2 may provide a good opportunity.
When minor wave 1 is complete, price should break out of the narrow best fit channel which contains it. A breach of the upper edge of the channel (even before a new low, if that happens) would be an indication that minor wave 1 should be over and minor wave 2 should then have just begun.
SECOND DAILY CHART
Click chart to enlarge.
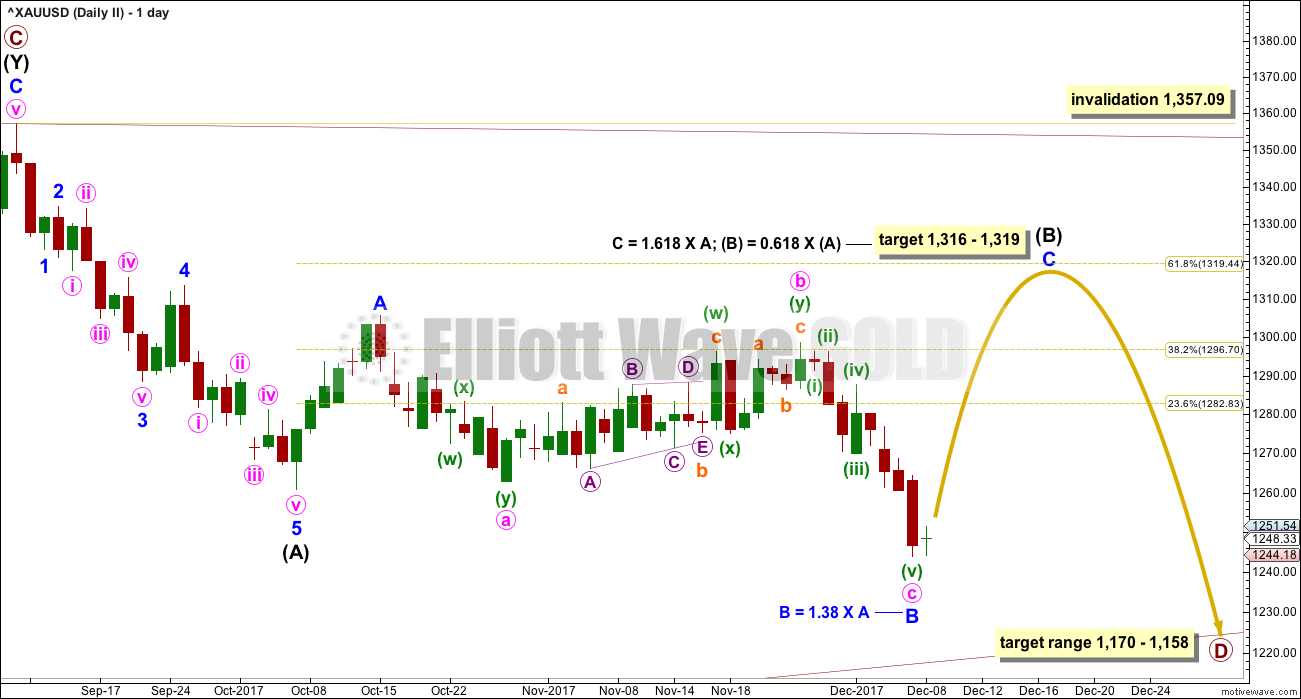
It is very important to always consider an alternate when a triangle may be unfolding. Triangles are very tricky structures, and may even be invalidated after one thinks they are complete.
It is still possible that intermediate wave (B) may be completing as a flat correction.
Within the flat correction, both minor waves A and B are threes. Minor wave B has retraced more than the minimum 0.9 length of minor wave A.
With minor wave B now a 1.38 length to minor wave A, an expanded flat is now indicated. Minor wave C of an expanded flat would most commonly be about 1.618 the length of minor wave A.
Now minor wave C may be required to move price upwards to end at least above the end of minor wave A at 1,305.72 to avoid a truncation.
A new high above 1,298.70 is required now for confidence in this wave count.
ALTERNATE ELLIOTT WAVE COUNT
WEEKLY CHART
Click chart to enlarge.
All wave counts are identical to the low labelled cycle wave a. Thereafter, they look at different possible structures for cycle wave b.
Cycle wave b may be a flat correction. Within a flat primary, wave B must retrace a minimum 0.9 length of primary wave A at 1,079.13 or below.
TECHNICAL ANALYSIS
WEEKLY CHART
Click chart to enlarge. Chart courtesy of StockCharts.com.
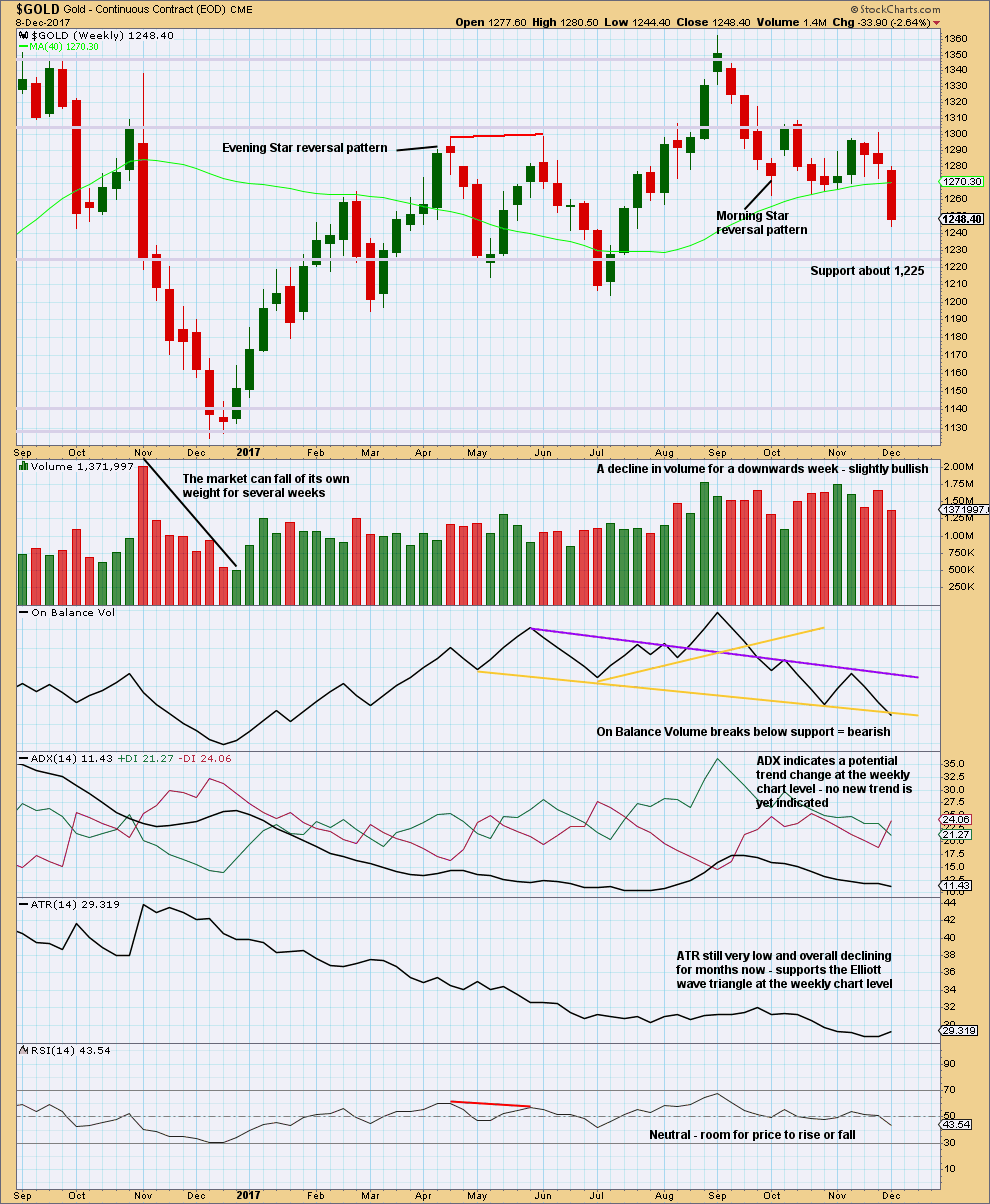
Price has broken below support this week, which was about 1,262. The market this week fell of its own weight, but this can continue for several weeks as recent evidence noted on this chart for November 2016 shows.
The last signal given from On Balance Volume was bearish. Now On Balance Volume gives another clear bearish signal this week. With On Balance Volume now fairly bearish, this offers support to the main Elliott wave count.
DAILY CHART
Click chart to enlarge. Chart courtesy of StockCharts.com.
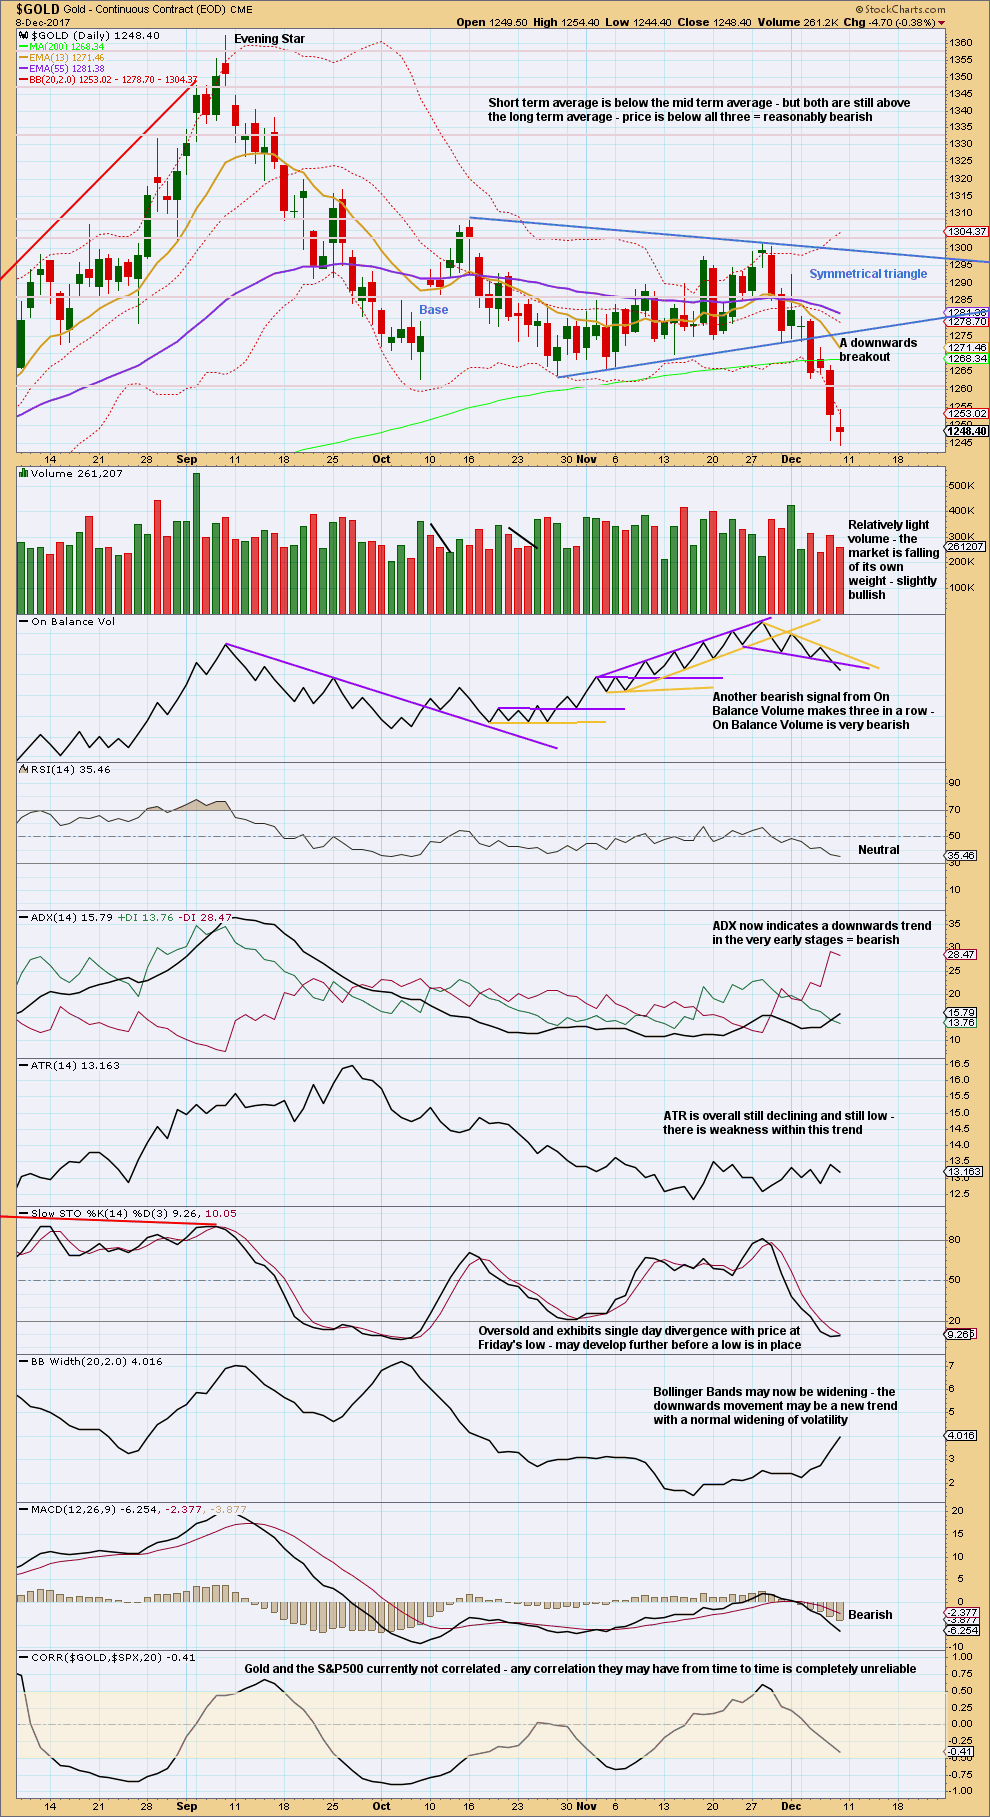
A target calculated using the symmetrical triangle is about 1,228.
Members are warned that a throwback to the lower trend line of the triangle is unlikely.
The bearish signal from On Balance Volume on this daily chart supports the main Elliott wave count. Give weight to this signal.
The strongest signal that ADX can give is when the black ADX line rises up from low levels and from below both directional lines. When ADX then reaches 15, it signals a new trend. This is the situation now with ADX, and it indicates a downwards trend is beginning, that it should still be in its early stages.
With RSI not yet oversold and Stochastics only just now oversold, there is still room for price to fall further here.
GDX DAILY CHART
Click chart to enlarge. Chart courtesy of StockCharts.com.
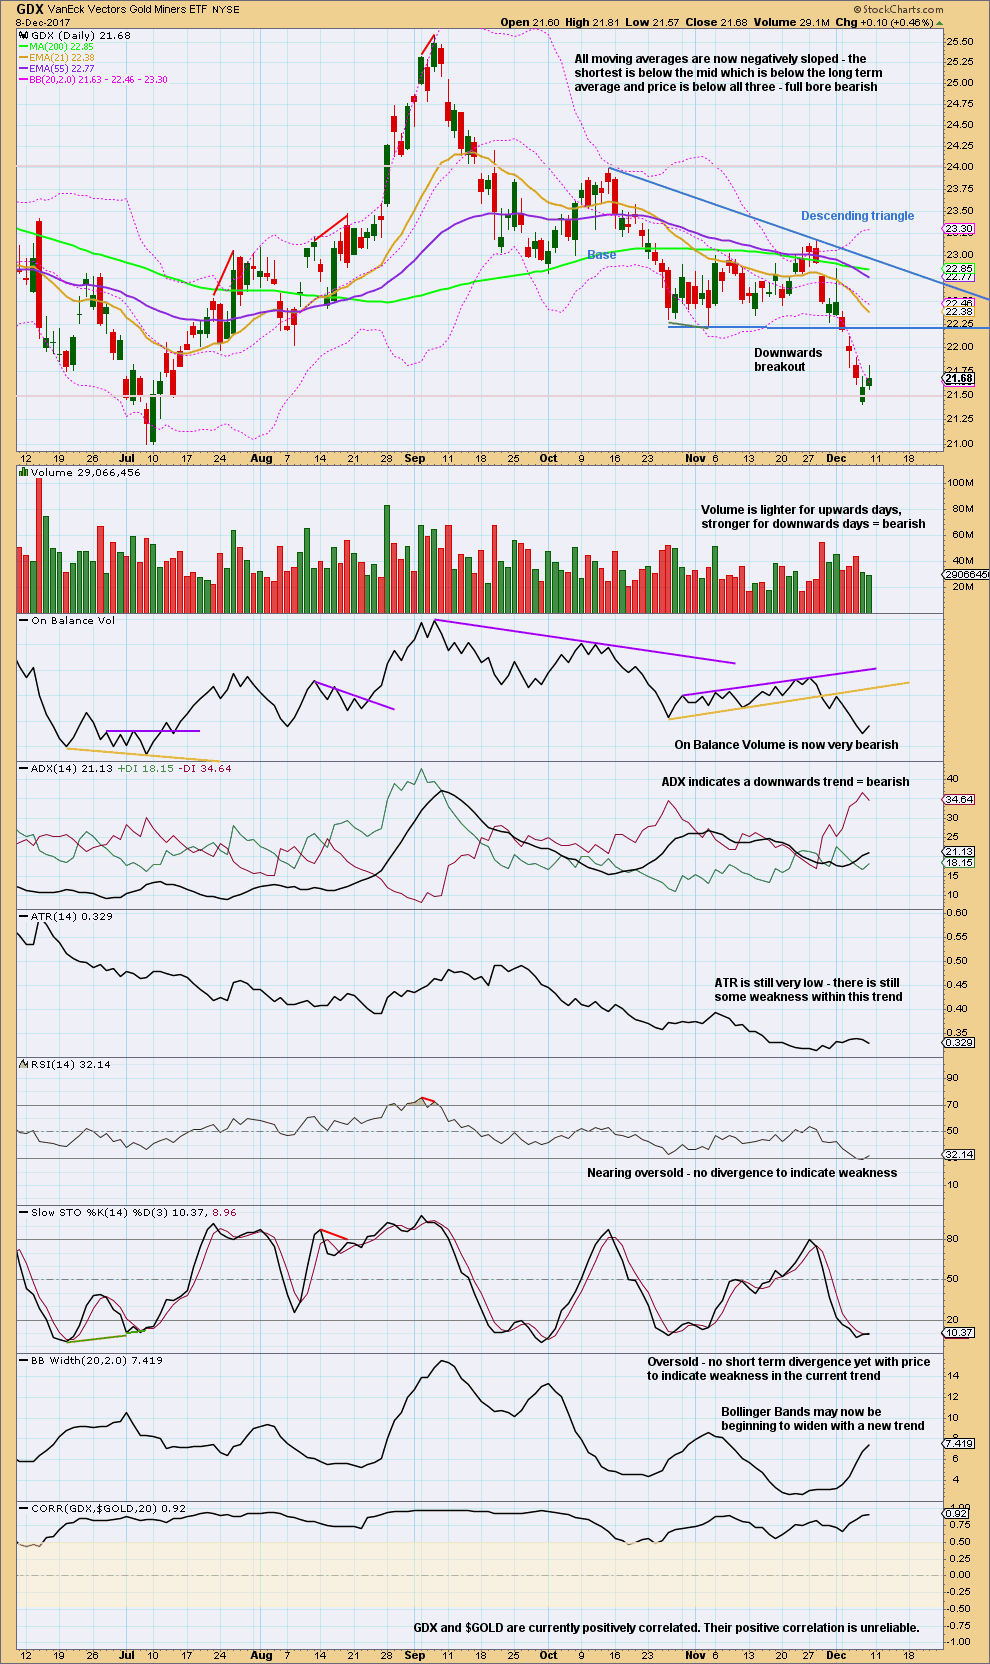
A target calculated from the width of the triangle and applied to the breakout point is at 20.43.
There is a next area of support about 21.00.
There is no support for upwards movement from volume and from Friday’s candlestick with a longer upper wick. This looks bearish. Upwards movement should be expected to be a counter trend movement offering an entry point to join the downwards trend.
Published @ 10:38 p.m. EST.
Updated hourly chart:
I’m redrawing the channel now using Elliott’s second technique.
Now there is alternation between minute ii and iv.
The target remains the same, the short term invalidation point no longer applies.
Still expecting more downwards movement to complete the structure, and then a multi day bounce for a second wave correction.
Taking profits on my GLD bearish call credit spreads today in anticipation of a second wave bounce… 🙂
Most excellent Verne! I knew you’d be one to jump all over that breakout from the triangle…
Hi Lara, I was wondering if possible, could you have a quick look at copper. We have hit your upper target and i am just wondering if we’re gonna go down big going forward. Thanks
My EW analysis for Copper doesn’t have a bigger picture, because I just don’t have enough data going back far enough. The upwards move now can be a complete double zigzag structure.
Because triples are so rare, if I’ve got that structure right it should have now had a trend change.
I have more confidence in my classic TA analysis of copper.
There is a downwards trend. It’s in the early stages. Bounces are an opportunity to join the trend. Volume agrees the trend is down.
My wave count for Copper only looks at the upwards wave and it’s structure. I can’t fit that into the bigger picture without more data.
Thanks for the update.
You’re most welcome 🙂
So I showed the longer term Natural Gas chart below. Here’s a close-up of the last 4 years. The chart is a bit busy, so you may need to study it a bit.
I think I have identified 2 possible opportunities:
1) Seasonally, Natural Gas has made a high in January or late December the last 4 yours. Each year the high has come sooner, so the high this year may be around December 20th.
The drop that follows has averaged 29.2% for an average 48.5 trading days, ending between February and April.
2) The second opportunity is that Natural Gas may continue down for most or all of 2018 if the Cycle degree wave 5 shown is correct. Note the large Orange H & S that supports the idea of a big drop in 2018.
..and when this finally bottoms, a big move up
https://www.tradingview.com/x/4N2Y5dYf/
Hi Dreamer. Was having a look at GDX and when I am in doubt I go back to the HUI since it is US stocks traded in US dollars and doesn’t have the noise of the overseas stocks. It tends to give cleaner counts IMO. This looks like a reasonable idea as long as 16O holds.
Stuart, thanks for sharing. I don’t think the gold complex is bullish enough for a 1-2, 1-2 count though it’s possible. Overall, the move up from the Dec 2015 gold low and the Jan 2016 is likely corrective as Lara thinks.
I still think gold and miners could make a new high before the next major leg down starts. HUI and GDX may take out their Dec 2016 lows before the next leg up starts.
We’ll have to see what happens after the Fed meeting this week.
There is a longer term chart that seems to have bullish possibilities. BGMI is the longest continuous index for the miners. I may have taken some licence with the labelling but there was a huge bull market in the 30’s which I have labelled as wave 1. The most interesting thing is that this has the appearance of a corrective structure (running flat) since the 1980 top.
It has also been my observation that when a stock or index breaks out from a long term downtrend with high strength that there is often significant follow through after the initial consolidation. Not always though….
I have often wondered about smaller degree waves continuing longer in time and size than the same wave of next higher degree. I know Lara sometimes labels waves that way (not very often) but some analysts think, as I am inclined to, that it negates the entire of notion of wave degree. Interestingly enough, I have looked at a number of charts trying to figure out how big a difference it would ultimately make and surprisingly differences in degree labels, especially at lower degrees often STILL end up with similar counts at the end. Very interesting!
Natural Gas?
https://www.tradingview.com/x/3NKzYmM1/