
An upwards breakout from a consolidation was expected, but it has come much more quickly than expected. A new alternate wave count this week should prepare members if price continues higher from here.
Summary: The main wave count expects a trend change to a new bear market to last one to several years, and the target is 463. However, for confidence in this view, first a new low below 1,324.93 and then a breach of the Elliott channel on the hourly charts by downwards movement is required.
A new alternate expects overall upwards movement from here. It would be confirmed if price makes a new high reasonably above 1,357.09.
[wlm_private “GOLD Daily YT|GOLD Daily NT|GOLD Daily NTGR|GOLD DAILY 6M NT|GOLD DAILY 6M YT|GOLD DAILY 6M NT GFR|GOLD Plus Daily YT|GOLD Plus Daily NT|OIL SILVER Weekly YT|OIL SILVER Weekly NT|GOLD Plus Daily 6M NT|GOLDPLUSDAY6M|OIL SILVER Weekly 6M NT|GOLDPLUSDAY1M|GOLDPLUSDAY1MYT|GOLDDAY6M|GOLDDAY1M|GOLDDAY1MYT|OILSILVERWEEK6M|OILSILVERWEEK1M|OILSILVERWEEK1MYT”]One approach to this uncertainty may be to hedge. A long position may have a stop a little below the black Elliott channel, which would be about 1,319.50. A short position may have a stop a little above 1,357.09.[/wlm_private] Always manage risk by trading with stops and investing only 1-5% of equity on any one trade.
New updates to this analysis are in bold.
Last monthly charts for the main wave count are here, another monthly alternate is here, and video is here.
Grand SuperCycle analysis is here.
MAIN ELLIOTT WAVE COUNT
WEEKLY CHART
Click chart to enlarge.
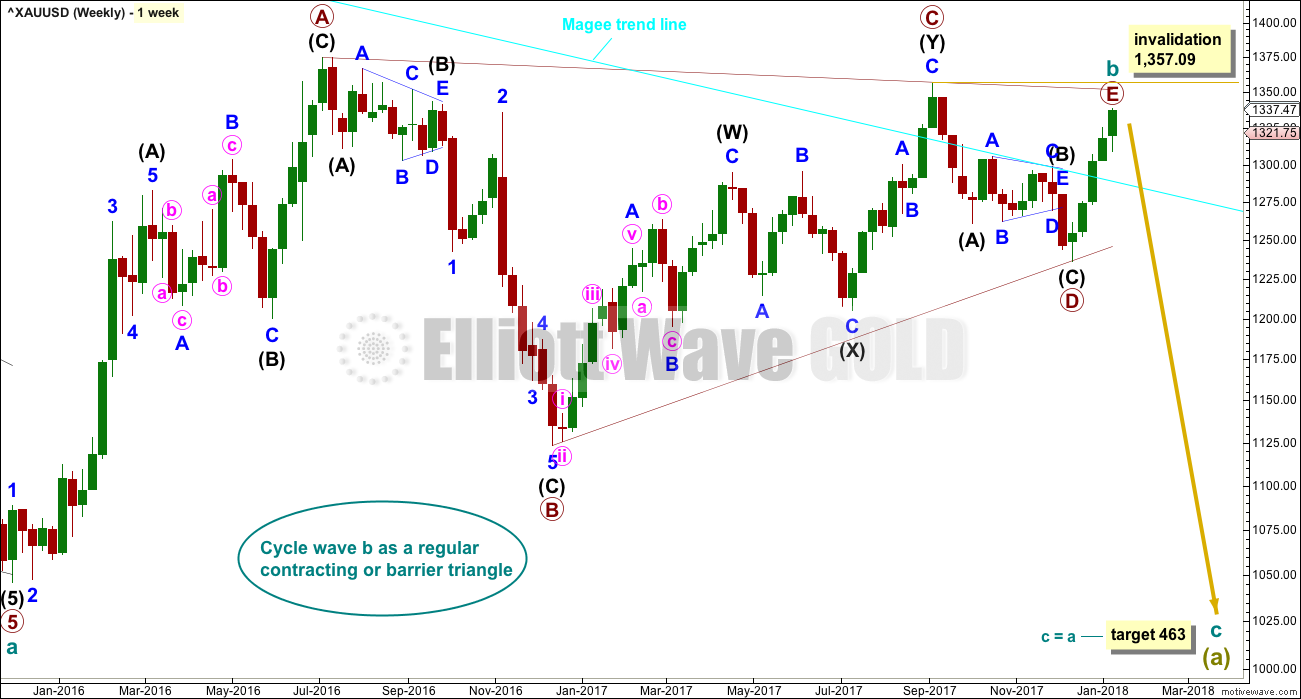
All wave counts expect that Gold completed a large five down from the all time high in November 2011 to the low of December 2015, which is seen on the left hand side of both weekly charts.
If this analysis is correct, then the five down may not be the completion of the correction. Corrective waves do not subdivide as fives; they subdivide as threes. The five down is seen as cycle wave a within Super Cycle wave (a).
All wave counts then expect cycle wave b began in December 2015.
There are more than 23 possible corrective structures that B waves may take. It is important to always have multiple wave counts when B waves are expected. It is for this reason that a weekly alternate wave count will be published daily.
It looks unlikely that cycle wave b may have been over at the high labelled primary wave A. Primary wave A lasted less than one year at only 31 weeks. Cycle waves should last one to several years and B waves tend to be more time consuming than other Elliott waves, so this movement would be too brief for cycle wave b.
This wave count looks at cycle wave b to be most likely a regular contracting triangle.
All sub-waves must subdivide as threes within an Elliott wave triangle, and four of the five sub-waves must be zigzags or multiple zigzags, and the most common sub-wave to be a multiple is wave C. Only one sub-wave may be a more complicated multiple. This triangle meets all these rules and guidelines; all subdivisions fit perfectly at all time frames. It is the main wave count for these reasons, and thus is judged to have the highest probability.
The triangle trend lines have a normal looking convergence. Primary wave D now looks fairly likely to be complete, and it looks like an obvious three wave structure at the weekly chart level.
While primary wave E should also most likely look like an obvious three wave structure at the weekly and daily chart levels, it does not have to do this. It is possible at the end of this week that primary wave E could be over, falling reasonably short of the A-C trend line and being relatively quick. E waves of triangles can often be the quickest of all triangle waves.
DAILY CHART
Click chart to enlarge.
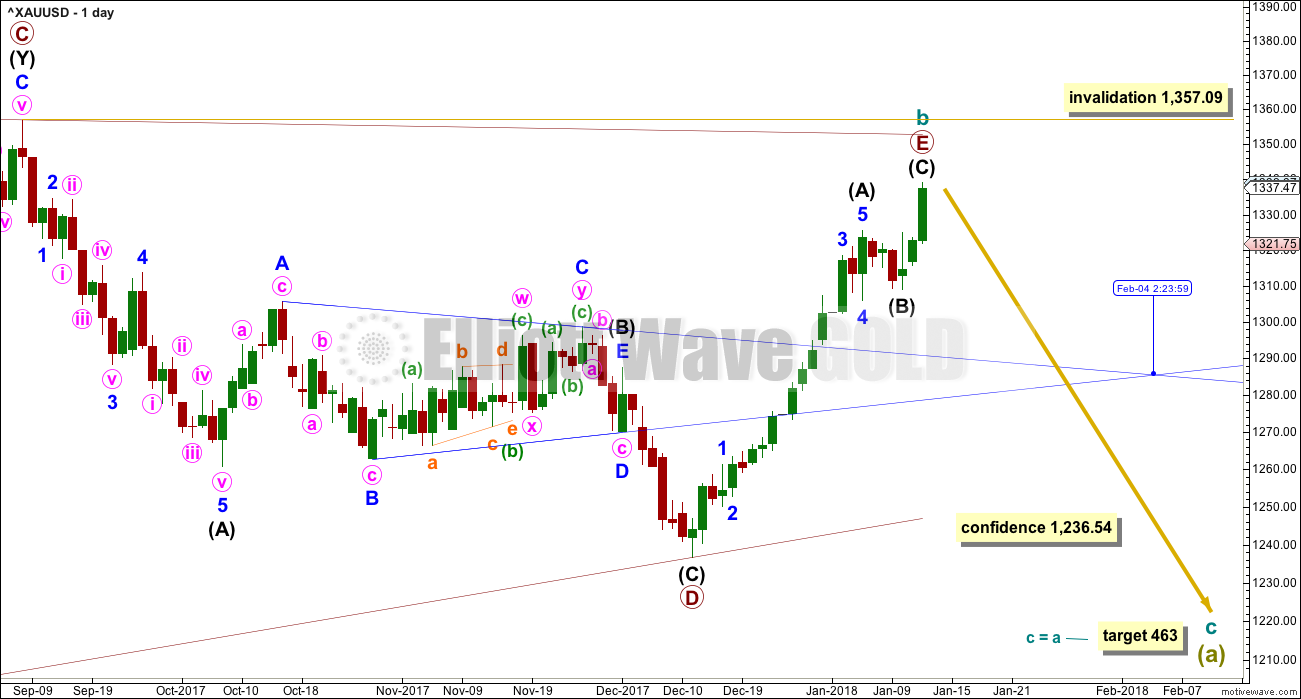
This first wave count follows on directly from the weekly chart above. It looks at primary wave E as a single zigzag. Zigzags subdivide 5-3-5.
It is possible today that the zigzag for primary wave E may be complete. It looks like a zigzag at the daily chart level. E waves of triangles can be surprisingly quick. A very good example of this is here on this daily chart: the triangle labelled intermediate wave (B) within primary wave D also came to a quicker than expected end.
The target calculated for cycle wave c assumes the most common Fibonacci ratio to cycle wave a.
If primary wave E continues higher, it may not move beyond the end of primary wave C above 1,357.09. A new high by any amount at any time frame would immediately invalidate this wave count.
2 HOURLY CHART
Click chart to enlarge.
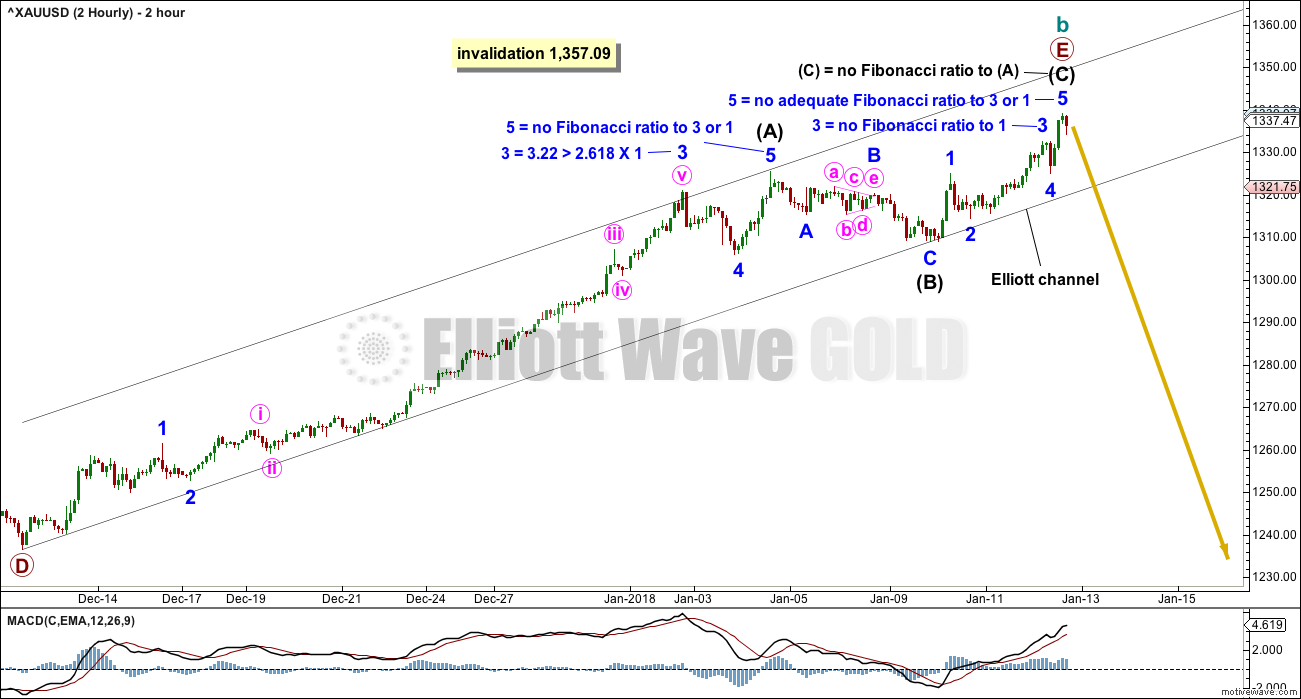
This 2 hourly chart shows all of primary wave E. The bottom line for this wave count is that while price remains within this channel there is no evidence of a trend change. This channel must be breached by downwards movement before any confidence may be had in a trend change.
HOURLY CHART
Click chart to enlarge.
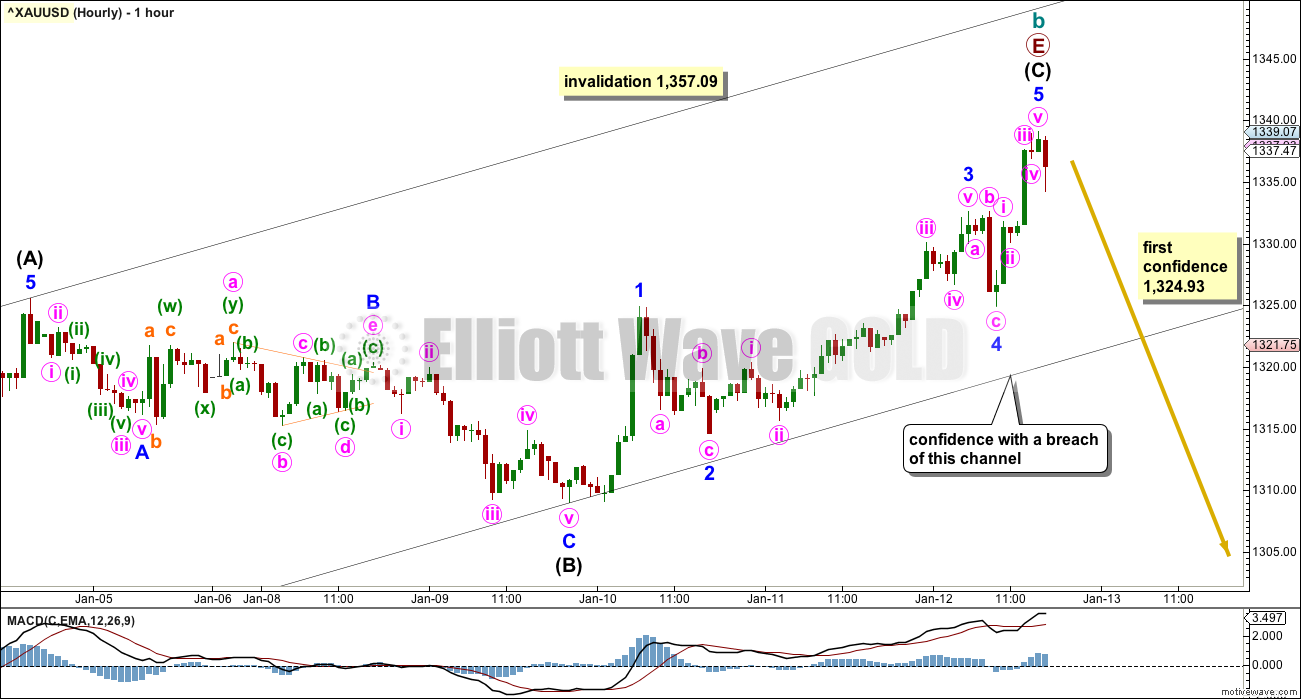
Intermediate wave (B) may have been remarkably brief, much more so than expected. Intermediate wave (C) will now fit as a completed five wave impulse.
A new low below 1,324.93 would add a little confidence in this wave count. A clear breach of the black Elliott channel by downwards movement is required for reasonable confidence.
While price remains within the channel, accept the possibility that it may continue higher.
ALTERNATE HOURLY CHART
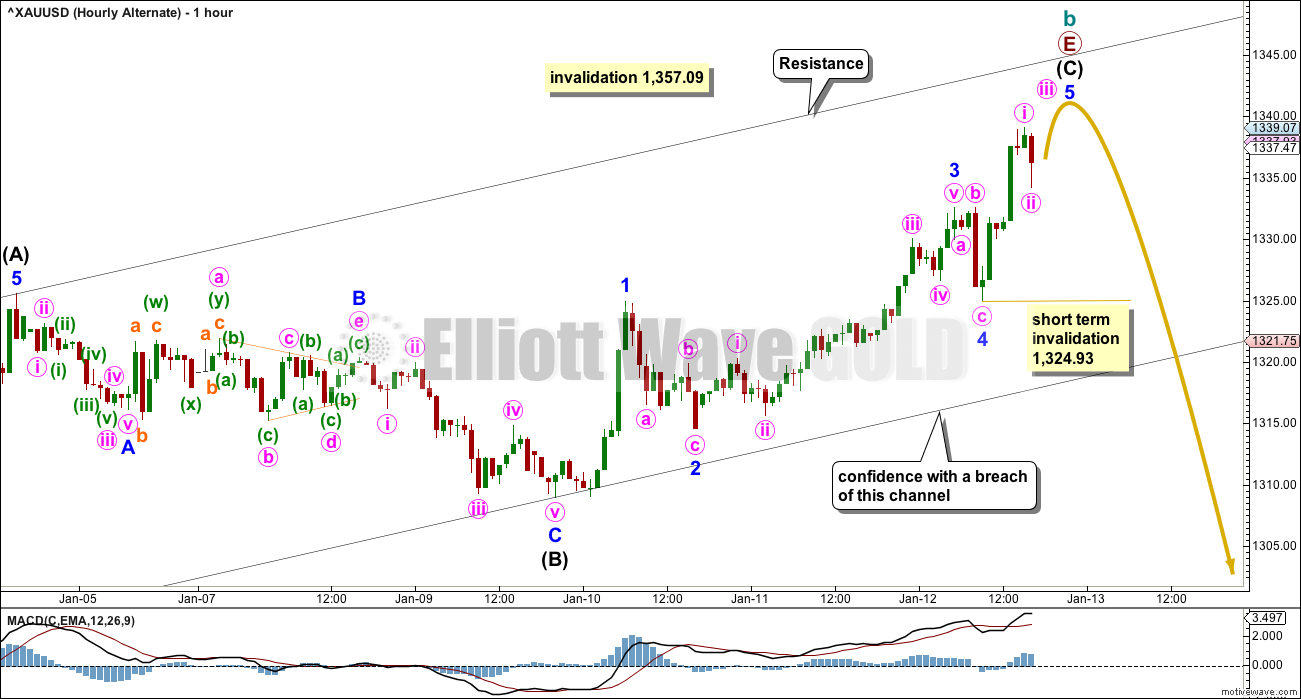
Click chart to enlarge.
By simply moving the degree of labelling within the last wave up all down one degree, it is entirely possible that primary wave E is not yet over.
Within minor wave 5, the correction for minute wave ii may not move beyond the start of minute wave i below 1,324.93.
The upper edge of the Elliott channel may provide resistance. If price comes up to touch that trend line and this wave count remains valid, then look out for a downwards reaction there.
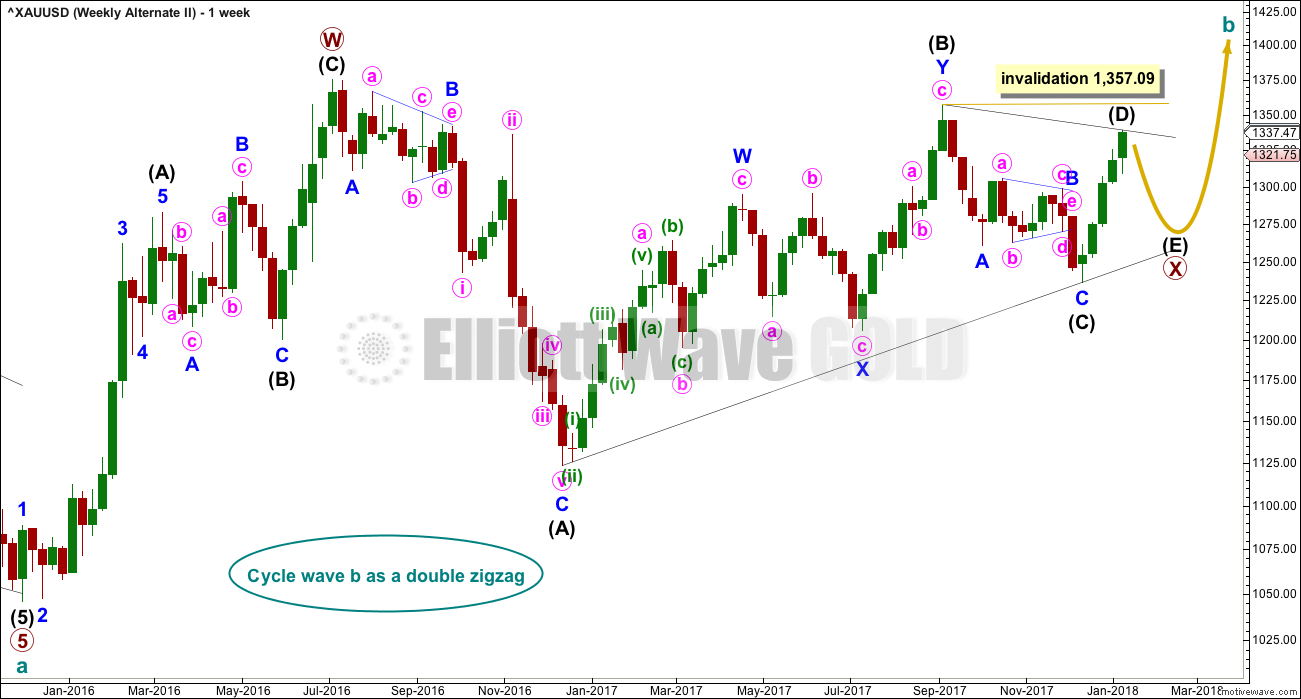
ALTERNATE ELLIOTT WAVE COUNT
WEEKLY CHART
Click chart to enlarge.
This is the best bullish wave count that I can see at this stage. The extra video for members this week shows how it was developed.
If cycle wave b is a single zigzag, then the upwards wave labelled here primary wave A must be seen as a five wave structure. But this is problematic because (within primary wave A) intermediate wave (4) lasted 12 weeks whereas intermediate wave (2) only lasted 2 weeks. While disproportion between corrective waves does not violate any Elliott wave rules, it does give a wave count the wrong look.
Gold is typical of commodities in that it often exhibits swift strong fifth waves, leading to blowoff tops in bull markets and selling climaxes in bear markets. This tendency is most often seen in Gold’s third waves. When this happens the strong fifth wave forces the fourth wave correction that comes before it to be more brief and shallow than good proportion to its counterpart second wave would suggest. When this happens the impulse has a curved three wave look to it at higher time frames.
It is acceptable for a wave count for a commodity to see a curved impulse which has a more time consuming second wave correction within it than the fourth wave correction.
The impulse has a more time consuming fourth wave than the second in this case though, giving the wave the look of a zigzag. This is unusual, and so the probability of this wave count is low.
Low probability does not mean no probability, so this wave count is possible; when low probability outcomes do occur, they are never what was expected as most likely.
Primary wave C must subdivide as a five wave structure, either an impulse or an ending diagonal. Because the upwards wave of intermediate wave (1) fits as a zigzag and will not fit as an impulse, an ending diagonal is considered.
Ending diagonals require all sub-waves to subdivide as zigzags.
Within intermediate wave (1), to see this wave as a zigzag, minor wave B is seen as a double flat correction. In my experience double flats are extremely rare structures, even rarer than running flats. The rarity of this structure further reduces the probability of this wave count.
Intermediate wave (3) must move beyond the end of intermediate wave (1) above 1,357.09.
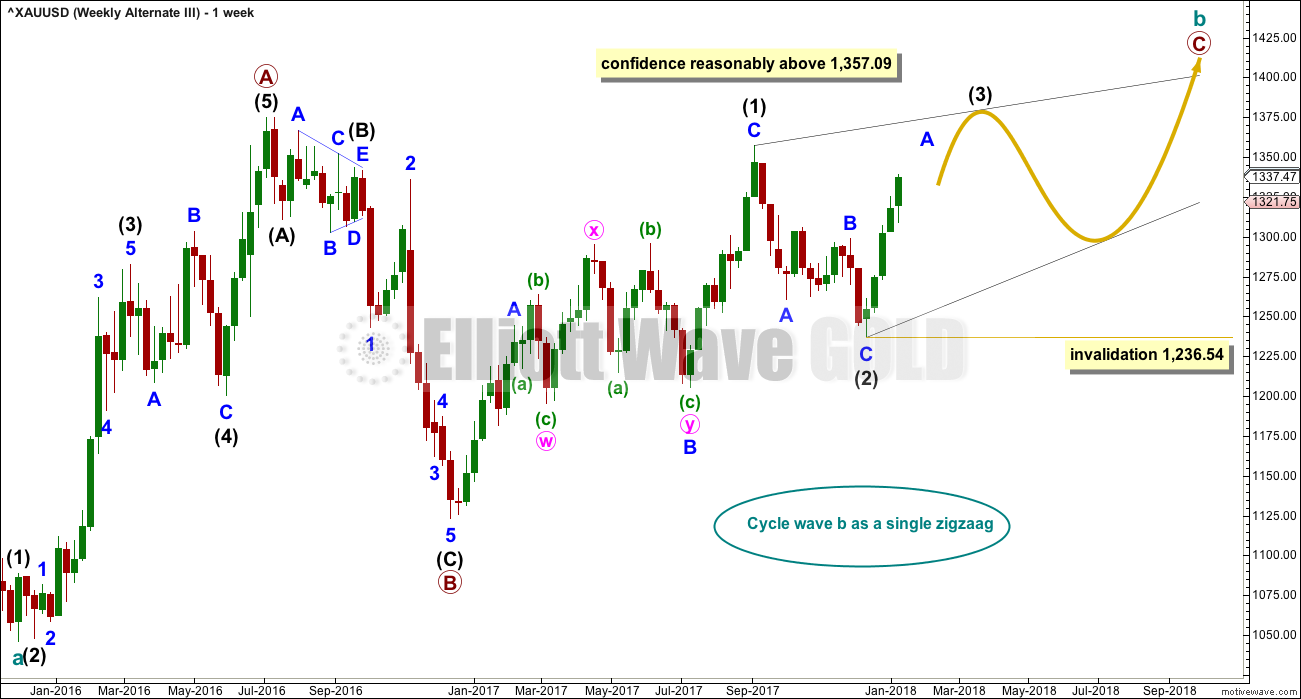
SECOND ALTERNATE ELLIOTT WAVE COUNT
WEEKLY CHART
Click chart to enlarge.
This second alternate is new, developed from a suggestion by an Elliott Wave Gold member, Dreamer.
A triangle may be completing as an X wave within a double zigzag for cycle wave b.
Now the upwards wave labelled here primary wave W is seen as a zigzag. This has a better fit than the first alternate.
Within the triangle for primary wave X, intermediate waves (A) through to (C) may be complete. Intermediate wave (D) may also be complete, but there is room for it to still move higher. If the triangle for primary wave X is a regular contracting triangle, then intermediate wave (D) may not move beyond the end of intermediate wave (B) above 1,357.09. If the triangle is a barrier triangle, then intermediate wave (D) should end about the same level as intermediate wave (B), so that the (B)-(D) trend line remains essentially flat. In practice, this means that intermediate wave (D) may end slightly above 1,357.09 and this wave count would remain valid.
This is why a new high reasonably above 1,357.09 only would invalidate this wave count. This invalidation point is not black and white.
TECHNICAL ANALYSIS
WEEKLY CHART

Click chart to enlarge. Chart courtesy of StockCharts.com.
Now that price has again broken above resistance at 1,305 to 1,310, that area may now provide support. Next resistance is about 1,345.
Stochastics is added this week. Price is range bound in a weekly level consolidation. As price swings from resistance to support and back again, Stochastics may be used to assist to see where each swing may end and the next begin. Price is nearing resistance at 1,345 and Stochastics is just entering overbought. It looks reasonable to expect the upwards swing to end soon; there is a little room for price to rise still.
DAILY CHART
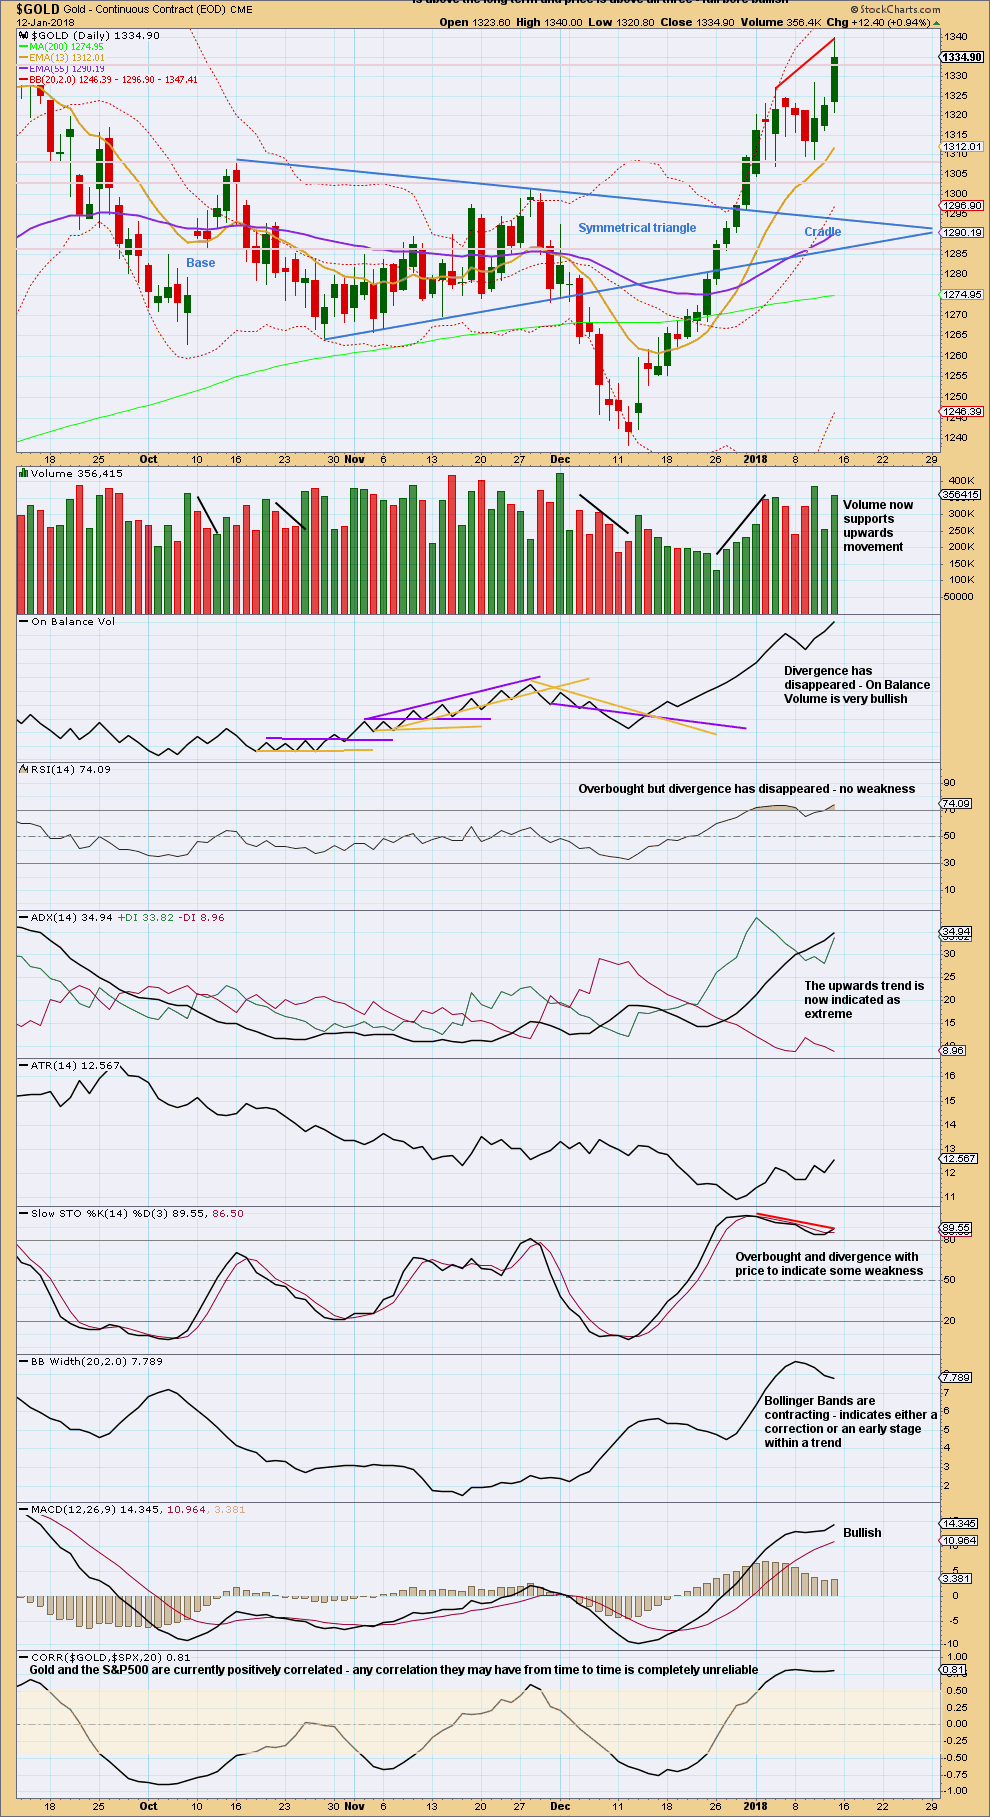
Click chart to enlarge. Chart courtesy of StockCharts.com.
Resistance about 1,330 did not hold during Friday’s session. Next resistance is on the weekly chart about 1,345.
Divergence with RSI has simply disappeared. RSI is overbought, but it can remain so for a reasonable length of time when Gold has a strong bull trend.
Stochastics is overbought and exhibits clear divergence with price, but this can develop further into multiple divergence before the bull trend ends.
ADX indicates the trend is extreme, but this can persist for reasonable periods of time when Gold has a strong bull trend.
There is room still for price to rise further.
GDX DAILY CHART
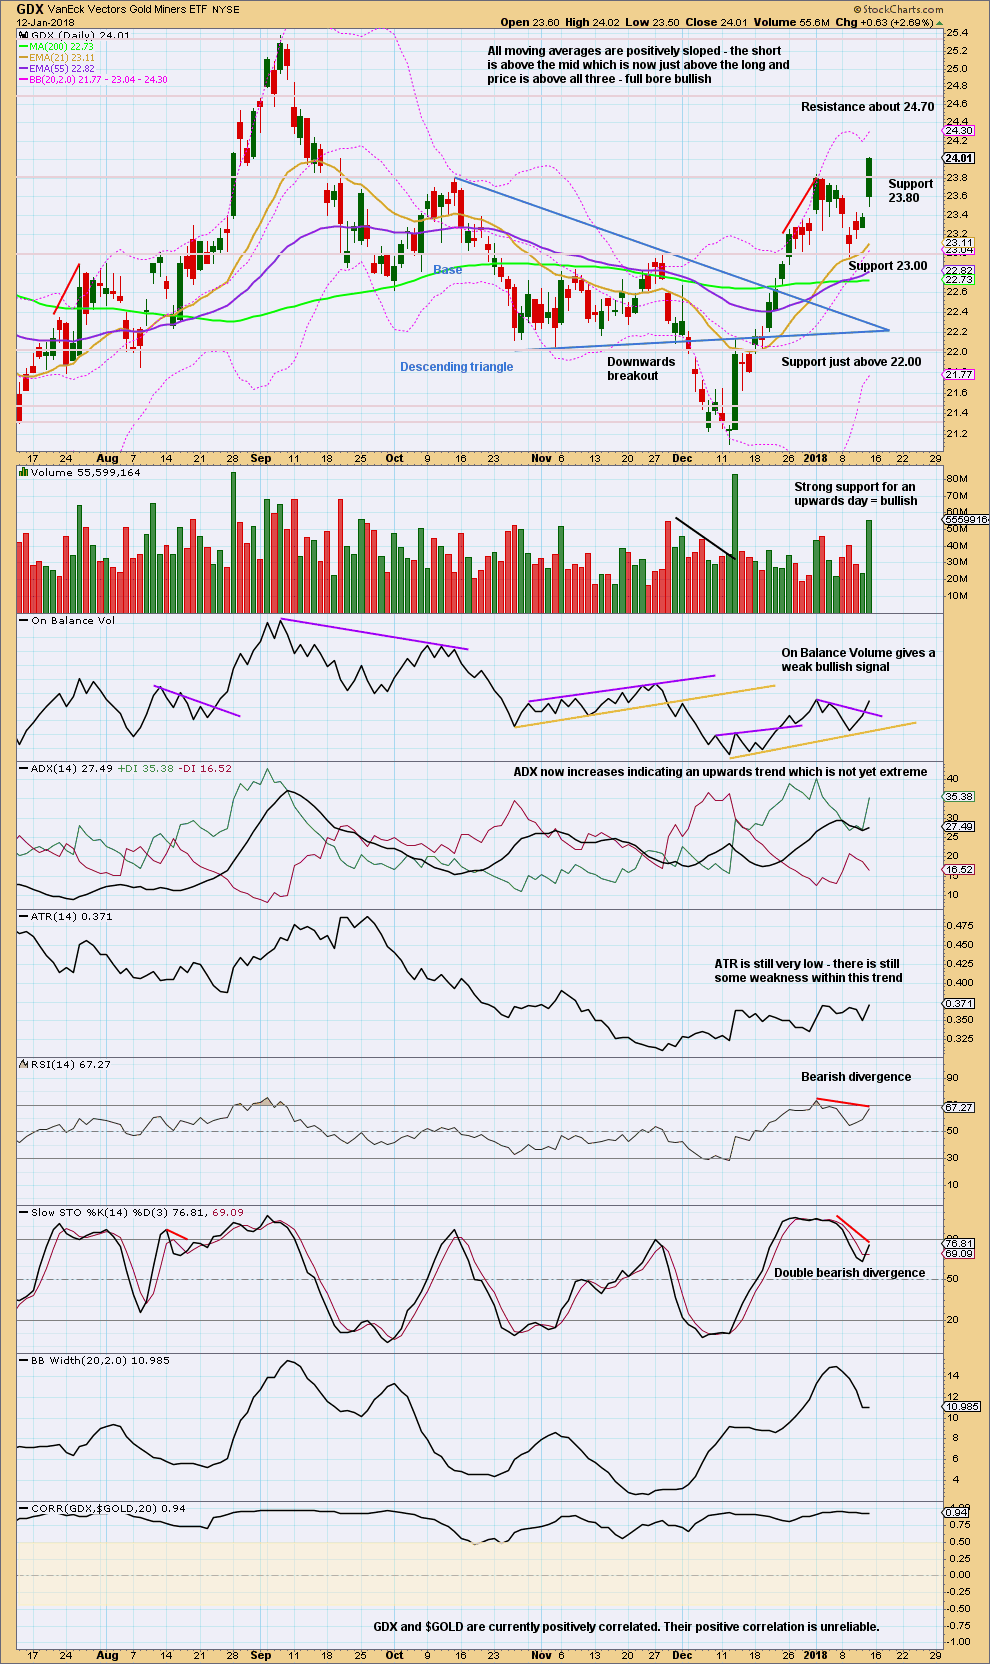
Click chart to enlarge. Chart courtesy of StockCharts.com.
Price has broken above resistance with support from volume. Next resistance is about 23.70.
However, for GDX there is weakness exhibited by divergence in both RSI and Stochastics. This may yet disappear, but for now it exists.
The bullish signal given by On Balance Volume is weak because the trend line breached on Friday is short held, reasonably sloped and tested only twice before.
Published @ 05:57 p.m. EST on 13th January, 2018.
[Note: Analysis is public today for promotional purposes. Specific trading advice and comments will remain private for members only.]