
Price has moved lower as the main wave count has expected, but it has still not broken out of the channel nor passed the confidence point. Alternates are still considered.
Summary: The main wave count expects a trend change to a new bear market to last one to several years, and the target is 470. However, for confidence in this view, first a new low below 1,324.93 and then a breach of the Elliott channel on the hourly charts by downwards movement is required.
A new alternate expects overall upwards movement from here. It would be confirmed if price makes a new high reasonably above 1,357.09.
New updates to this analysis are in bold.
Last historic analysis with monthly charts is here. Video is here.
Grand SuperCycle analysis is here.
MAIN ELLIOTT WAVE COUNT
WEEKLY CHART
Click chart to enlarge.
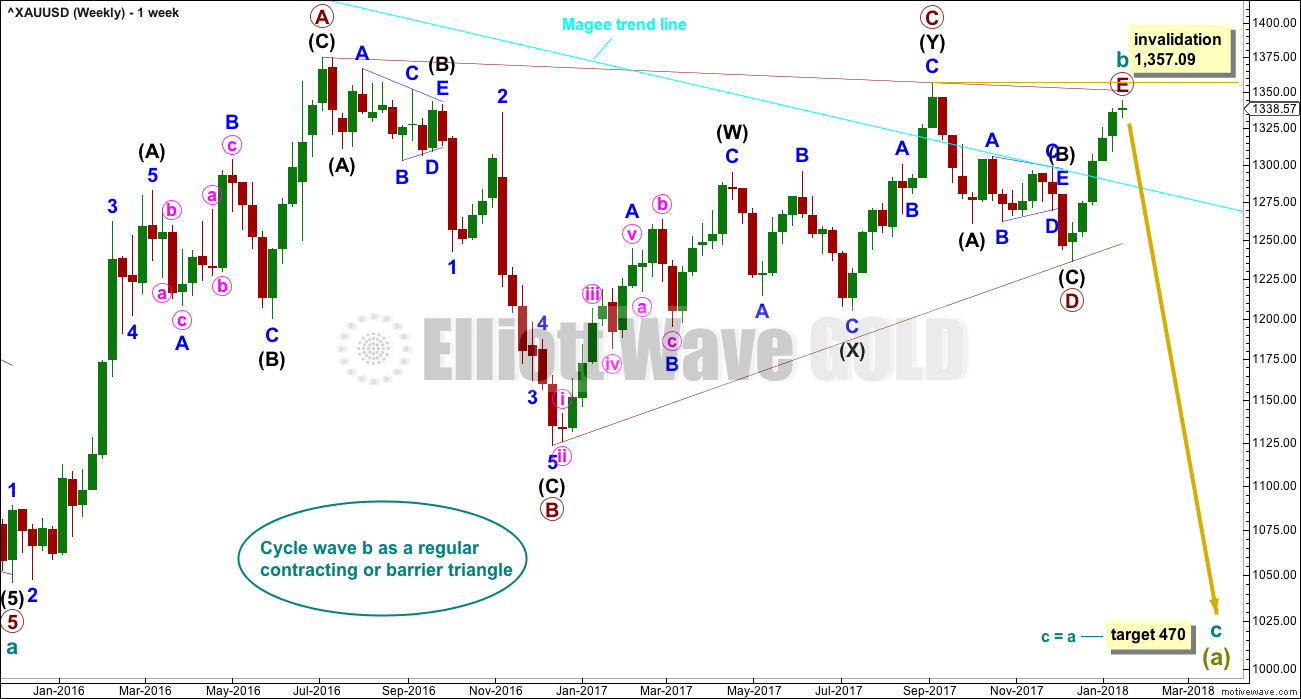
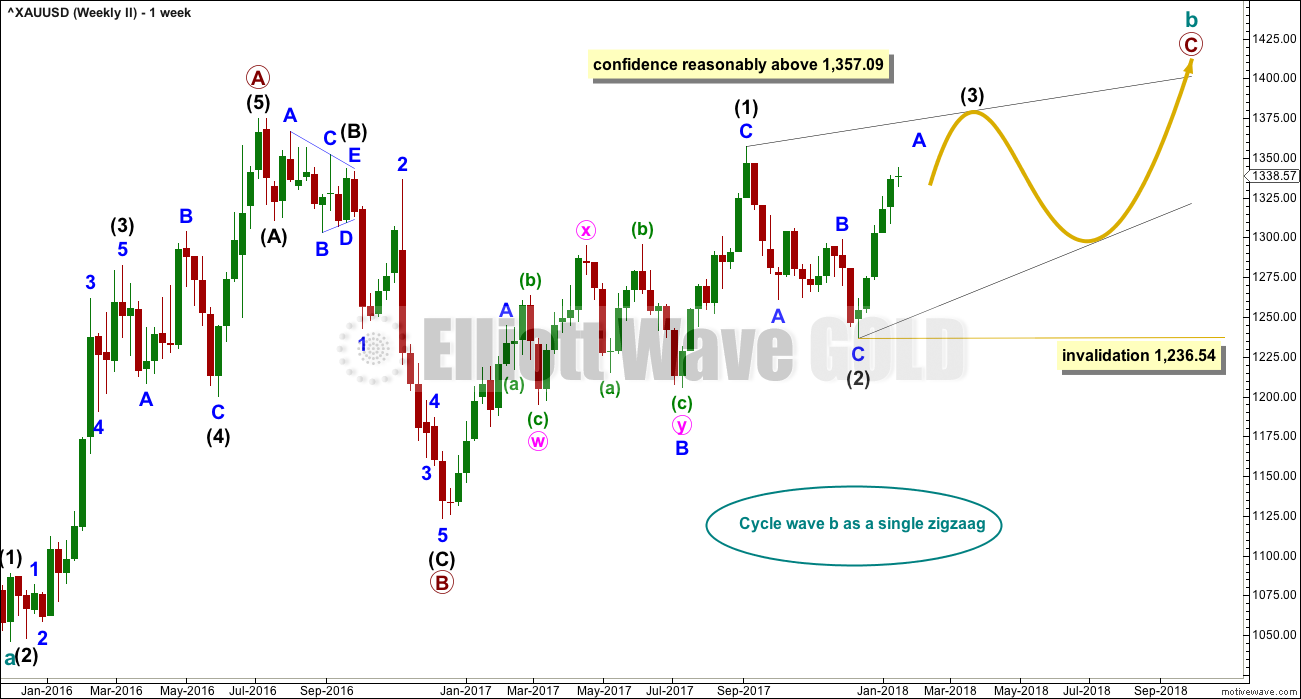
All main wave counts expect that Gold completed a large five down from the all time high in November 2011 to the low of December 2015, which is seen on the left hand side of weekly charts.
If this analysis is correct, then the five down may not be the completion of the correction. Corrective waves do not subdivide as fives; they subdivide as threes. The five down is seen as cycle wave a within Super Cycle wave (a).
Cycle wave b began in December 2015.
It looks unlikely that cycle wave b may have been over at the high labelled primary wave A. Primary wave A lasted less than one year at only 31 weeks. Cycle waves should last one to several years and B waves tend to be more time consuming than other Elliott waves, so this movement would be too brief for cycle wave b.
This wave count looks at cycle wave b to be most likely a regular contracting triangle.
All sub-waves must subdivide as threes within an Elliott wave triangle, and four of the five sub-waves must be zigzags or multiple zigzags, and the most common sub-wave to be a multiple is wave C. Only one sub-wave may be a more complicated multiple. This triangle meets all these rules and guidelines; all subdivisions fit perfectly at all time frames. It is the main wave count for these reasons, and thus is judged to have the highest probability.
The triangle trend lines have a normal looking convergence. Primary wave D now looks fairly likely to be complete, and it looks like an obvious three wave structure at the weekly chart level.
While primary wave E should also most likely look like an obvious three wave structure at the weekly and daily chart levels, it does not have to do this. It is possible that primary wave E could be over, falling reasonably short of the A-C trend line and being relatively quick. E waves of triangles can often be the quickest of all triangle waves.
DAILY CHART
Click chart to enlarge.
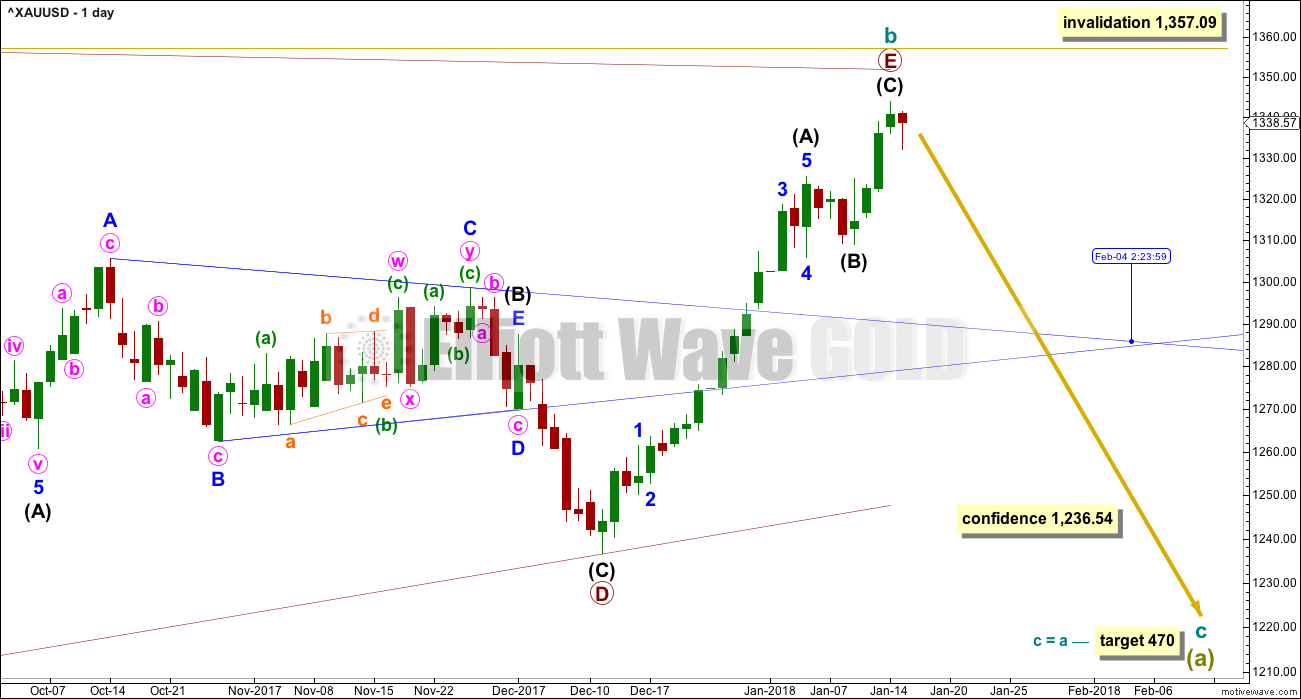
This first wave count follows on directly from the weekly chart above. It looks at primary wave E as a single zigzag. Zigzags subdivide 5-3-5.
It is possible that the zigzag for primary wave E may be complete. It looks like a zigzag at the daily chart level. E waves of triangles can be surprisingly quick. A very good example of this is here on this daily chart: the triangle labelled intermediate wave (B) within primary wave D also came to a quicker than expected end.
The target calculated for cycle wave c assumes the most common Fibonacci ratio to cycle wave a.
If primary wave E continues higher, it may not move beyond the end of primary wave C above 1,357.09. A new high by any amount at any time frame would immediately invalidate this wave count.
HOURLY CHART
Click chart to enlarge.
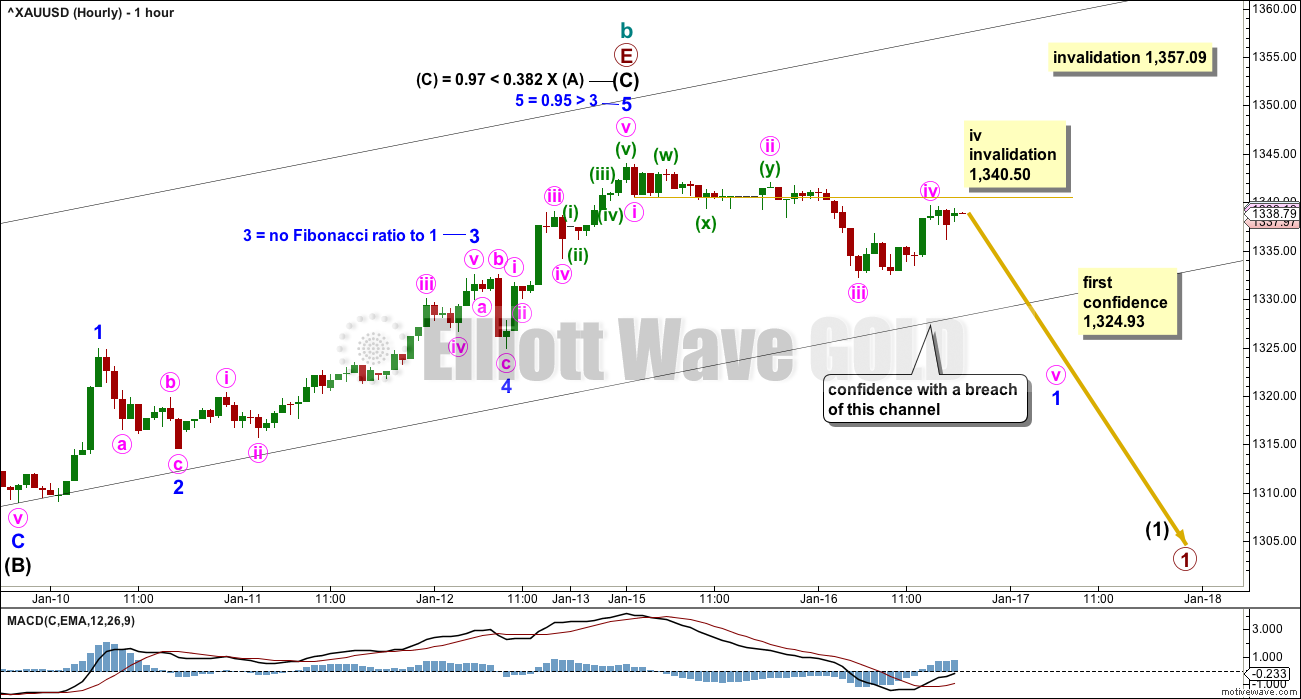
If primary wave E is complete, then a five down should develop at the hourly chart level first.
A five down may be almost complete, and within it minute wave iv may not move into minute wave i price territory above 1,340.50.
A new low below 1,324.93 must be seen and the black channel must be breached by downwards movement for any confidence at all in a trend. While price remains above 1,324.93 and within the channel, the alternate hourly chart below may be correct. The second weekly chart below may also be correct.
ALTERNATE HOURLY CHART
Click chart to enlarge.
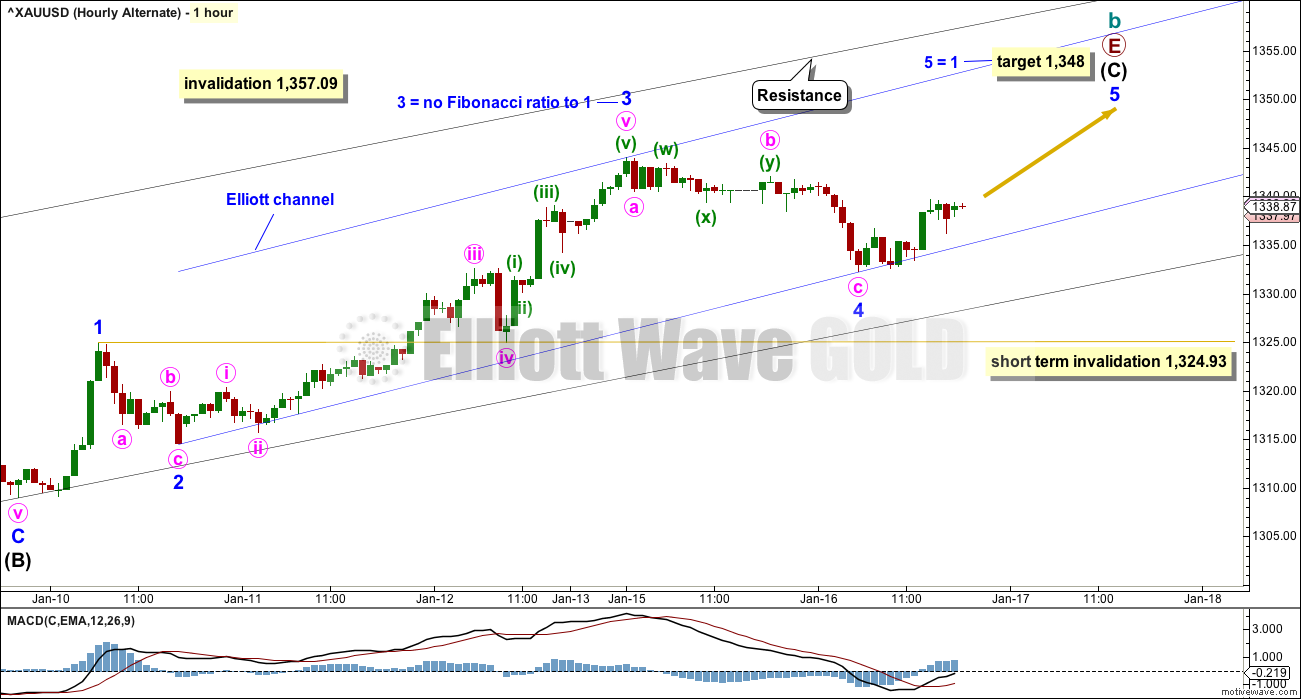
It remains possible that intermediate wave (C) is incomplete and the downwards movement during this session is minor wave 4 within it.
Minor wave 4 may not move into minor wave 1 price territory below 1,324.93.
It would be more likely that minor wave 5 would exhibit a Fibonacci ratio to either of minor waves 1 or 3, because there is no Fibonacci ratio between minor waves 1 and 3. The most common ratio for a fifth wave is used to calculate the target.
The target would see the maroon A-C trend line on the daily and weekly charts slightly overshot. While this is not the most common place for E waves of triangles to end, it is entirely possible.
SECOND WAVE COUNT
WEEKLY CHART
Click chart to enlarge.
If cycle wave b is a single zigzag, then the upwards wave labelled here primary wave A must be seen as a five wave structure. But this is problematic because (within primary wave A) intermediate wave (4) lasted 12 weeks whereas intermediate wave (2) only lasted 2 weeks. While disproportion between corrective waves does not violate any Elliott wave rules, it does give a wave count the wrong look.
Gold is typical of commodities in that it often exhibits swift strong fifth waves, leading to blowoff tops in bull markets and selling climaxes in bear markets. This tendency is most often seen in Gold’s third waves. When this happens the strong fifth wave forces the fourth wave correction that comes before it to be more brief and shallow than good proportion to its counterpart second wave would suggest. When this happens the impulse has a curved three wave look to it at higher time frames.
It is acceptable for a wave count for a commodity to see a curved impulse which has a more time consuming second wave correction within it than the fourth wave correction.
The impulse has a more time consuming fourth wave than the second in this case though, giving the wave the look of a zigzag. This is unusual, and so the probability of this wave count is low.
Low probability does not mean no probability, so this wave count is possible; when low probability outcomes do occur, they are never what was expected as most likely.
Primary wave C must subdivide as a five wave structure, either an impulse or an ending diagonal. Because the upwards wave of intermediate wave (1) fits as a zigzag and will not fit as an impulse, an ending diagonal is considered.
Ending diagonals require all sub-waves to subdivide as zigzags.
Within intermediate wave (1), to see this wave as a zigzag, minor wave B is seen as a double flat correction. In my experience double flats are extremely rare structures, even rarer than running flats. The rarity of this structure further reduces the probability of this wave count.
Intermediate wave (3) must move beyond the end of intermediate wave (1) above 1,357.09.
THIRD WAVE COUNT
WEEKLY CHART
Click chart to enlarge.
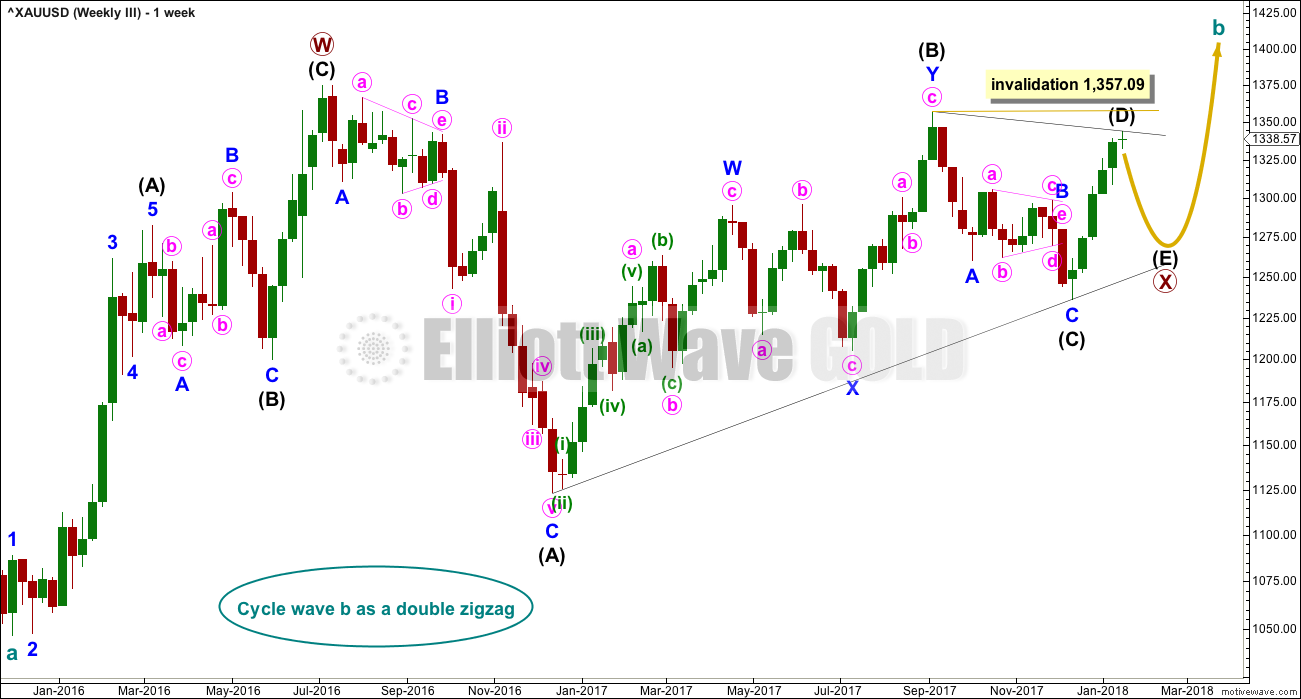
Cycle wave a is still seen as a completed five wave structure. This third wave count looks at cycle wave b as a possible double zigzag.
A triangle may be completing as an X wave within a double zigzag for cycle wave b.
Now the upwards wave labelled here primary wave W is seen as a zigzag. This has a better fit than the first alternate.
Within the triangle for primary wave X, intermediate waves (A) through to (C) may be complete. Intermediate wave (D) may also be complete, but there is room for it to still move higher. If the triangle for primary wave X is a regular contracting triangle, then intermediate wave (D) may not move beyond the end of intermediate wave (B) above 1,357.09. If the triangle is a barrier triangle, then intermediate wave (D) should end about the same level as intermediate wave (B), so that the (B)-(D) trend line remains essentially flat. In practice, this means that intermediate wave (D) may end slightly above 1,357.09 and this wave count would remain valid.
This is why a new high reasonably above 1,357.09 only would invalidate this wave count. This invalidation point is not black and white.
TECHNICAL ANALYSIS
WEEKLY CHART

Click chart to enlarge. Chart courtesy of StockCharts.com.
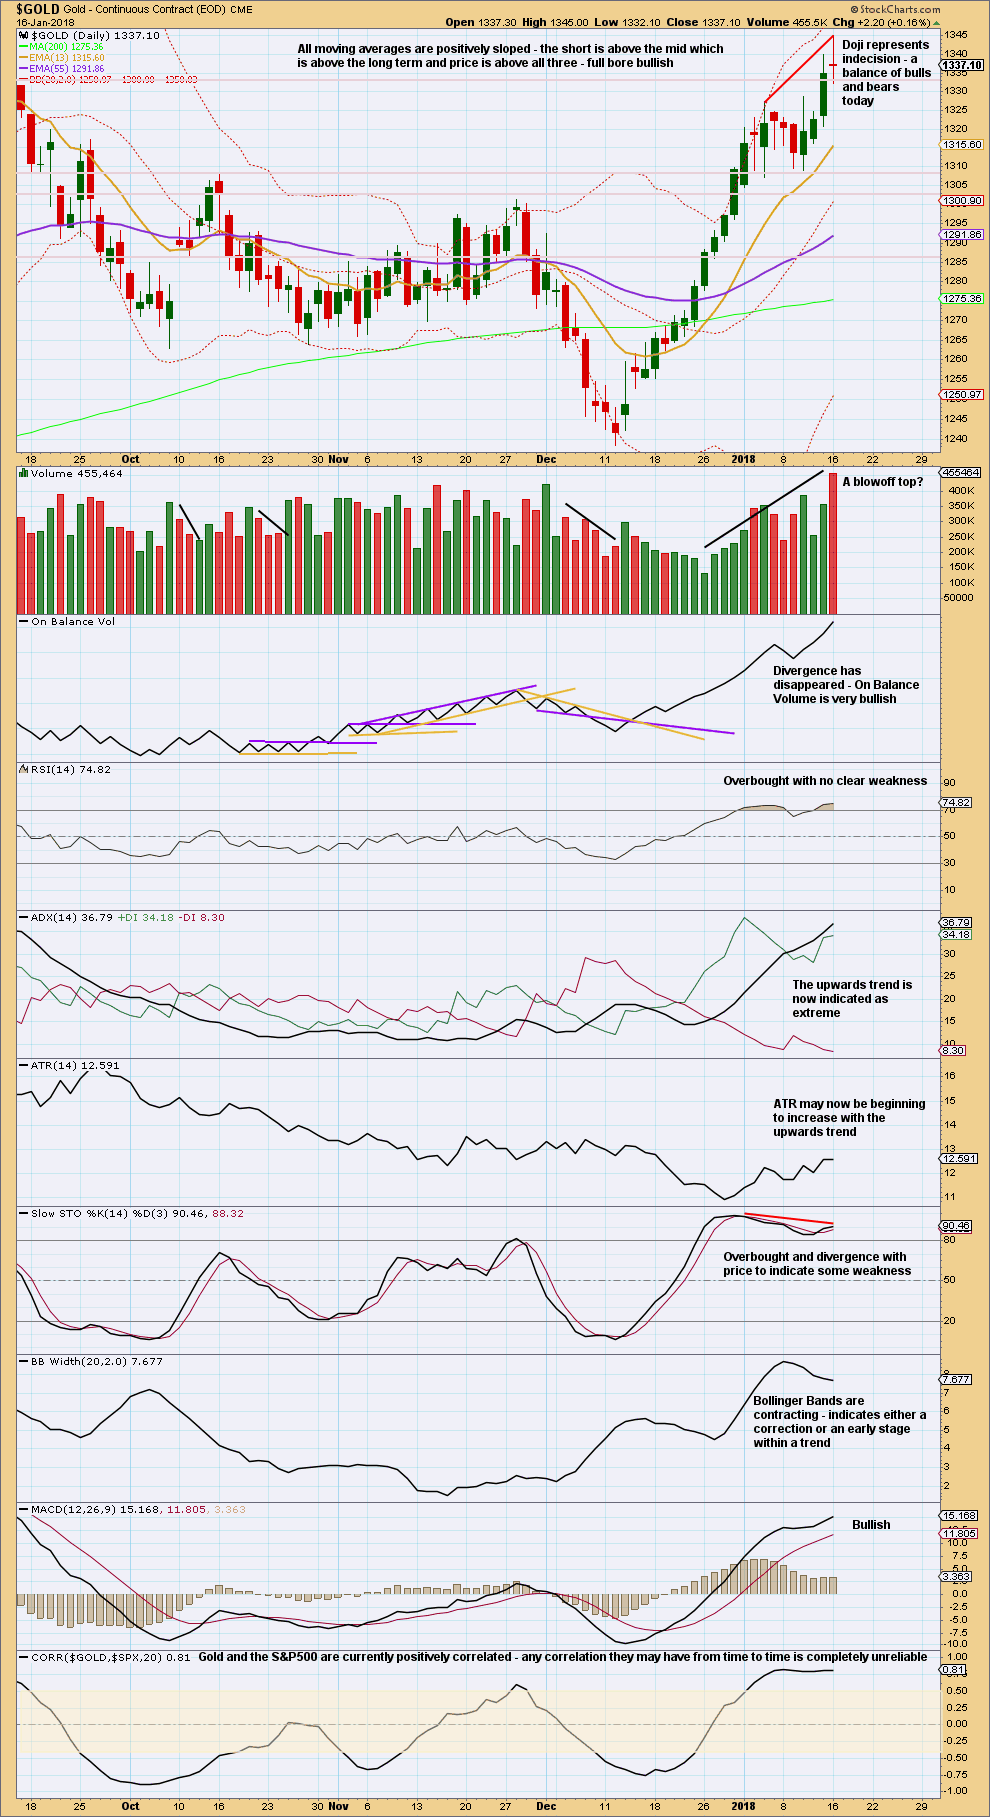
Now that price has again broken above resistance at 1,305 to 1,310, that area may now provide support. Next resistance is about 1,345.
Stochastics is added this week. Price is range bound in a weekly level consolidation. As price swings from resistance to support and back again, Stochastics may be used to assist to see where each swing may end and the next begin. Price is nearing resistance at 1,345 and Stochastics is just entering overbought. It looks reasonable to expect the upwards swing to end soon; there is a little room for price to rise still.
DAILY CHART
Click chart to enlarge. Chart courtesy of StockCharts.com.
The latest daily candlestick moves price higher and the balance of volume is upwards for the session, although the candlestick closes red. This looks like a possible blow off top.
It would be more common before a trend change though to see RSI move further into overbought and then develop clear strong divergence to indicate weakness. That is not the case yet.
This chart remains bullish, although the trend is extreme.
GDX DAILY CHART
Click chart to enlarge. Chart courtesy of StockCharts.com.
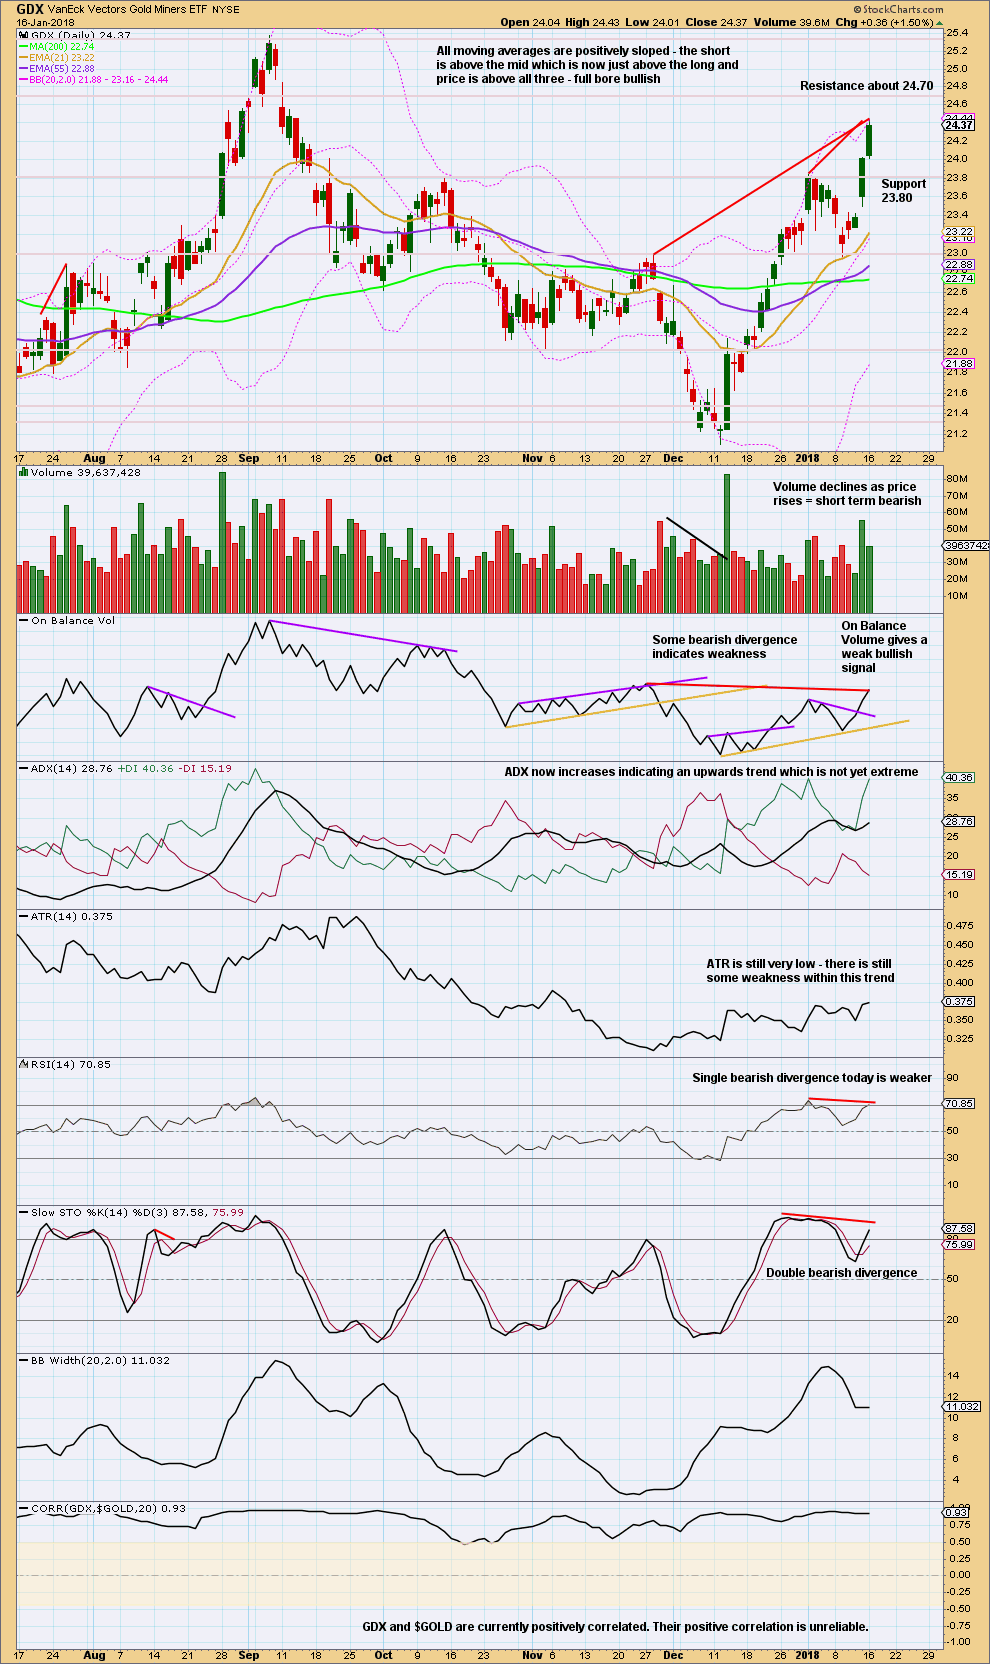
If On Balance Volume should be read as a leading indicator, then its failure to make a new high above the prior high of the 28th of November, 2017, should be read as bearish. Red trend lines indicate this divergence on the chart.
Overall, this chart is bullish. The trend is not extreme yet. There is little weakness evident.
It remains to be seen if divergence from On Balance Volume is indicating a trend change.
Published @ 07:00 p.m. EST.
Lara’s main hourly working out nicely so far – down to 1327.
So far… so good….
We still need that price point 1,324.93 breached for good confidence though.
Main hourly chart updated:
I’ve been thinking about how to trade this current uncertainty over next direction when the trend at this stage is still clearly up and there is room for it to continue.
With multiple alternate wave counts.
Price remains contained within the channel. A long position entered about here or any time price nears the lower edge of the channel on hourly charts, if the trend remains up that should become profitable quickly.
Stops may be set a little below the channel.
Either hedge your position, or wait for clarity. Hedging would give a better entry.
Short positions must have stops reasonably above 1,357.09. Longs can have stops a little below 1,324.93 or just below the channel.
And the channel may now be in the process of being breached. We have a full hourly candlestick below and not touching it.
If this current hourly candlestick can close remaining below the channel then it will be breached.
First requirement for some confidence in a trend change may then be had.
Next we need to see a new low below 1,324.93. And that’s not far away.
In consideration of a comment from Annapanna and looking back at my Grand Super Cycle analysis, I will add another alternate.
It is possible that Grand Super Cycle IV may have been over at end November 2015 as a quick double zigzag lasting only 4 years.
That would be half the duration of Grand Super Cycle II which lasted 8 years (1923 to 1931) and was also a zigzag.
And all assuming that my Grand Super Cycle analysis up to the end of III is correct.
Thank you Lara and thank you Annapanna.
I believe, this would make sense especially when we consider the overall bullishness in the equity markets as well as Prechter’s expectation of a long-overdue, huge post 5th wave correction in the indexes.
http://www.foxbusiness.com/markets/2017/11/01/bear-market-that-will-make-its-mark-is-looming-ahead-robert-prechter.html
That assumes that $GOLD and the S&P500 or DJIA are correlated. Not a safe assumption, because the math shows it’s not true.
It’s why I always leave the correlation co-efficient at the bottom of my daily TA chart. The S&P500 and $GOLD simply do not have any reliable correlation.
And so I analyse each of these two markets separately and independently.
As always very true indeed.
The general logic is that money needs to find something to go into. But, you are right. It need not necessarily go into gold or into any commodities, for that matter.
Lara,
When the E wave of a contracting triangle overshoots the A-C trendline, how far will it go, please? 2bars or 3 bars or more? In any time frame?
Also, a normal 5th wave would be 0.382 or 0.618 of wave 1 through wave 3. Proportions of 1.0 and above are extended, correct?
Thank you kindly.
1. The overshoot should be small and quick. On the daily chart there should not be a proper breach, price should reverse quickly so only one daily candlestick overshoots the line, and does not breach it.
Breach = full candlestick beyond a point.
Overshoot = candlestick wick beyond a point.
2. Most common Fibonacci ratio for a fifth wave is equality with the first wave. Next most common ratio is 1.618 the first or 0.618 the first (if the first wave was extended).
Thank you so, so much Lara. You really are a great teacher.
“I fear not the man who has practiced 10000 kicks once, but I fear the man who has practiced one kick 10000 times”-Bruce Lee. I intend practicing the triangular kick 😀
And, thanks a ton for the distinction between breach and overshoot. I was way off – my mental image of “overshoot” as it now turns out is actually a “breach”. Thanks again.
My notes on the 5th wave incorrect, too 🙁 Honest to God, the so called Ellioticians out there are so pathetic. I need to scrap all my previous notes on EW.
Thank you kindly.
to be fair, that is my own personal definition of “breach” and “overshoot” I think
so certainly open to debate and revision if I see a better way
there is a classic TA approach that uses the “three day away” approach: which would be more than my breach, it would need three days beyond a point before a change or breakout is accepted as valid
I shall stick with your definition until someday, someone proves it to be otherwise.
Me too. It makes sense doesn’t it, and seems a reasonably logical definition 🙂
Lara
Did you removed Bitcoin analysis from the site?
If not can you please add Bitcoin in “Analysis” tab along with gold,silver and oil. Please!
I could not find Bitcoin wave analysis.
Look at the drop down menu under “Categories” on the right column if using a Computer. May be at the bottom with a mobile. The look has been streamlined 😎
As Dreamer said.
We changed “categories” from a long list that took up lots of space, to a drop down menu.
It’s still there.
Dreamer, thank you for your response and for pointing out the correlation between XAUJPY and XAUUSD. Indeed, this was the reason me asking the question. Looking at the XAUJPY chart and seeing what most obviously looks like a bullish symmetrical triangle consolidation pattern, with perfect a-b-c waves within in place, I have a very hard time picturing the scenario that Lara’s main analysis describes.
I am also confused by Lara’s statement of second waves being deep and longer lasting, while fourths quick and shallow in Gold. Are we not somewhere in a Super Cycle Wave IV right now? If Lara’s main count is correct and the anticipated c wave is expected to last one to several years in addition to the 6+ years since the 2011 top, and considering that the main count expects a bottom below 500, the ongoing fourth wave correction is definitely neither short nor shallow.
It’s still a Grand Super Cycle correction, and they should last generations.
However, you have a point in that my Grand Super Cycle wave II was only 1923 to 1931, only 8 years.
So I should be considering the possibility that Grand Super Cycle IV could have been over at the last low in November 2015 lasting only 4 years.
S&P, Oil, and Gold all look overly bullish. Time for corrections?
Thanks for sharing Dreamer.
Gold could certainly go up more though, it’s <90%.
But those indices, wow! That's extreme.
Annapanna / Lara, all,
Put this together so that we could all picture the USDJPY triangle that you refer to and the correlation.
My thoughts are on the chart. Hope this helps. Discussion welcome
https://www.tradingview.com/x/YkfJ8Mzc/
Thanks Dreamer.
I wish StockCharts had XAUJPY data.
Without access to that data I can’t do any analysis on it Annapanna.
I would also prefer to see the correlation coefficient, to see an accurate mathematical measurement of presence or absence of correction, rather than make any assumptions.
Updated hourly Gold chart:
It’s possible that Gold did a typical curved impulse down.
But it does look better as a three.
Bottom line still is that we have zero confidence in a trend change. Price remains within the channel and above 1,324.93.
The move down in the USD looks incomplete. That said, a bounce up looks due for about 2 weeks.
Although the correlation between USD and Gold is inconsistent, I think this along with Lara’s Gold analysis likely helps to confirm a top in Gold is due. Whether this is the start of a big move down is unclear. I think the USD has more down to go after this correction, so Gold may yet move to new highs after it corrects. Let’s see.
https://www.tradingview.com/x/YkfJ8Mzc/
JUST A VIEW: Gold trend strength is really strong with ADX on the daily knocking at 48+ and no signs of flattening out just yet. Weekly Stochastic remains bullish and there is no let up in monthly bullish stochastic also; suggesting further price rise. Gold price appears to be consolidating around 1332. Imo lucky if we get a dip for 1328. Unless something changes (a break below 1310?), it appears that Gold price has a long way up to go yet with no signs of topping (or weakness) seen so far. Hope to continue to remain on the right side of this lol 🙂
There is no confirmation that a bottom is in, but I think it might be. If there is a triangle as shown in the middle of wave Y, the sharp move down yesterday may be the bottom. The candle has a long bullish tail. At -48.3%, this appears to be a typical deep correction, but of course it could go lower.
One bearish thing to consider is that the correction broke below the daily trend channel since Sept that Lara included as part of her last analysis.
We’ll need to see what happens over the next few days.
Any thoughts?
https://www.tradingview.com/x/QqUgsNDV/
It could also be an incomplete A-B-C correction, rather than W-X-Y.
Where you have the triangle within your Y could be a small series of 1-2, 1-2 and now to move down in the middle of a third wave.
But the problem here is the volume of Bitcoin probably isn’t sufficient for a decent EW analysis. So it must come with that caveat.
Yes, Bitcoin is very risky and unpredictable.
I’m considering trying a very small short position here, with funds I’ll lose no sleep over in losing.
If it sticks, then it could be very profitable. The 0.618 Fibonacci ratio for BTC is about $5. That’s a difference today of $10,958 (about).
If BTC makes a new ATH I’ll try again later on.
Main BTC wave count:
Alternate BTC count:
I favour neither
Lara, thanks for the charts. I wasn’t even going to attempt a long term chart. That said, I agree that we are likely at a tipping point. There’s likely one more move to new highs or at 48% down so far, there is a long ways to go in a major crash, i.e. tulip mania.
Seems that Bitcoin is just now entering the general public discussion stage, so one more new high may be coming.
No bottom yet. Bitcoin made another new low 🤯 Good thing I’m just watching!
NGAS TA:
volume looks strongly bearish at this time frame
but short term the picture is still bullish
to compliment Dreamer’s excellent EW analysis of NGAS
Thank you Lara, much appreciated!
Lara, I think that putting the EW analysis of the current situation in the PM complex into a context other than the USD could help to determine which wave count is the most likely. What is your opinion about the triangle unfolding in XAUJPY?
I think you might be assuming that XAUUSD and XAUJPY are correlated?
They may not be.
But that’s not a question I can answer, because StockCharts do not have XAUJPY data. Nor does BarChart.
And so I cannot answer your question about a triangle either in XAUJPY.