
A breach of the channel on the hourly charts indicated the upwards trend has ended, at least for the short term.
Summary: Look now for price to move either lower for a pullback or sideways for a multi week consolidation that may last about 8 to 12 weeks.
All wave counts expect that price may not make a new high above 1,357.09.
New updates to this analysis are in bold.
Last monthly charts for the main wave count are here, another monthly alternate is here, and video is here.
Grand SuperCycle analysis is here.
MAIN ELLIOTT WAVE COUNT
WEEKLY CHART
Click chart to enlarge.
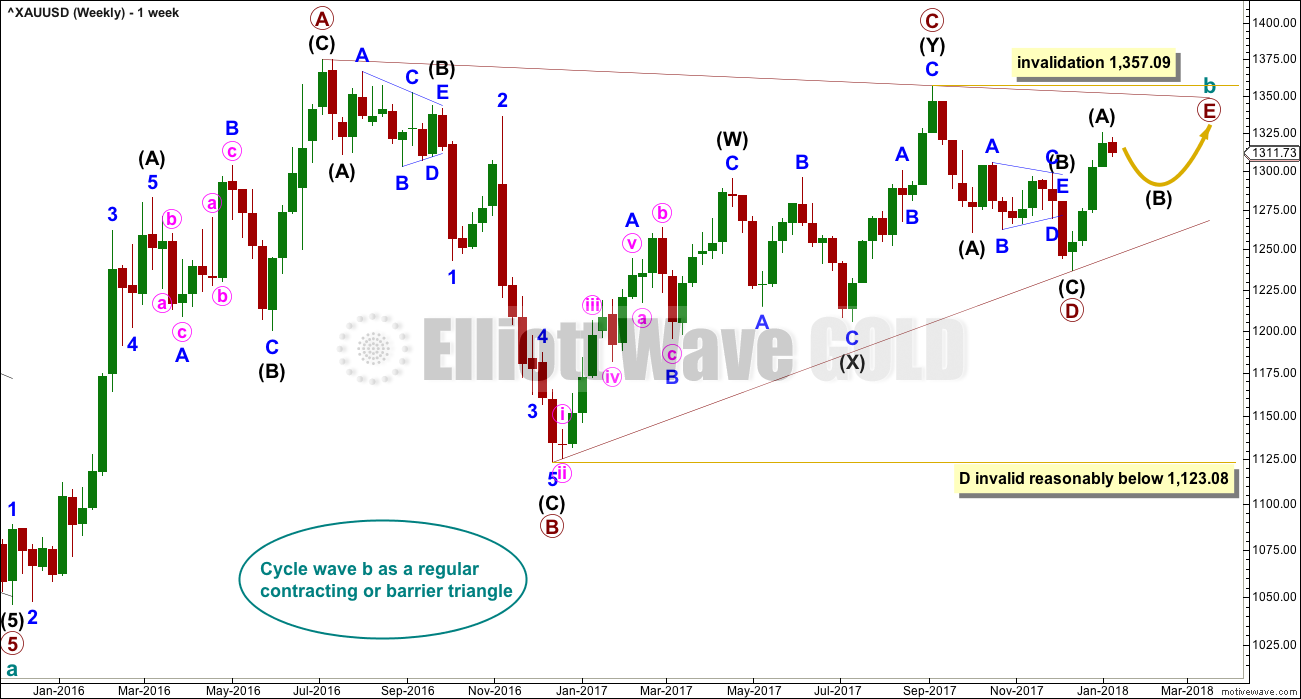
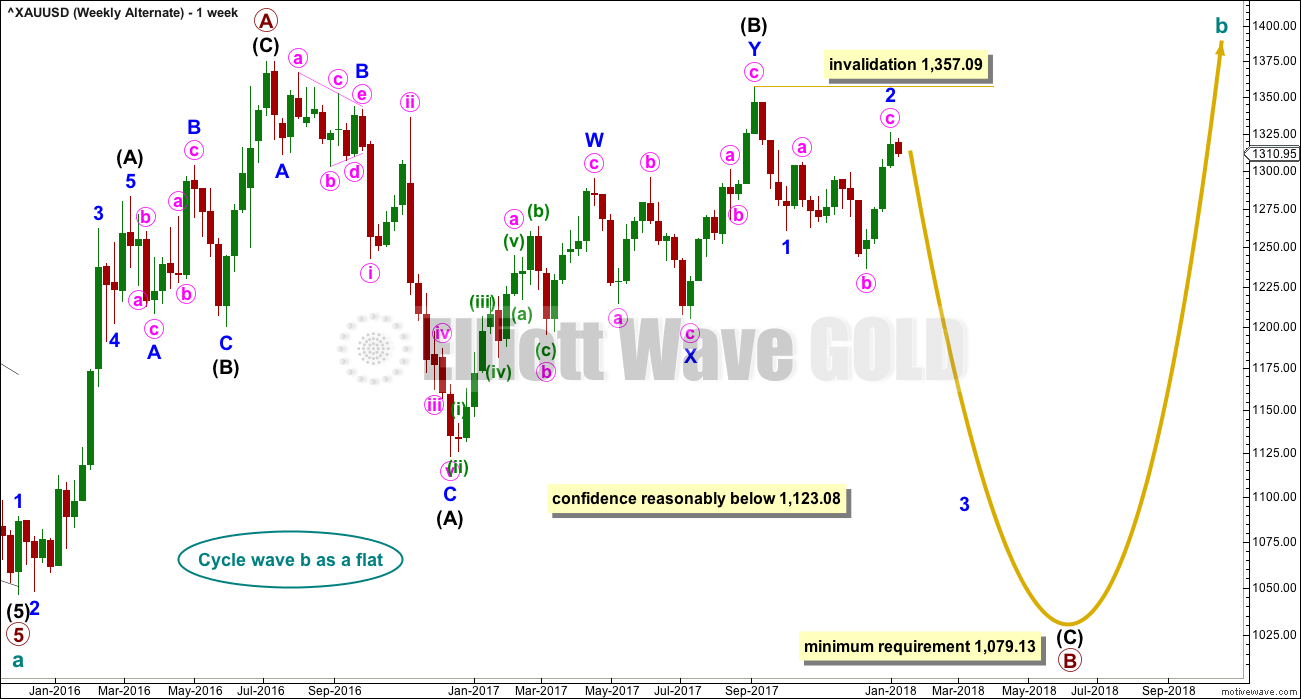
All wave counts expect that Gold completed a large five down from the all time high in November 2011 to the low of December 2015, which is seen on the left hand side of both weekly charts.
If this analysis is correct, then the five down may not be the completion of the correction. Corrective waves do not subdivide as fives; they subdivide as threes. The five down is seen as cycle wave a within Super Cycle wave (a).
All wave counts then expect cycle wave b began in December 2015.
There are more than 23 possible corrective structures that B waves may take. It is important to always have multiple wave counts when B waves are expected.
It looks unlikely that cycle wave b may have been over at the high labelled primary wave A. Primary wave A lasted less than one year at only 31 weeks. Cycle waves should last one to several years and B waves tend to be more time consuming than other Elliott waves, so this movement would be too brief for cycle wave b.
This wave count looks at cycle wave b to be most likely a regular contracting triangle.
The triangle trend lines have a normal looking convergence. Primary wave D now looks fairly likely to be complete, and it looks like an obvious three wave structure at the weekly chart level.
Primary wave E should also be most likely to look like an obvious three wave structure at the weekly and daily chart levels. That means that within it intermediate wave (B) should be fairly time consuming.
Primary wave E would most likely end reasonably short of the upper A-C trend line. If it does not end there, then the next less likely place for it to end would be with a slight overshoot of the A-C trend line.
When primary wave E is complete, then the whole structure for cycle wave b may be complete. At that stage, a downwards breakout would be expected.
Primary wave E may not move beyond the end of primary wave C above 1,357.09.
To find out how long the current intermediate wave (B) within primary wave E may last, we may look back to other B waves within this large triangle of cycle wave b. Within primary wave A, intermediate wave (B) lasted 12 weeks. Within primary wave B, intermediate wave (B) lasted 10 weeks. Within primary wave C, intermediate wave (X) (the equivalent position to a B wave) lasted 12 weeks, and within primary wave D, intermediate wave (B) lasted 9 weeks.
The current intermediate wave (B) that has just begun within primary wave E may be expected to last about 8 to 12 weeks.
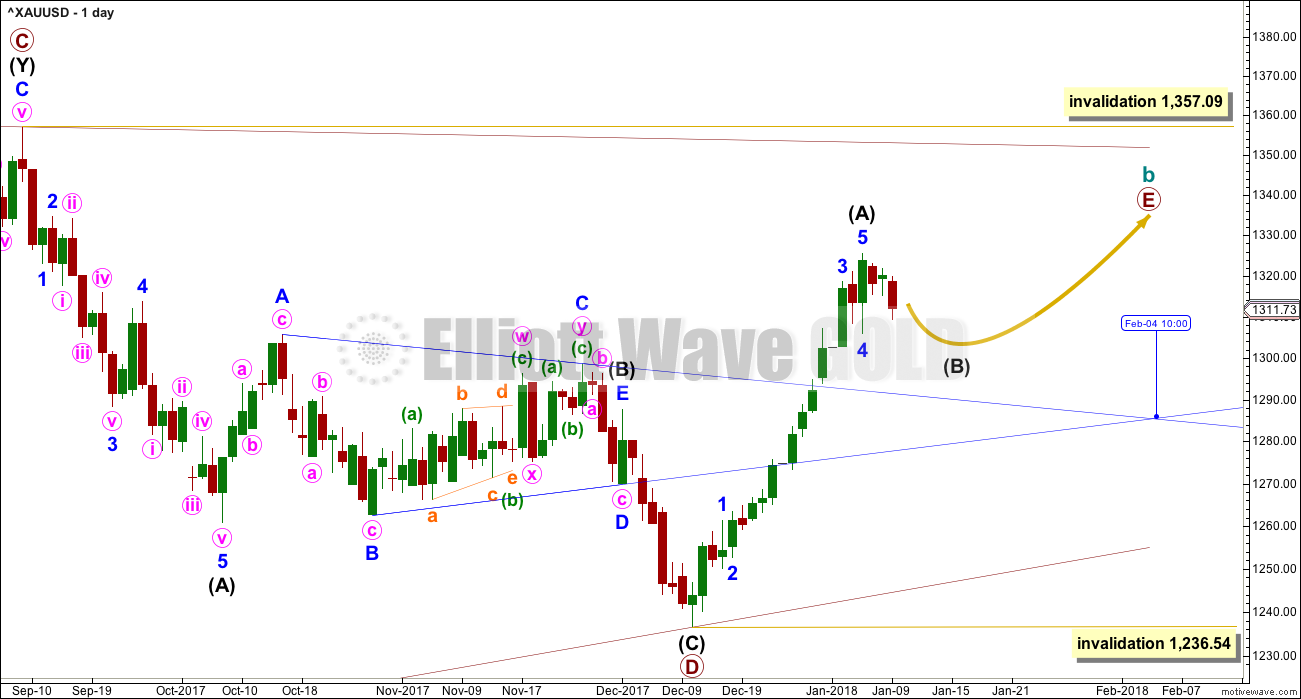
FIRST DAILY CHART
Click chart to enlarge.
This first wave count follows on directly from the weekly chart above. It looks at primary wave E underway as a single zigzag. Zigzags subdivide 5-3-5. So far only wave A of the zigzag of primary wave E may be complete.
Intermediate wave (B) may have now just begun and may be reasonably expected to last about 8 to 12 weeks.
Thereafter, intermediate wave (C) should move higher to end above the end of intermediate wave (A) to avoid a truncation.
The trend lines of the triangle of intermediate wave (B) within primary wave D are extended outwards. The point in time at which triangle trend lines cross over will often see a trend change (although not always a major trend change). That may be the point in time at which primary wave E ends, or it may be where intermediate wave (B) within primary wave E ends. At today’s calculation that would be on the 4th of February.
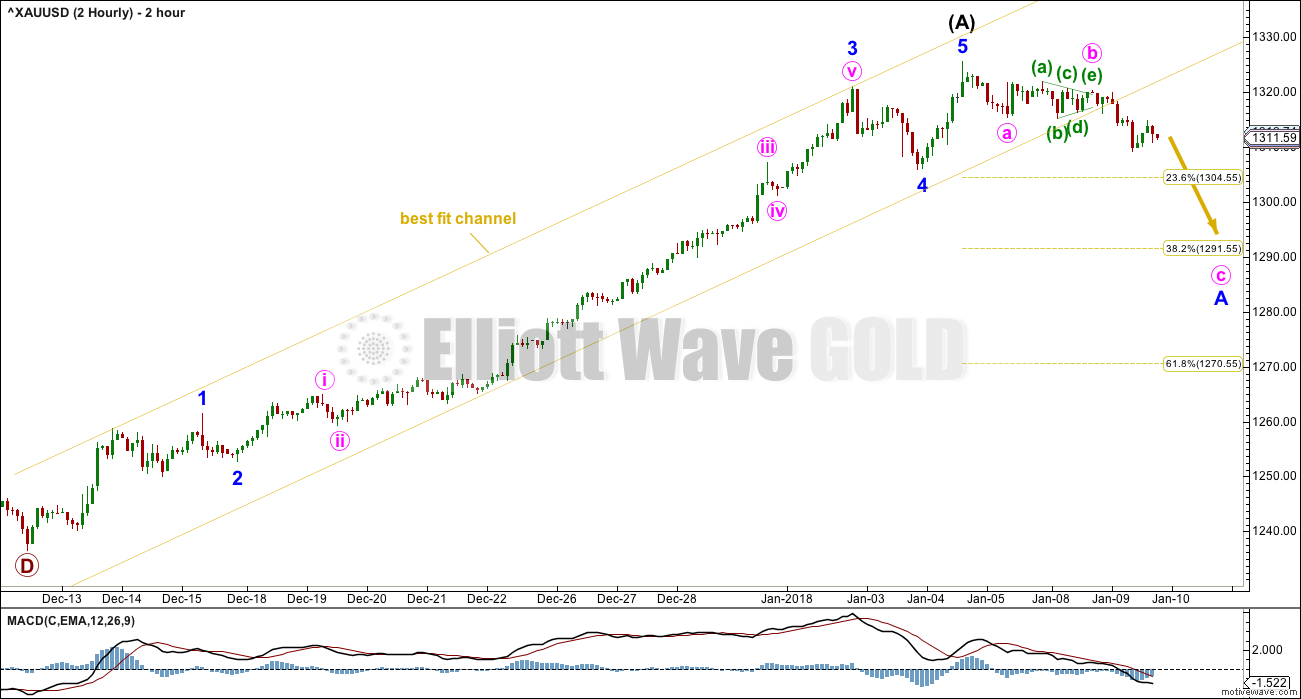
2 HOURLY CHART
Click chart to enlarge.
Price has broken clearly below the lower edge of the best fit channel that contains all of intermediate wave (A) upwards.
Targets for intermediate wave (B) to end may be either one of the three Fibonacci ratios of intermediate wave (A).
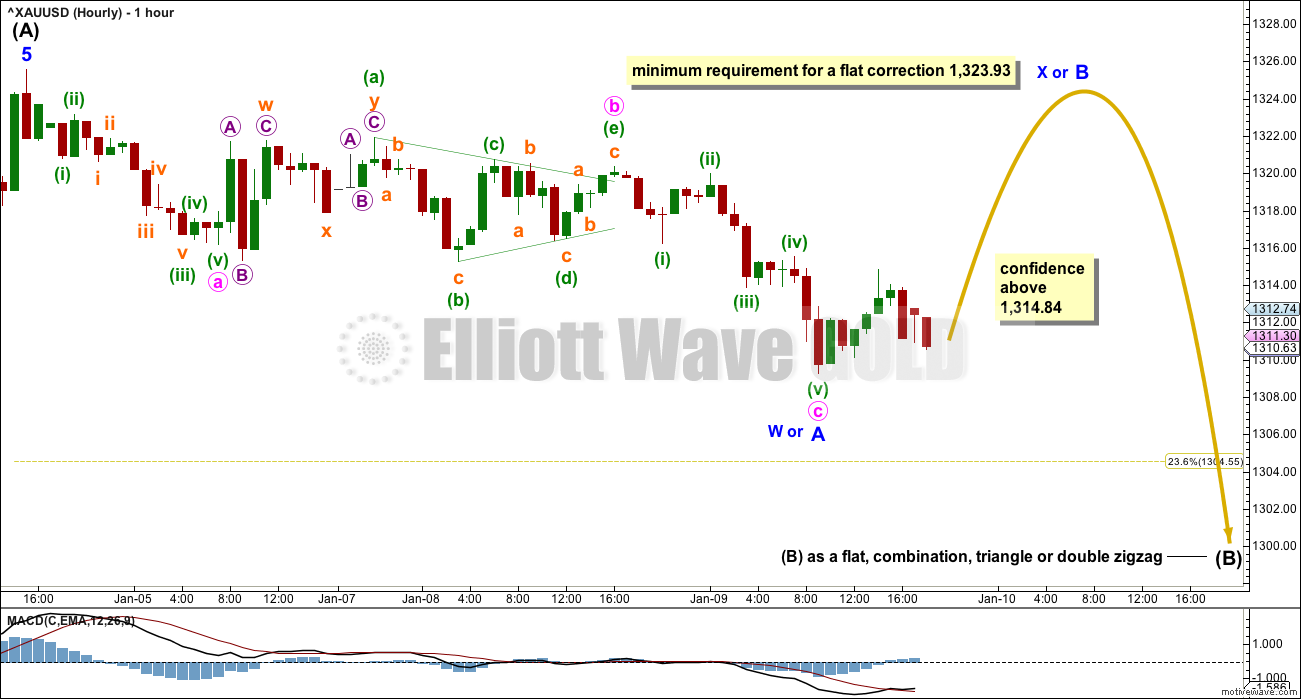
HOURLY CHART
Click chart to enlarge.
There are more than 23 possible corrective structures that B waves may take. It is impossible to tell until they are almost complete which structure is unfolding. Analysis during B waves should focus on identifying when they are over and not on trying to pick each little swing within them.
B waves are analogous to typical range bound consolidations or sharp pullbacks.
This first hourly chart looks at the possibility of a flat, combination, triangle or double zigzag. All of these structures begin with a three wave structure for wave A or W.
A new high in the short term above 1,314.84 would indicate one of these structures may be unfolding for intermediate wave (B).
ALTERNATE HOURLY CHART
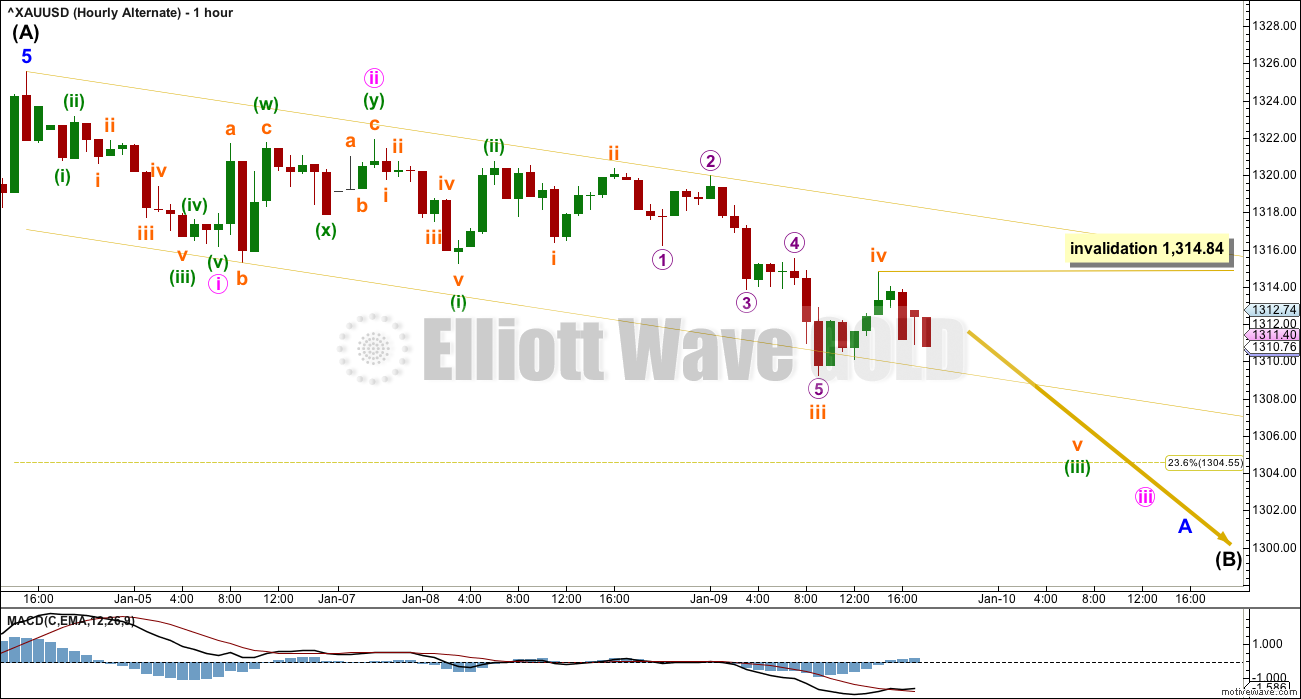
Click chart to enlarge.
It is also possible that intermediate wave (B) may be a quicker and sharper pullback, an Elliott wave zigzag.
Zigzags subdivide 5-3-5. Minor wave A may be an incomplete impulse.
Within the impulse, the middle of minor wave A may have passed. Within subminuette wave v, no second wave correction may move beyond the start of its first wave above 1,314.84.
SECOND DAILY CHART
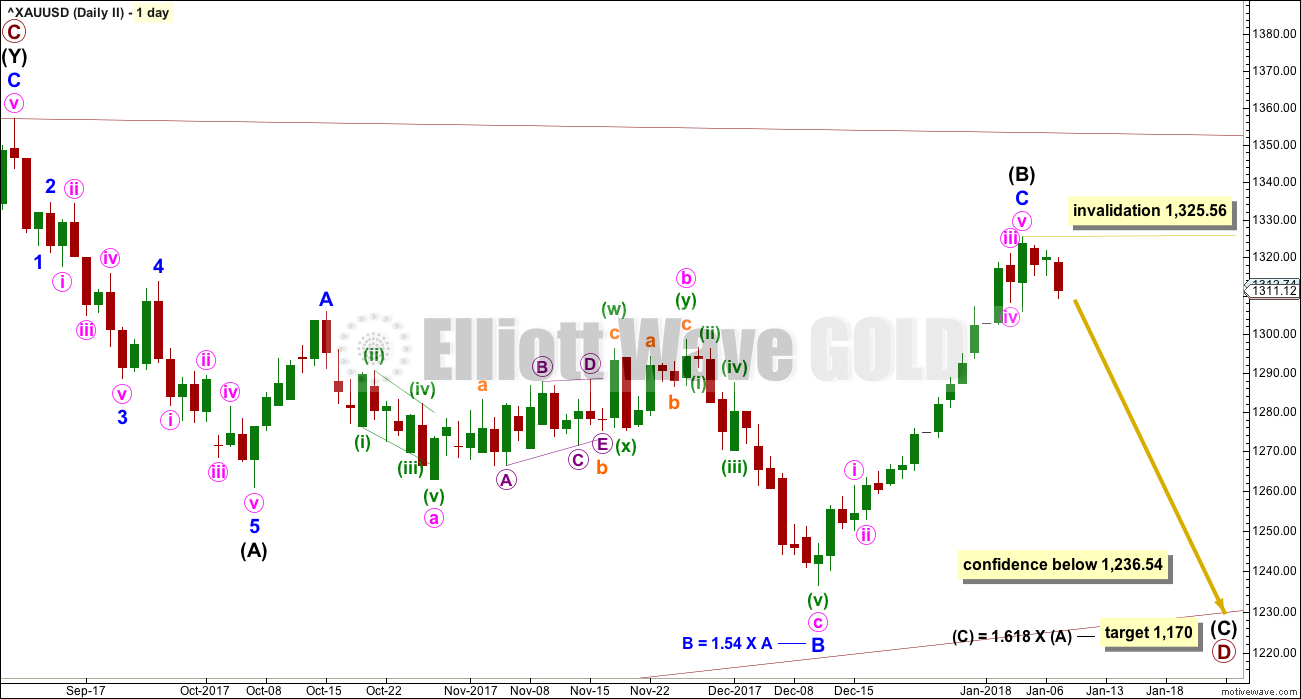
Click chart to enlarge.
It is possible that within the large triangle for cycle wave b primary wave D may still be incomplete. Within primary wave D, intermediate wave (B) may be complete as a flat correction.
The target for intermediate wave (C) would see primary wave D have a normal length to primary wave C.
Intermediate wave (B) should now be over and intermediate wave (C) should now have begun. Within intermediate wave (C), no second wave correction may move beyond the start of its first wave above 1,325.56.
ALTERNATE ELLIOTT WAVE COUNT
WEEKLY CHART
Click chart to enlarge.
All wave counts are identical to the low labelled cycle wave a. Thereafter, they look at different possible structures for cycle wave b.
Cycle wave b may be a flat correction. Within a flat primary, wave B must retrace a minimum 0.9 length of primary wave A at 1,079.13 or below.
Within intermediate wave (C), minor wave 2 may not move beyond the start of minor wave 1 above 1,357.09.
TECHNICAL ANALYSIS
WEEKLY CHART
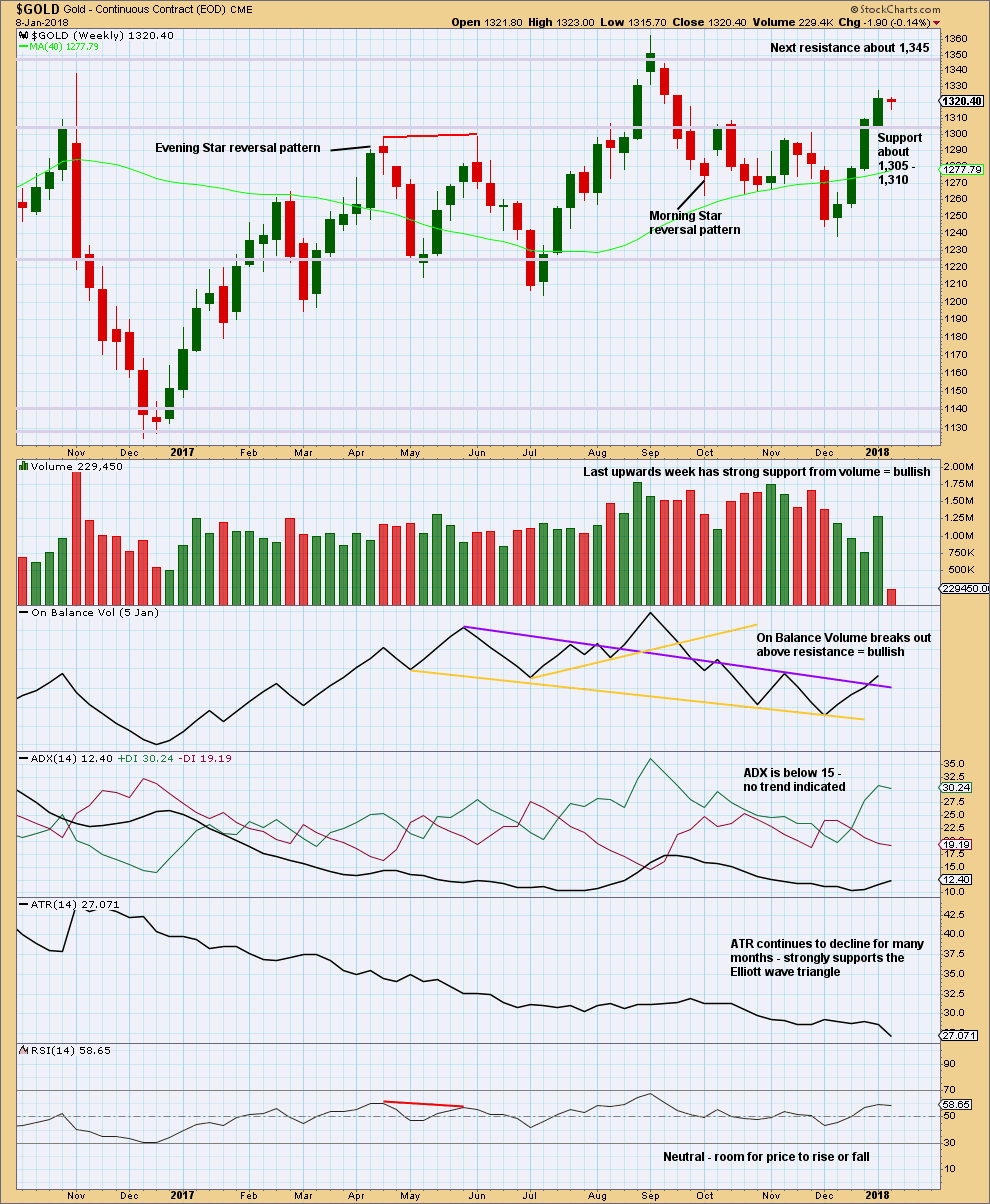
Click chart to enlarge. Chart courtesy of StockCharts.com.
Now that price has again broken above resistance at 1,305 to 1,310, that area may now provide support. Next resistance is about 1,345.
DAILY CHART
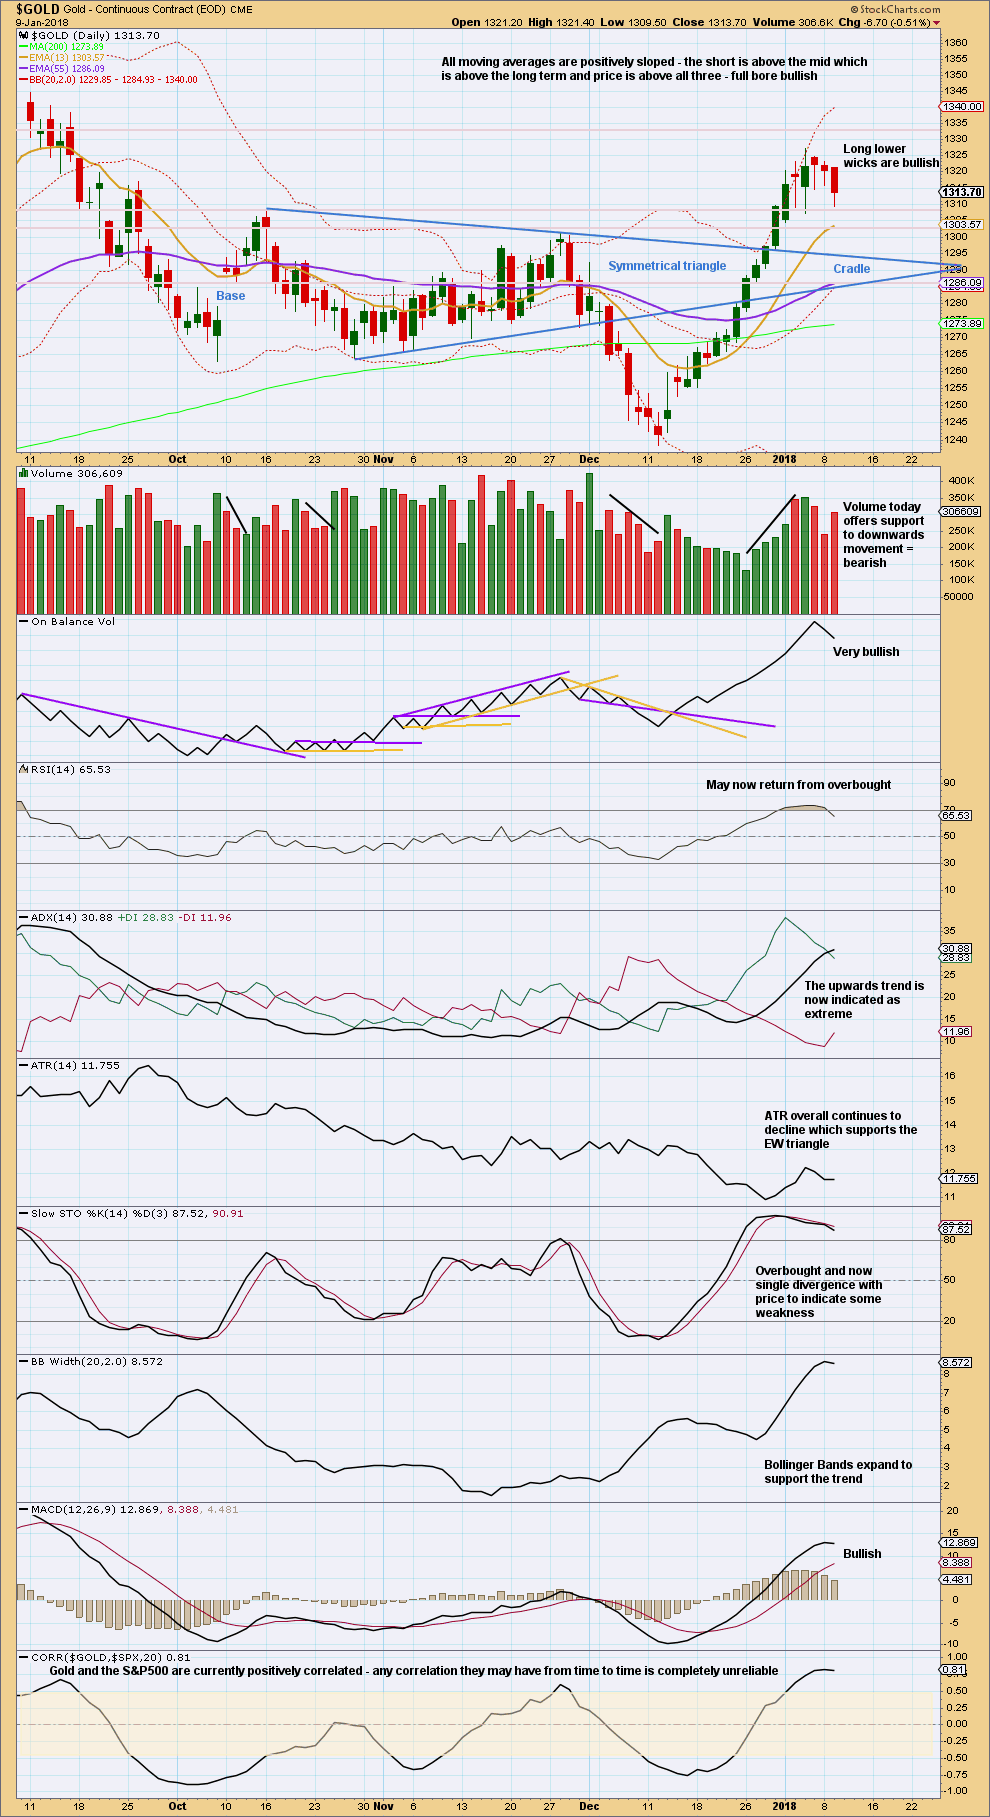
Click chart to enlarge. Chart courtesy of StockCharts.com.
Finally, the trend is indicated as extreme as the ADX line crosses above both the +DX and -DX lines.
Some support today from volume for downwards movement indicates a pullback or consolidation may continue here.
GDX DAILY CHART
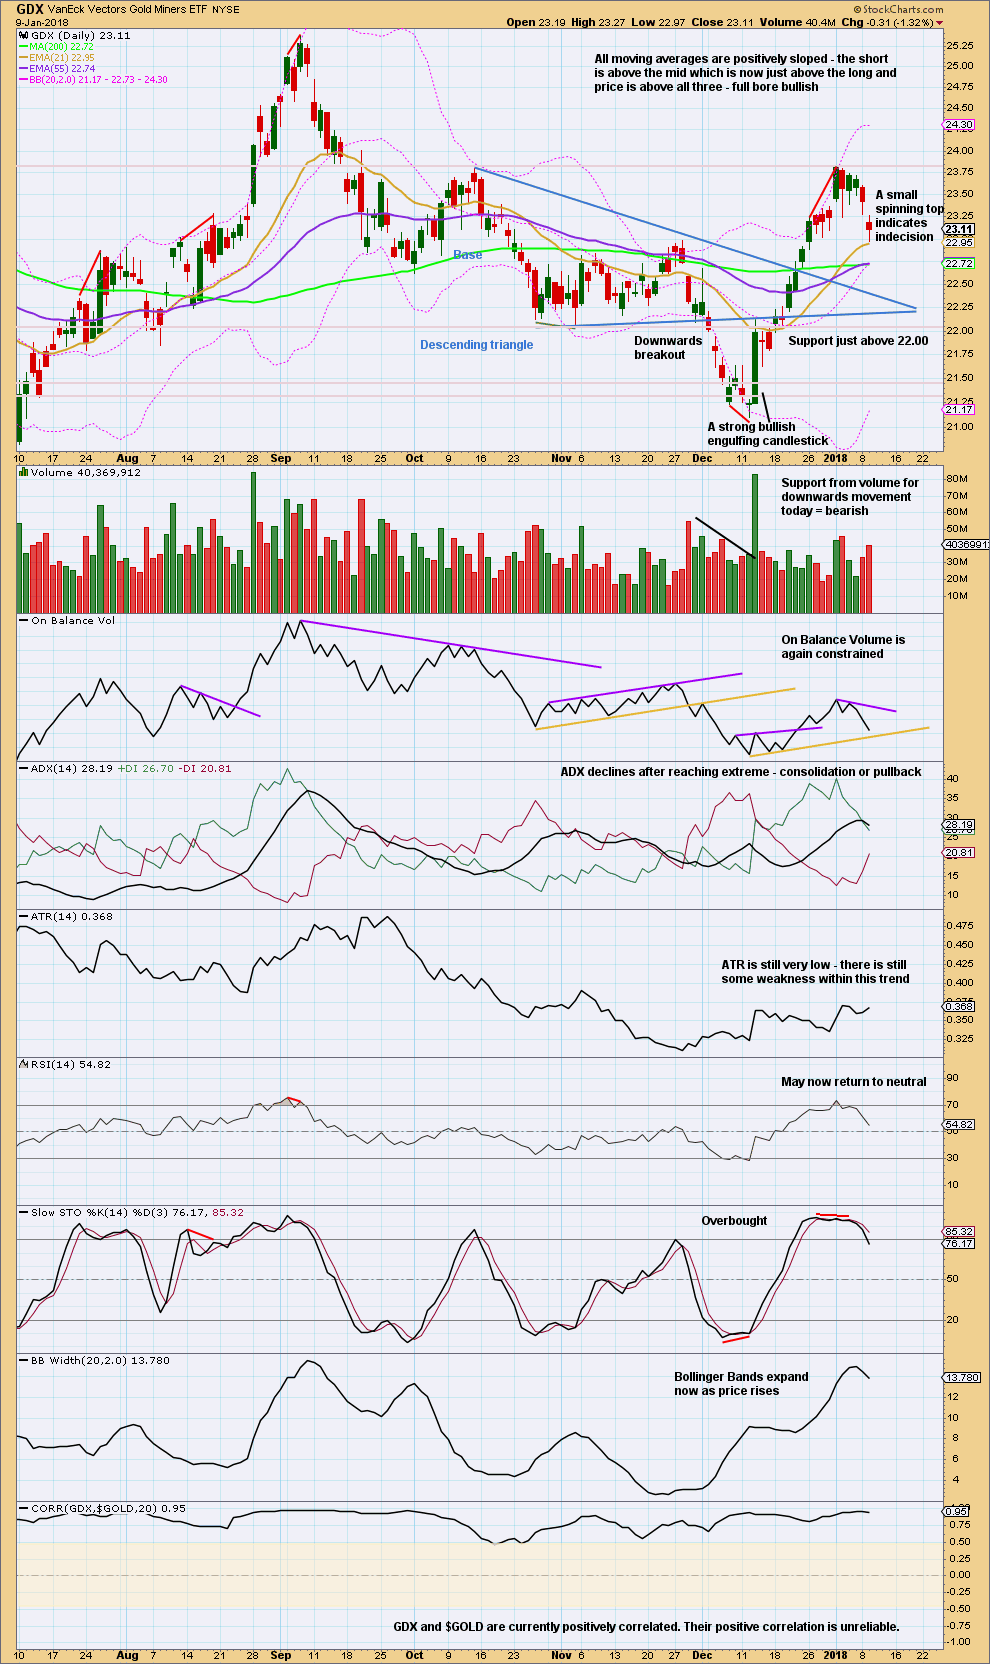
Click chart to enlarge. Chart courtesy of StockCharts.com.
It looks like GDX too has either ended its upwards trend, or has begun a consolidation or pullback here. Look for support just above 22.00.
Published @ 07:37 p.m. EST.
Hourly chart updated:
A regular flat may be unfolding. I’m moving the degree of labelling down, looking at this being only minor wave A of a larger flat or triangle for intermediate wave (B).
It could also be minor wave W of a double flat, but those are so very rare, I’ll only chart it if it shows itself to be true.
Choppy overlapping sideways movement to complete a flag or triangle for this week and next week, possibly into the week after. Then an upwards breakout. In more normal TA terms.
I think this could be the last 5 up of in Intermediat A rather than minor B in a flat?
well, yes, it could be
but the proportions would look pretty awful, and the channel about intermediate (A) was breached
so I’d rather see this new sideways move as the start of wave (B)
What’s with Lara and Gold? As soon as she comes back, gold decides to change colors!
Just wondering what is the next support level for Gold price below 1308. Pullback is expecting. Also expecting Silver to pullback for deeper decline which should help drag Gold price down with it. Do we get Gold price to break below 1300 today? Let’s see how this pans out. Lots of wave count choices out there. 2 hourly appears to in play. GL everyone!
I can see the next support about 1,286
Lara,
I noticed that recently the “Home” tab was removed from the menu at the top of the web page. It’s not a big deal when I view EWG on my PC as I can click on the logo to get to the home page.
The issue is when I view the webpage on my iPhone or iPad. The logo bar is not visible on a mobile device and with no “Home” tab on the menu, it’s not easy to get to the Home page.
Can the “Home” tab be added back? or do you have another solution? Thanks,
Cesar’s seen your comment and we will find a solution.
Thank you for bringing this to our attention. I will add the home tab back to the main navigation menu. Cesar.
Thank you 😊
Hey David, lol when I read your post about taking notes. I have 39 pages in my Word doc with EW notes taken from Lara’s posts.
Oh Wow, Dreamer. That is amazing. It is nice to know that I am on the right track.
I have just one page :-(, but, “The journey of a thousand miles begins with one step”!!!!
Hi Lara, really looking forward to your new Oil analysis to see how high this might go…
great to have you back 🙂
Hi Ursula, it’s great to be back! Working on Oil right now.
Didn’t do it yesterday as it was evening by the time I finished up Gold and the S&P. That was hard and my brain was a bit fried.