
GOLD ANALYSIS
Summary: A consolidation looks likely to have begun, and it may be as time consuming as a Fibonacci 13 or even 21 weeks. It is also possible it may be a quicker sharper pullback. When it is complete, the upwards trend may resume.
A new low below 1,236.54 would indicate Gold remains within a huge bear market. At that stage, new lows would be expected below 1,046.27.
Grand SuperCycle analysis is here.
Last in-depth historic analysis with monthly and several weekly charts is here, video is here.
There are multiple wave counts at this time at the weekly and monthly chart levels. In order to make this analysis manageable and accessible only two will be published on a daily basis, one bullish and one bearish. This does not mean the other possibilities may not be correct, only that publication of them all each day is too much to digest. At this stage, they do not diverge from the two possibilities below.
BULLISH ELLIOTT WAVE COUNT
FIRST WEEKLY CHART
Click chart to enlarge.
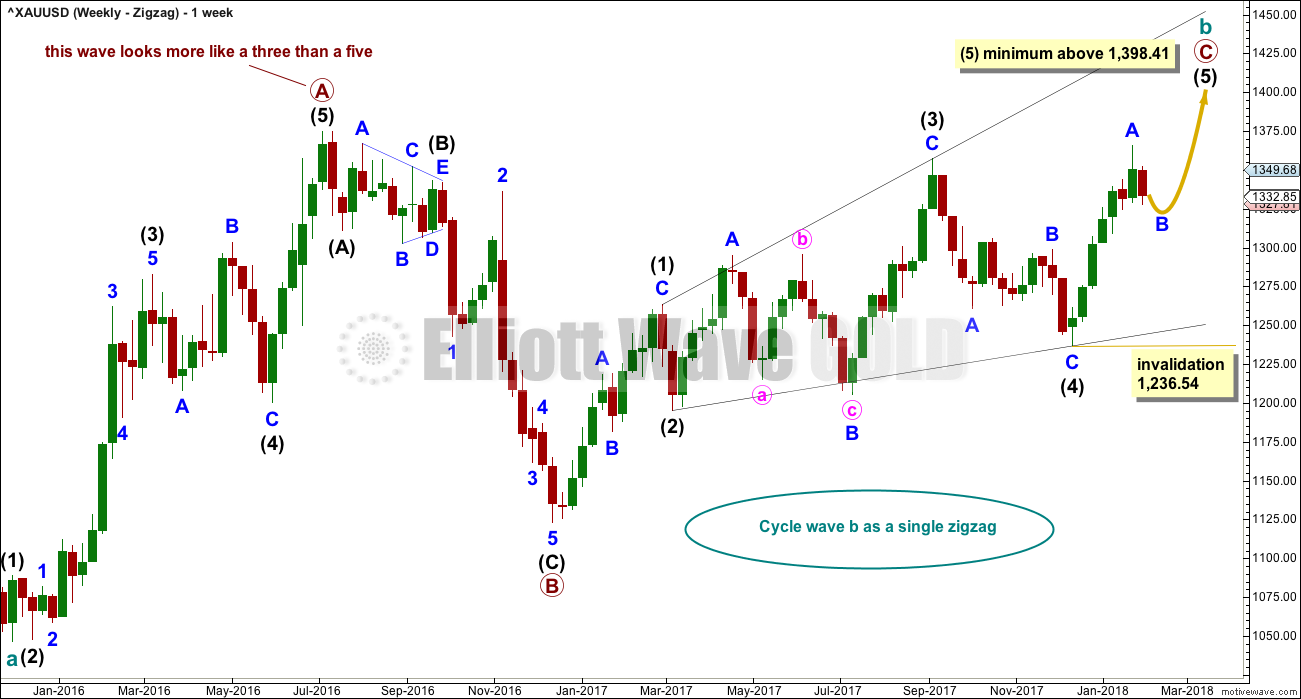
Cycle wave b may be a single zigzag. Zigzags subdivide 5-3-5. Primary wave C must subdivide as a five structure and may be either an impulse or an ending diagonal. Overlapping at this stage indicates an ending diagonal.
Within an ending diagonal, all sub-waves must subdivide as zigzags. Intermediate wave (4) must overlap into intermediate wave (1) price territory. This diagonal is expanding: intermediate wave (3) is longer than intermediate wave (1) and intermediate wave (4) is longer than intermediate wave (2). Intermediate wave (5) must be longer than intermediate wave (3), so it must end above 1,398.41 where it would reach equality in length with intermediate wave (3).
Within the final zigzag of intermediate wave (5), minor wave B may not move beyond the start of minor wave A below 1,236.54.
Within intermediate wave (1), the correction labelled minor wave B was over within one week. Within intermediate wave (2), the correction labelled minor wave B was too quick to be seen on the weekly chart. Within intermediate wave (3), the correction labelled minor wave B was over in 12 weeks, one short of a Fibonacci 13. Within intermediate wave (4), the correction labelled minor wave B was over in a Fibonacci 8 weeks. As each actionary wave is extending in time as well as price, the correction of minor wave B within intermediate wave (5) may be longer than that within intermediate wave (3). At this early stage, a Fibonacci 13 or possibly even 21 weeks may be expected. This expectation is a rough guideline; flexibility is essential when B waves unfold.
This first weekly chart sees the upwards wave labelled primary wave A as a five wave structure. It must be acknowledged that this upwards wave looks better as a three than it does as a five. The fifth weekly chart below will consider the possibility that it was a three.
FIRST DAILY CHART
Click chart to enlarge.
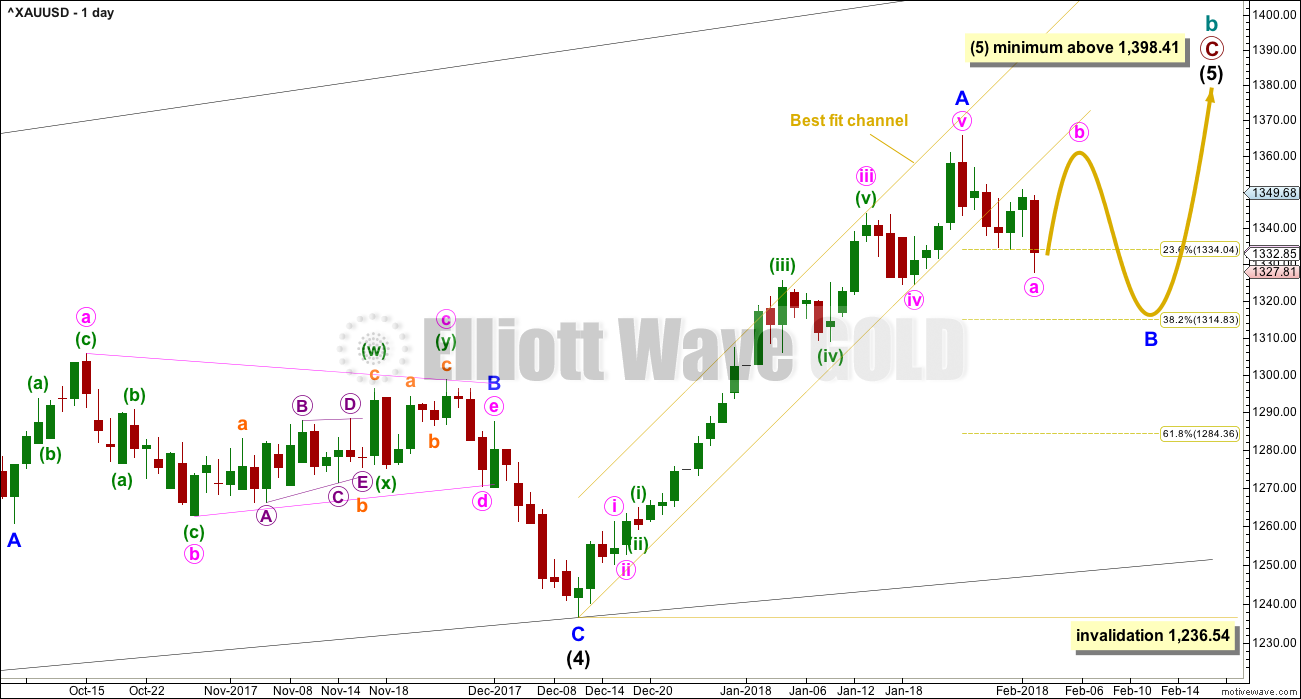
Within the ending diagonal, intermediate wave (5) must sub-divide as a zigzag.
Downwards movement has clearly broken below the yellow best fit channel. This indicates that the upwards wave labelled minor wave A should now be over and the next wave labelled minor wave B may now have begun. Price turned upwards after the breakout to find resistance at the lower edge of the channel, and is now this week moving down and away. This looks like typical behaviour after a breakout.
Minor wave B may be a reasonably time consuming consolidation or a quicker sharper pullback within the upwards trend, and it may end about either of the 0.382 or 0.618 Fibonacci ratios (neither may be favoured).
There are more than 23 possible structures that minor wave B may take, and it is impossible until close to or at the end to have confidence which possibility has unfolded. When B waves unfold, it is essential that analysis is flexible. B waves are analogous to either range bound consolidations or sharp corrections. As minor wave B unfolds, the labelling on the hourly chart for its sub-waves will change and alternates will be required from time to time.
The yellow arrow today outlines one possibility for minor wave B, an expanded flat correction. Members are strongly advised that this outline is only one possibility of many. Expanded flats are very common structures. If minor wave B unfolds as an expanded flat, then minute wave b would make a new high above the start of minute wave a at 1,365.68. Minute wave c downwards may then take price down to about the 0.382 Fibonacci ratio of minor wave A at 1,315.
Minor wave B may also be a triangle, an overlapping sideways movement in an ever decreasing range. At this stage, it may also be a zigzag, a relatively quick and sharp pullback that may end closer to the 0.618 Fibonacci ratio then the 0.382 Fibonacci ratio.
Minor wave B may not move beyond the start of minor wave A below 1,236.54.
BEARISH ELLIOTT WAVE COUNT
FIFTH WEEKLY CHART
Click chart to enlarge.
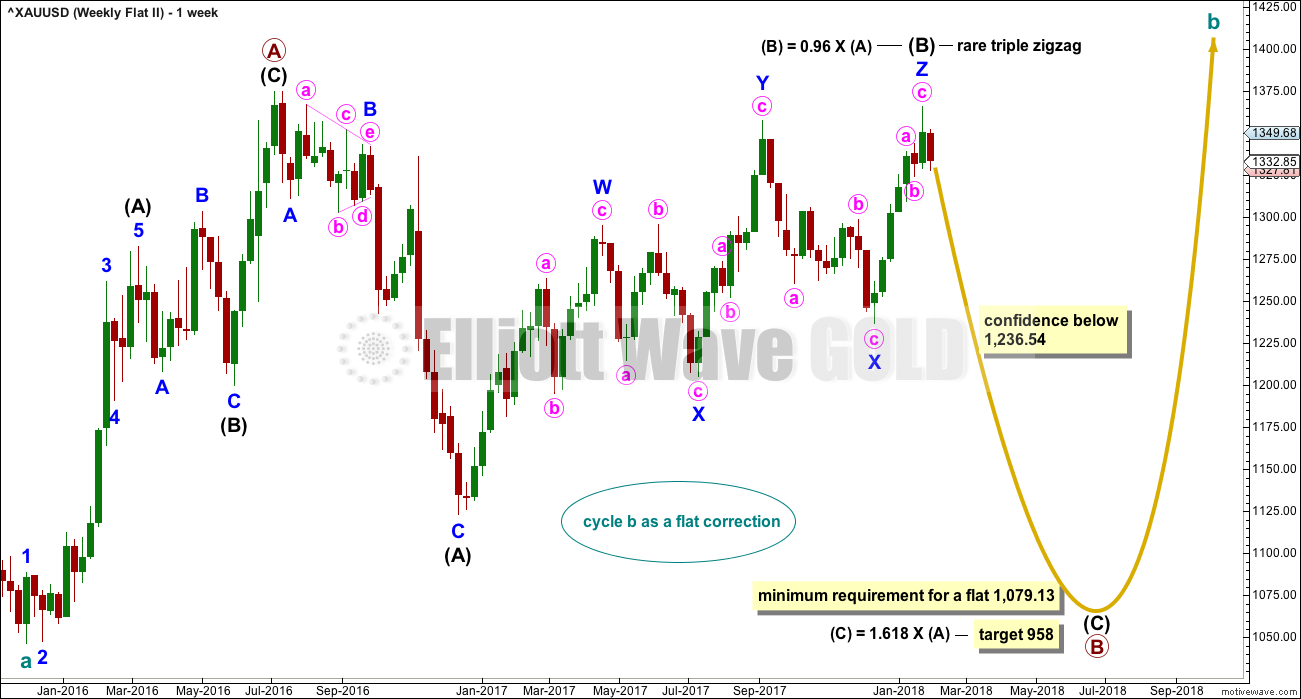
There were five weekly charts published in the last historic analysis. This fifth weekly chart is the most immediately bearish wave count, so this is published as a bearish possibility.
This fifth weekly chart sees cycle wave b as a flat correction, and within it intermediate wave (B) may be a complete triple zigzag. This would indicate a regular flat as intermediate wave (B) is less than 1.05 the length of intermediate wave (A).
If cycle wave b is a flat correction, then within it primary wave B must retrace a minimum 0.9 length of primary wave A at 1,079.13 or below. The most common length of B waves within flats is from 1 to 1.38 times the length of the A wave. The target calculated would see primary wave B end within this range.
I have only seen two triple zigzags before during my 10 years of daily Elliott wave analysis. If this wave count turns out to be correct, this would be the third. The rarity of this structure is identified on the chart.
TECHNICAL ANALYSIS
WEEKLY CHART
Click chart to enlarge. Chart courtesy of StockCharts.com.
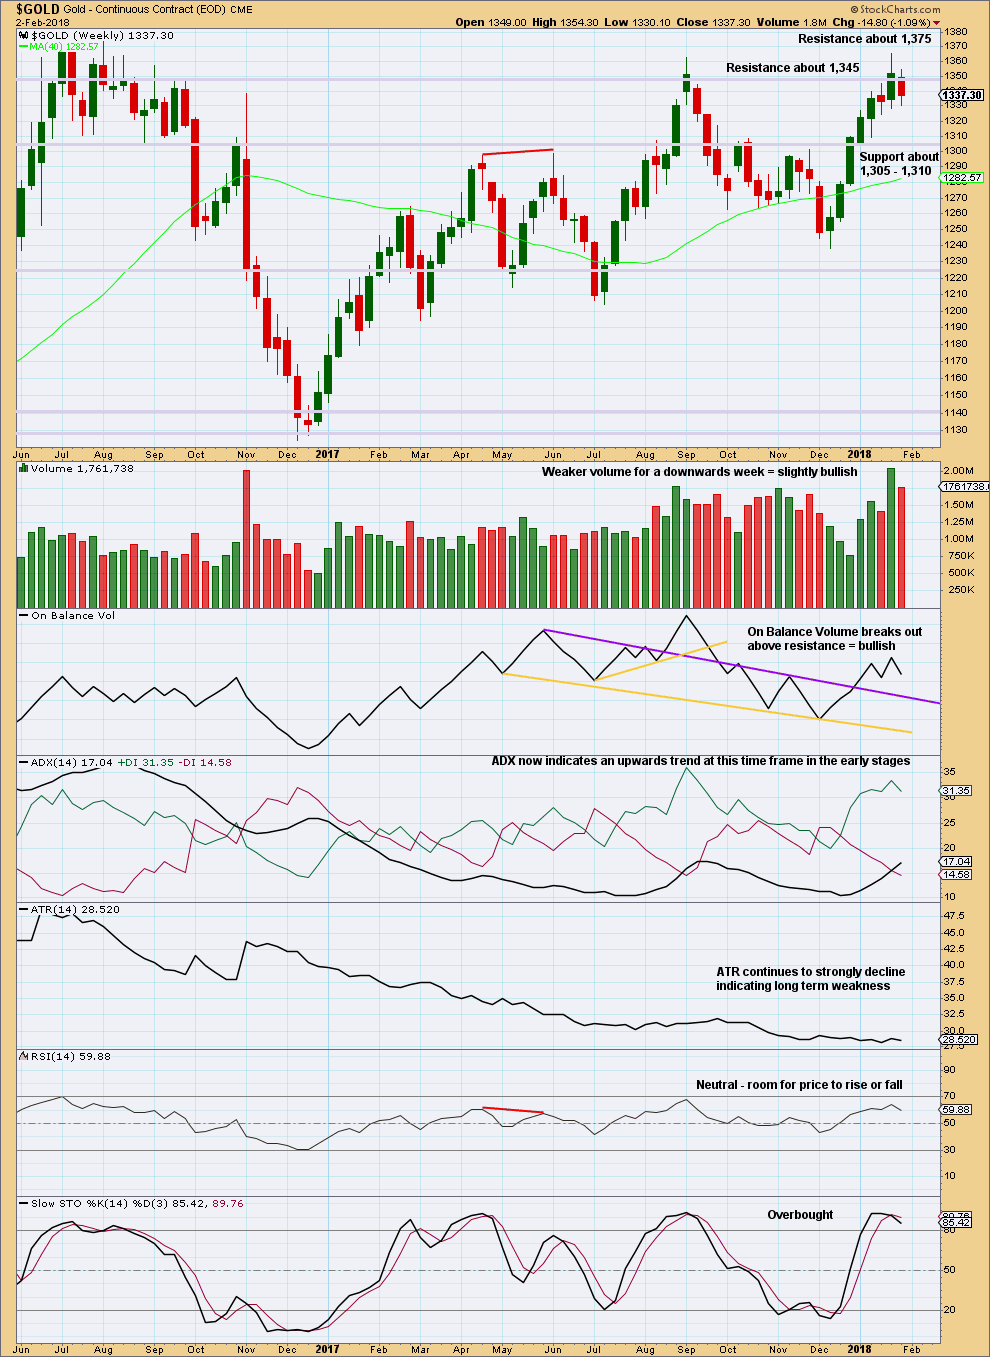
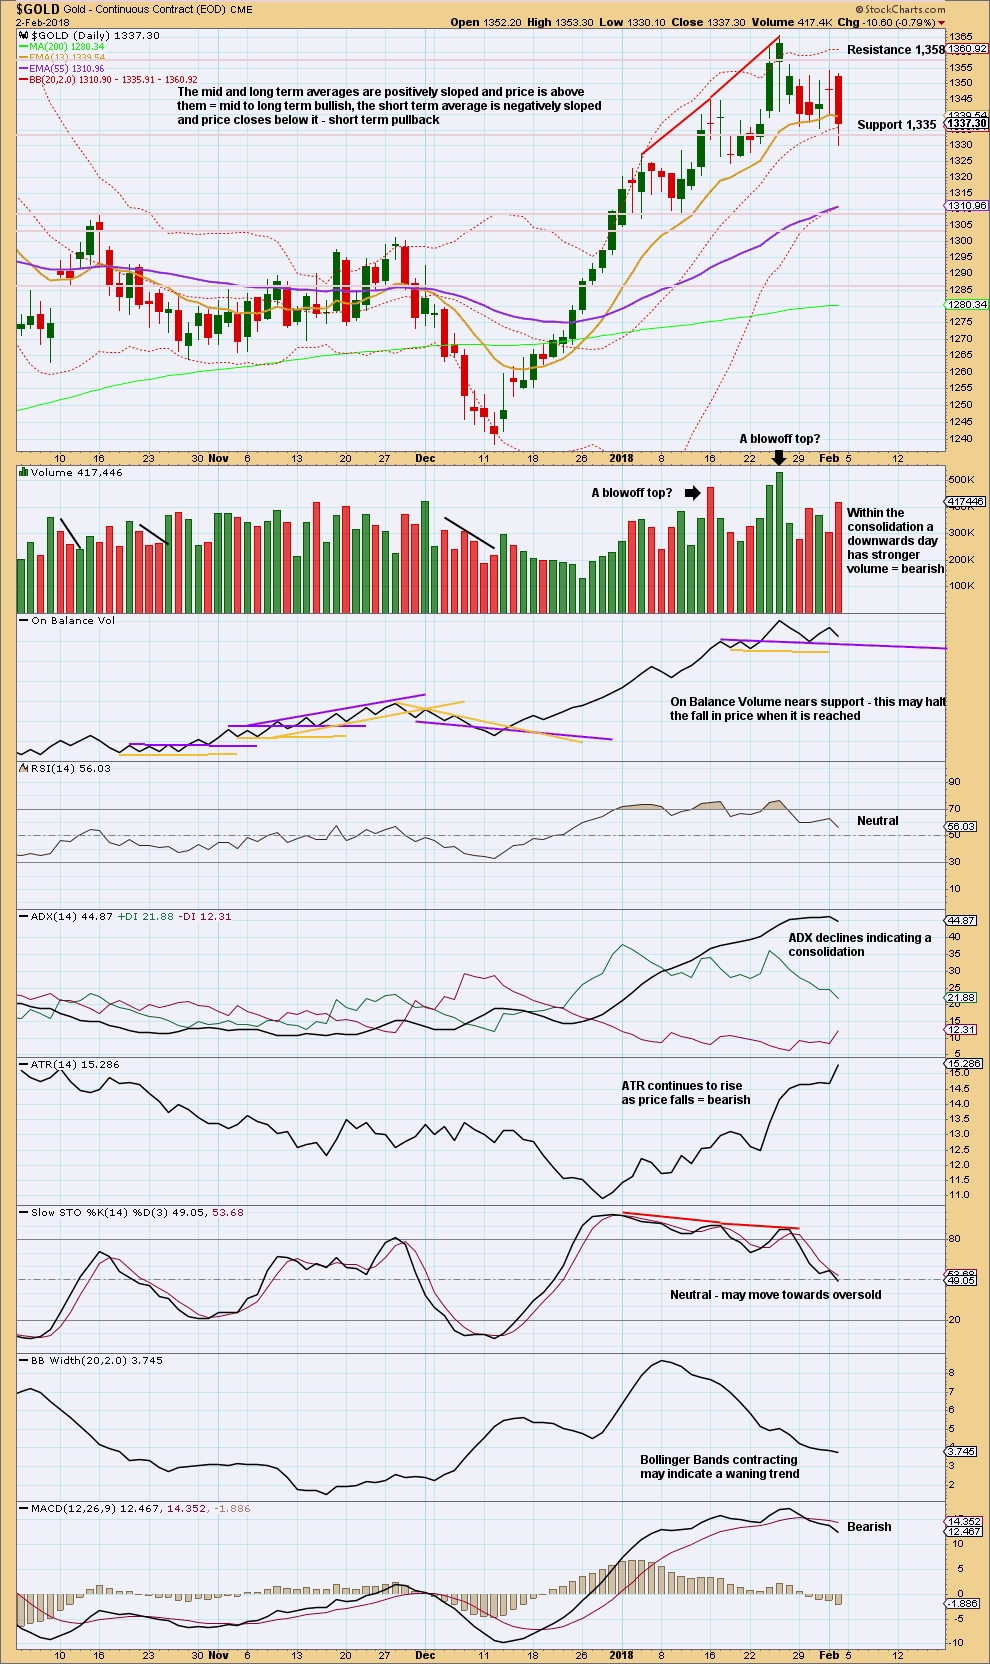
Again, price could not remain above resistance at 1,345 and has closed back below this point. Price remains range bound at this time frame with resistance about 1,378 and support about 1,225. During this consolidation, it is now an upwards week that has strongest volume suggesting an upwards breakout may be more likely than downwards.
Last week’s upwards movement had strong support from volume. This week’s downwards movement does not. The short term volume profile remains bullish.
However, with price at resistance and Stochastics overbought, it would be reasonable to expect an end to the upwards swing here and a downwards swing to support.
DAILY CHART
Click chart to enlarge. Chart courtesy of StockCharts.com.
It still looks like price so far may be in a consolidation within an upwards trend. The volume profile for this smaller consolidation suggests a downwards breakout.
Look for next support about 1,310 – 1,305.
S&P500 ANALYSIS
Summary: Expect more downwards movement to begin next week. The target is at 2,749.
In the short term, a new high above 2,813.04 would indicate the correction may be over and the upwards trend may have resumed. A new all time high would add significant confidence to that view.
The larger trend remains upwards and corrections still offer an opportunity to join the trend.
Always practice good risk management. Always trade with stops and invest only 1-5% of equity on any one trade.
The biggest picture, Grand Super Cycle analysis, is here.
Last historic analysis with monthly charts is here. Video is here.
An historic example of a cycle degree fifth wave is given at the end of the analysis here.
MAIN ELLIOTT WAVE COUNT
WEEKLY CHART
Click chart to enlarge.
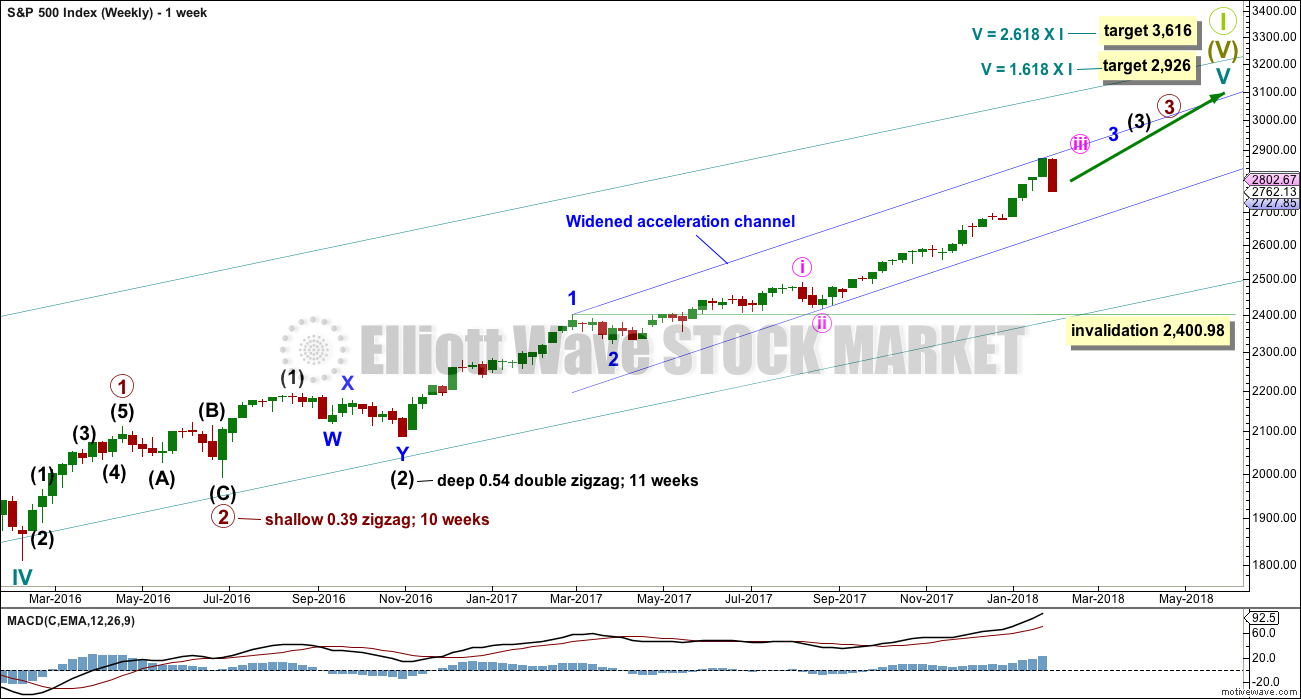
Cycle wave V must complete as a five structure, which should look clear at the weekly chart level. It may only be an impulse or ending diagonal. At this stage, it is clear it is an impulse.
Within cycle wave V, the third waves at all degrees may only subdivide as impulses.
Within cycle wave V, the corrections for primary wave 2 and intermediate wave (2) both show up clearly, both lasting several weeks. The respective corrections for intermediate wave (4) and primary wave 4 should also last several weeks, so that they show up at weekly and monthly time frames. The right proportions between second and fourth wave corrections give a wave count the right look. This wave count expects to see two large multi week corrections coming up.
Cycle wave V has passed equality in length with cycle wave I, which would be the most common Fibonacci ratio for it to have exhibited. The next most common Fibonacci ratio would be 1.618 the length of cycle wave I. This target at 2,926 now looks too low. The next most common Fibonacci ratio would be 2.618 the length of cycle wave I at 3,616. This higher target is looking more likely at this stage.
Intermediate wave (3) has passed all of equality in length with intermediate wave (1), and 1.618 and 2.618 the length of intermediate wave (1). It is possible that intermediate wave (3) may not exhibit a Fibonacci ratio to intermediate wave (1). The target calculation for intermediate wave (3) to end may have to be done at minor degree; when minor waves 3 and 4 are complete, then a target may be calculated for intermediate wave (3) to end. That cannot be done yet.
When minor wave 3 is complete, then the following multi week correction for minor wave 4 may not move into minor wave 1 price territory below 2,400.98. Minor wave 4 should last about four weeks to be in proportion to minor wave 2. It may last about a Fibonacci three, five or even eight weeks if it is a time consuming sideways correction like a triangle or combination. An Elliott channel may be drawn about the impulse of intermediate wave (3) when minor wave 3 is complete, and minor wave 4 may end about the lower edge of that channel.
At this stage, a widened acceleration channel is drawn now in blue about the impulse of intermediate wave (3). This is drawn in the same way as an Elliott channel using Elliott’s first technique, and then the lower edge is pulled down to contain all this recent upwards movement.
As intermediate wave (3) comes to an end, corrections on the weekly chart should begin to be longer lasting. The first of two or three may have begun this week. It still looks like intermediate wave (3) is incomplete, so this correction may last only about one to maybe about four weeks. It is not expected to be much longer lasting than that.
DAILY CHART
Click chart to enlarge.
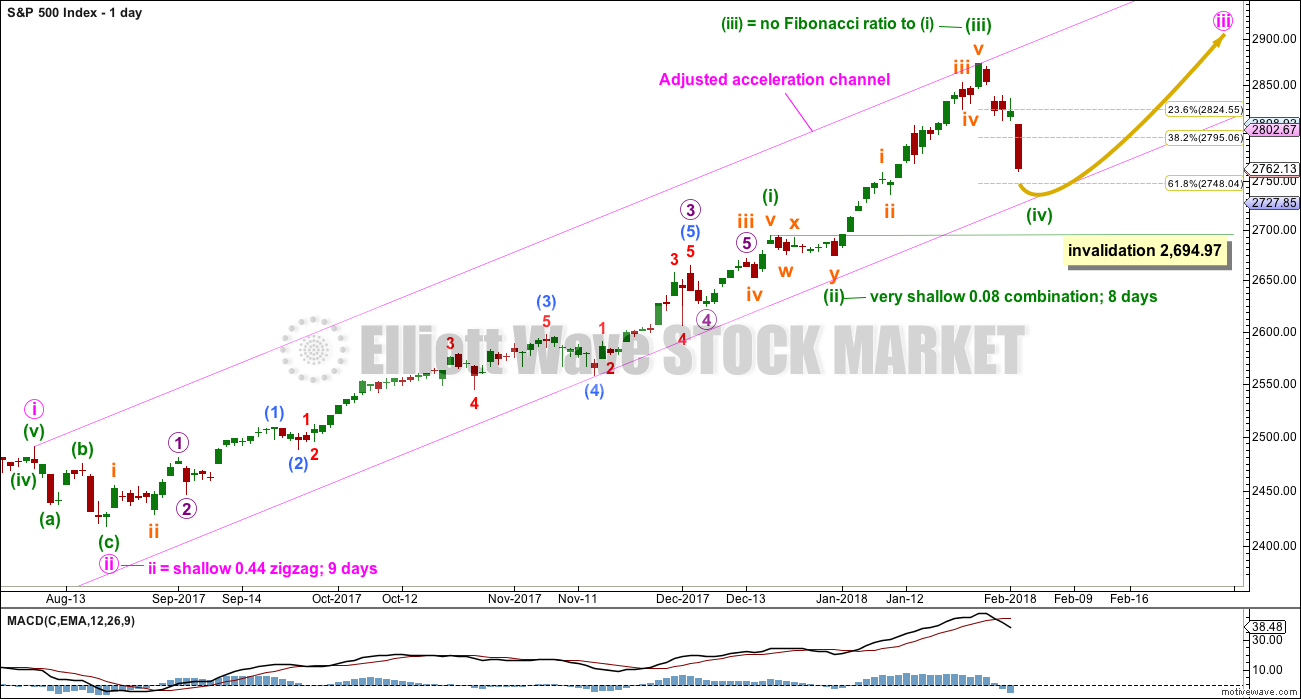
Keep redrawing the acceleration channel as price continues higher: draw the first line from the end of minute wave i to the last high, then place a parallel copy lower down to contain all this upwards movement. When minute wave iii is complete, this would be an adjusted Elliott channel and the lower edge may provide support for minute wave iv.
Minuette wave (ii) subdivides as a combination and lasted only eight sessions, about only one and a half weeks. Minuette wave (iv) may be a zigzag, which tend to be quicker structures than combinations. It is possible that it could be over at Friday’s low, lasting a Fibonacci five days, but it may also continue for another three to total a Fibonacci eight days.
Minuette wave (i) was a long extension. Minuette wave (iii) may have ended at the last high and if so would be shorter than minuette wave (i). This limits minuette wave (v) to no longer than equality in length with minuette wave (iii) so that minuette wave (iii) is not the shortest actionary wave.
Minuette wave (iv) may not move into minuette wave (i) price territory below 2,694.97.
Minute wave iii has passed equality in length with minute wave i, and has passed 1.618 and 2.618 the length of minute wave i. A target for minute wave iii to end must now be calculated at minuette degree. That cannot be done until minuette wave (iv) has ended.
ALTERNATE DAILY CHART
Click chart to enlarge.
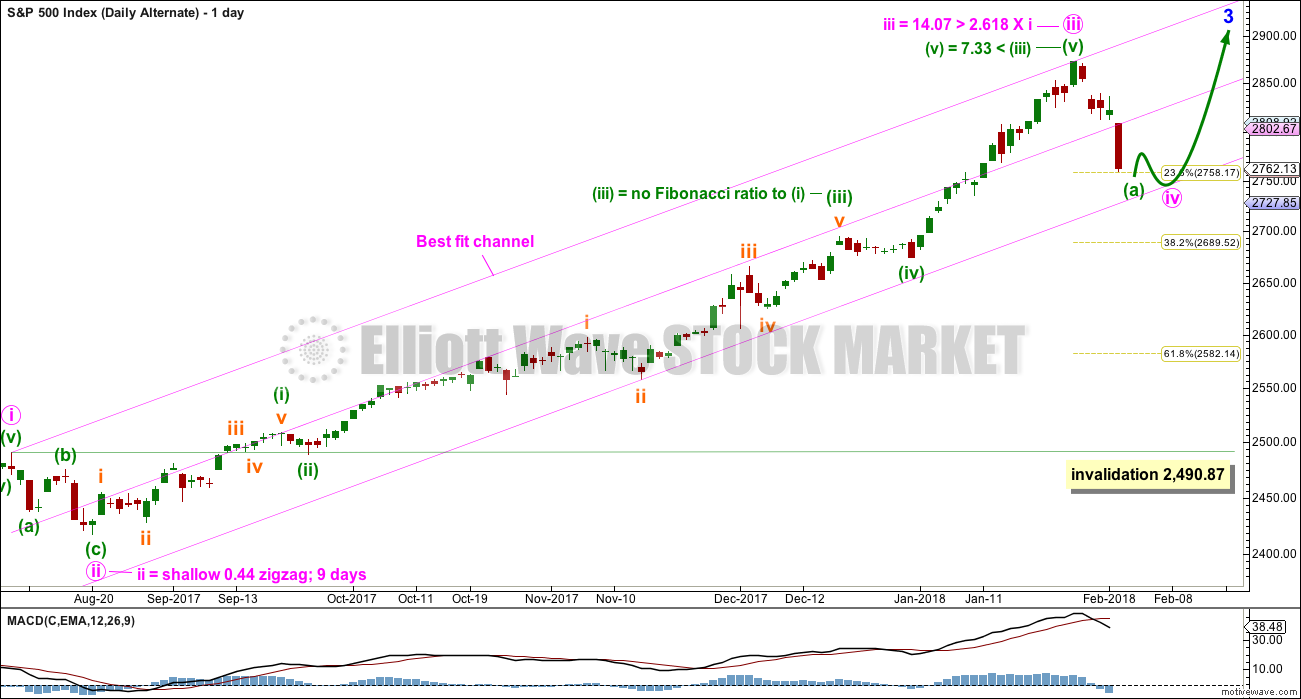
It is possible that minute wave iii was over at the last high. The current correction may be one degree higher for minute wave iv.
Fibonacci ratios for this wave count are fairly good.
The pink best fit channel is the same as the pink acceleration channel on the main wave count.
If the correction is minute wave iv, then it may not move into minute wave i price territory below 2,490.87. But price should first be expected to find support about the lower edge of the best fit channel. If it does break below that channel, then the 0.382 Fibonacci ratio of minute wave iii at 2,690 would be a reasonable target for minute wave iv.
TECHNICAL ANALYSIS
WEEKLY CHART

Click chart to enlarge. Chart courtesy of StockCharts.com.
This strong bearish weekly candlestick is not technically a bearish engulfing reversal pattern because the open this week gapped lower. However, the close this week well below last week’s open is very bearish. Support from volume is also very bearish.
DAILY CHART
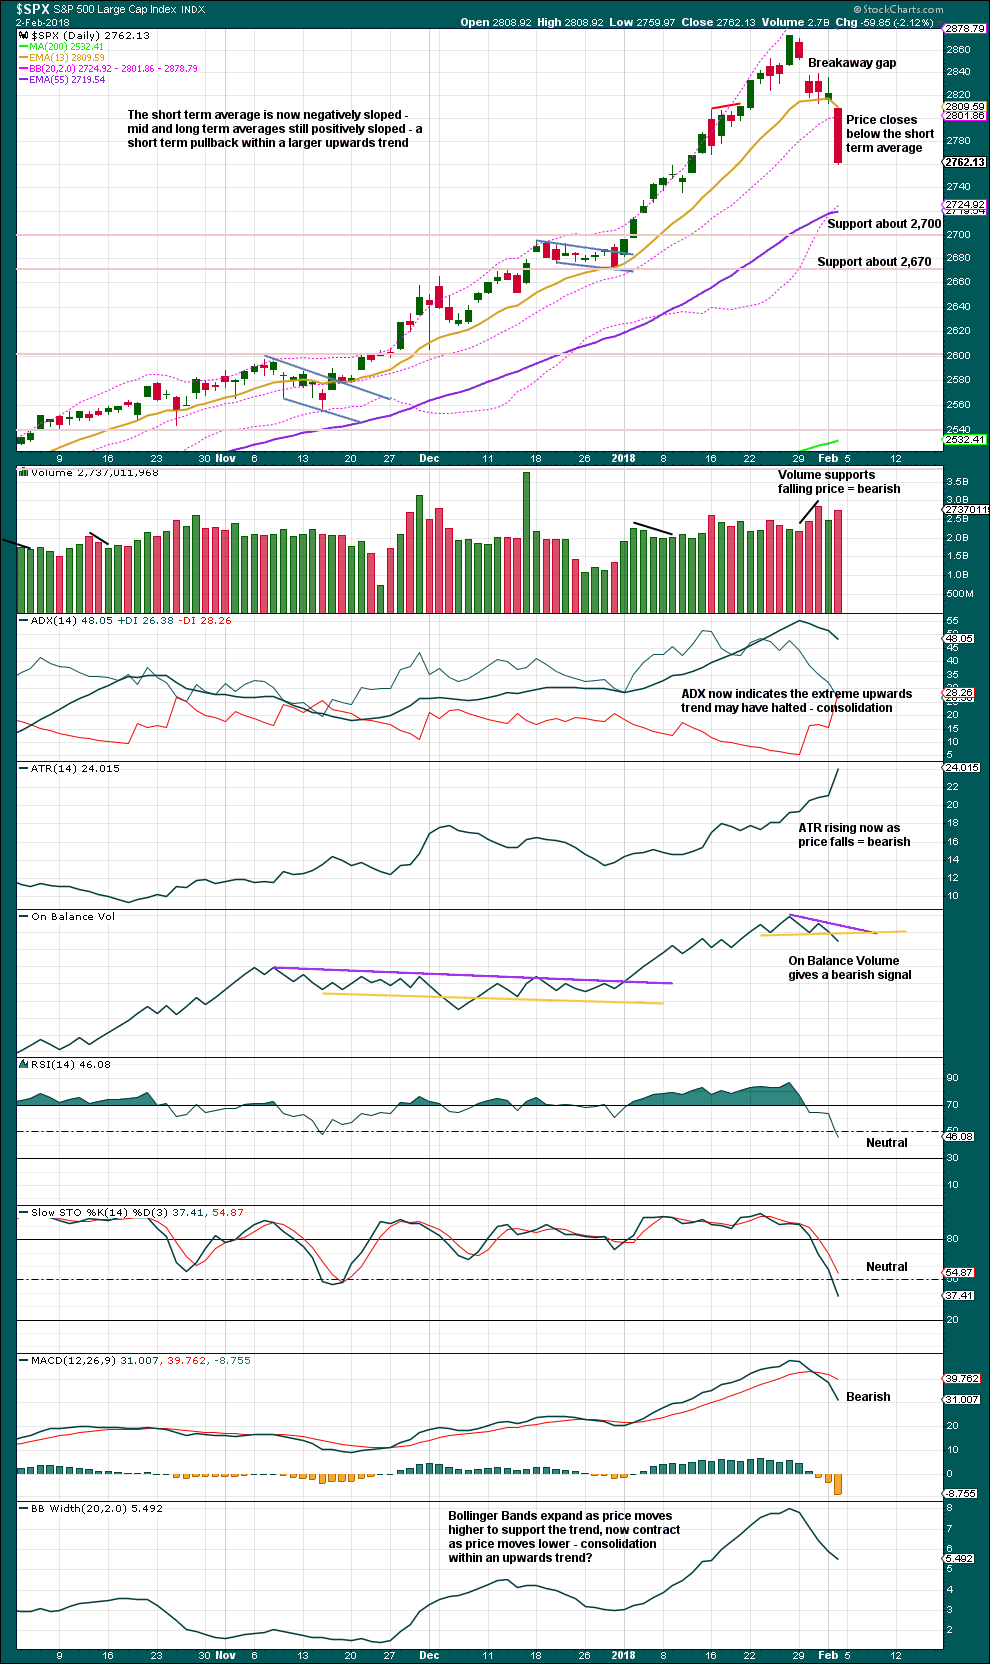
Click chart to enlarge. Chart courtesy of StockCharts.com.
Next support may be at the mid term Fibonacci 55 day moving average.
Volume is bearish. Friday’s candlestick is bearish. On Balance Volume gives a weak bearish signal; weak because the support line was tested only twice before.
If downwards movement continues from here, then it would very likely end if RSI reaches oversold.
VOLATILITY – INVERTED VIX CHART
Click chart to enlarge. Chart courtesy of StockCharts.com.
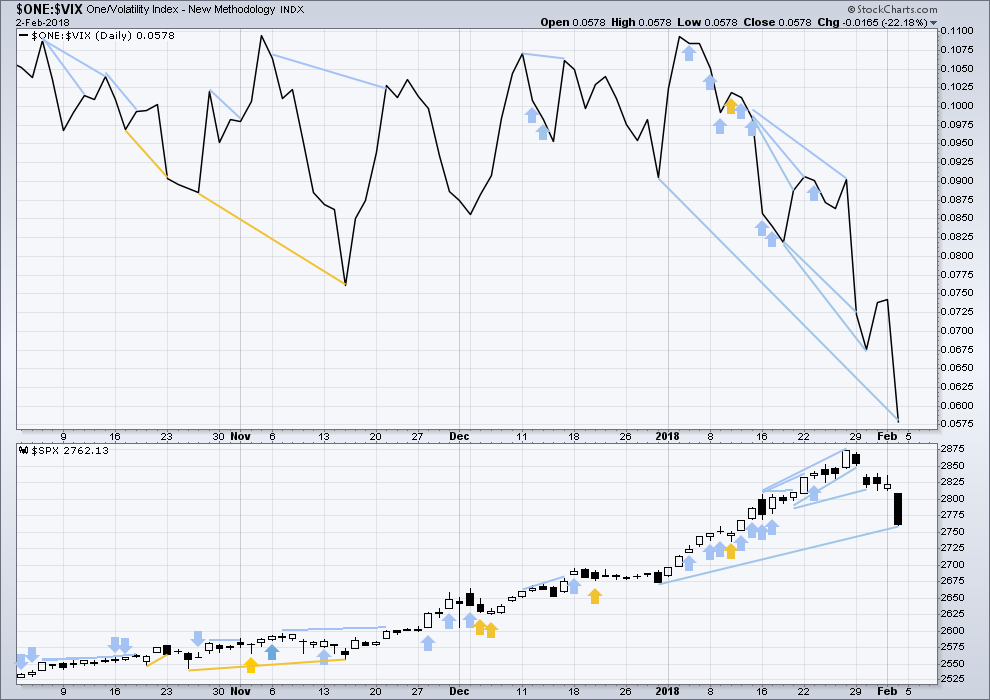
So that colour blind members are included, bearish signals will be noted with blue and bullish signals with yellow.
Normally, volatility should decline as price moves higher and increase as price moves lower. This means that normally inverted VIX should move in the same direction as price.
Volatility still remains much stronger than downwards movement in price suggests. This may be still read as bearish.
There is mid term divergence between price and inverted VIX. This has not been as reliable as short term divergence, but it will still be noted.
BREADTH – AD LINE
Click chart to enlarge. Chart courtesy of StockCharts.com.
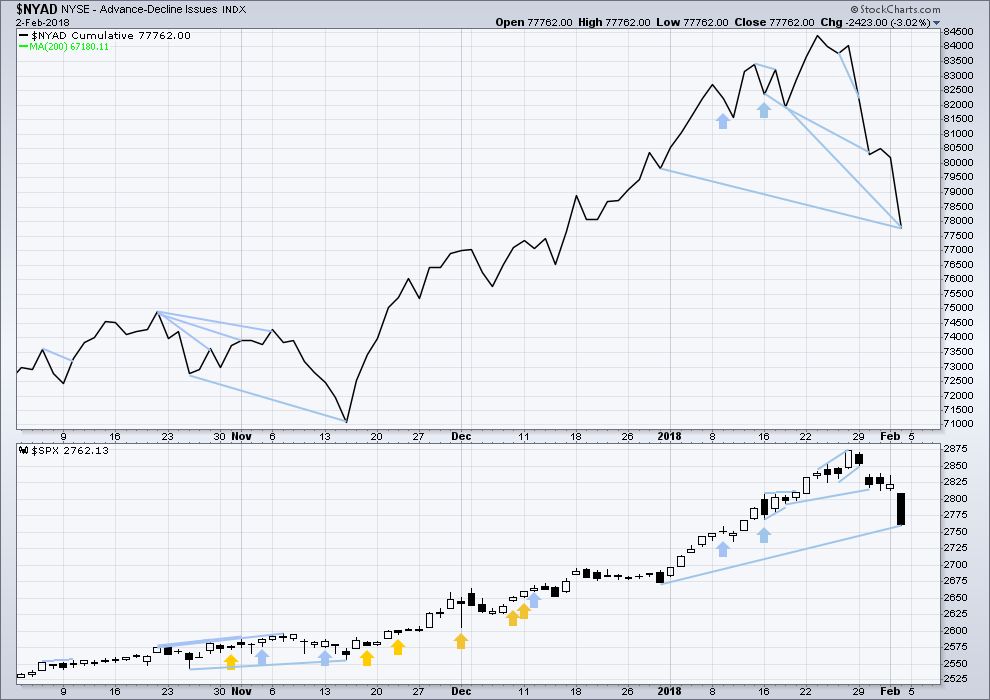
There is normally 4-6 months divergence between price and market breadth prior to a full fledged bear market. This has been so for all major bear markets within the last 90 odd years. With no longer term divergence yet at this point, any decline in price should be expected to be a pullback within an ongoing bull market and not necessarily the start of a bear market.
All of small, mid and large caps last week made new all time highs. This market has good support from rising breadth.
Breadth should be read as a leading indicator.
The AD line has made a new low below the prior low of the 29th of December, 2017, but price has not. This divergence is interpreted as bearish.
All of small, mid and large caps this week made reasonable new lows. The fall in price has support from market breadth. This is bearish.
DOW THEORY
All indices have made new all time highs as recently as three weeks ago, confirming the ongoing bull market.
The following lows need to be exceeded for Dow Theory to confirm the end of the bull market and a change to a bear market:
DJIA: 17,883.56.
DJT: 7,029.41.
S&P500: 2,083.79.
Nasdaq: 5,034.41.
Charts showing each prior major swing low used for Dow Theory are here.
US OIL ANALYSIS
Summary: Assume the upwards trend remains intact while price remains within the yellow channel on the daily chart. Only if that channel is breached by downwards movement should a high be assumed to be in place.
A new high now above 74.96 would provide a strong indication that Oil may be in a long term bull market. The target would be at 80.64, but a large correction for a big fourth wave would be expected prior to the target being reached.
MAIN WAVE COUNT
MONTHLY CHART
Click chart to enlarge.
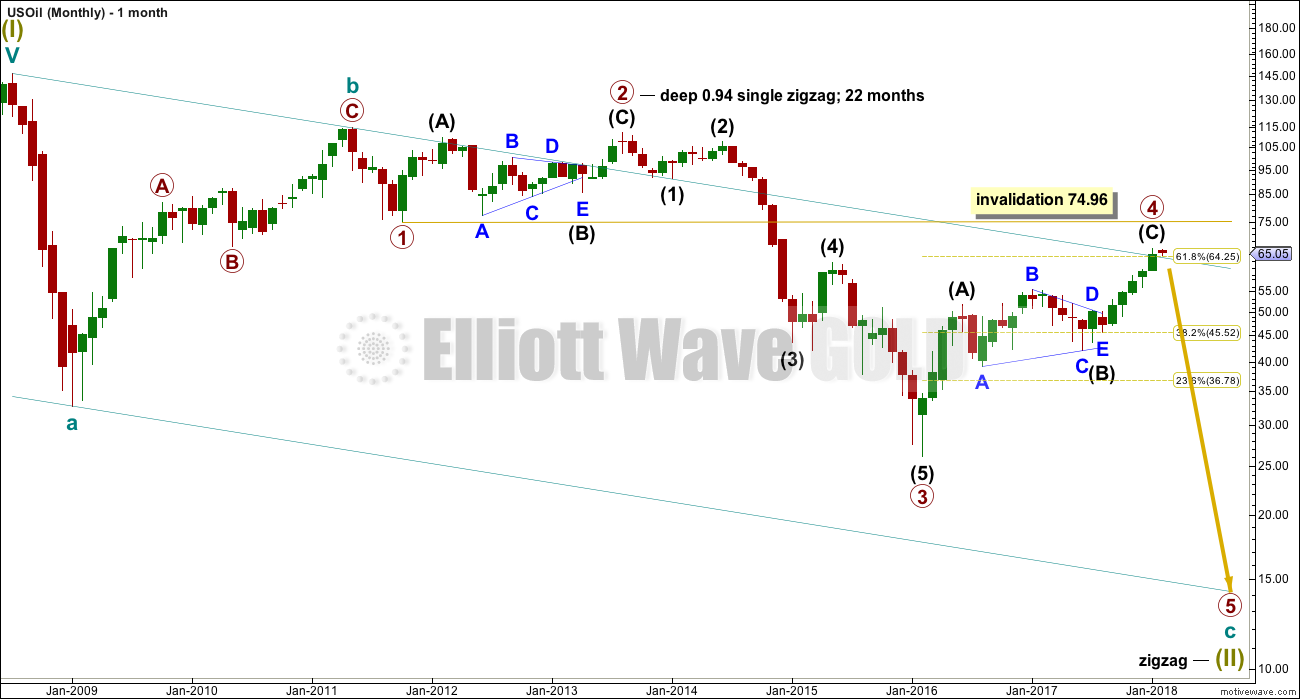
Within the bear market, cycle wave b is seen as ending in May 2011. Thereafter, a five wave structure downwards for cycle wave c begins.
Primary wave 1 is a short impulse lasting five months. Primary wave 2 is a very deep 0.94 zigzag lasting 22 months. Primary wave 3 is a complete impulse with no Fibonacci ratio to primary wave 1. It lasted 30 months.
There is alternation in depth with primary wave 2 very deep and primary wave 4 relatively shallow. There is inadequate alternation in structure, both are zigzags. So far primary wave 4 has lasted 23 months. At this stage, there is almost perfect proportion between primary waves 2 and 4.
Primary wave 4 may not move into primary wave 1 price territory above 74.96.
The wider Elliott channel (teal) about this whole movement may offer support to primary wave 5.
Price last week has closed above the teal resistance line, the upper edge of this very wide channel. This wave count expected it would be fairly likely that primary wave 4 should have found resistance there. Because this line is now breached on the daily chart a new alternate is considered below.
WEEKLY CHART
Click chart to enlarge.
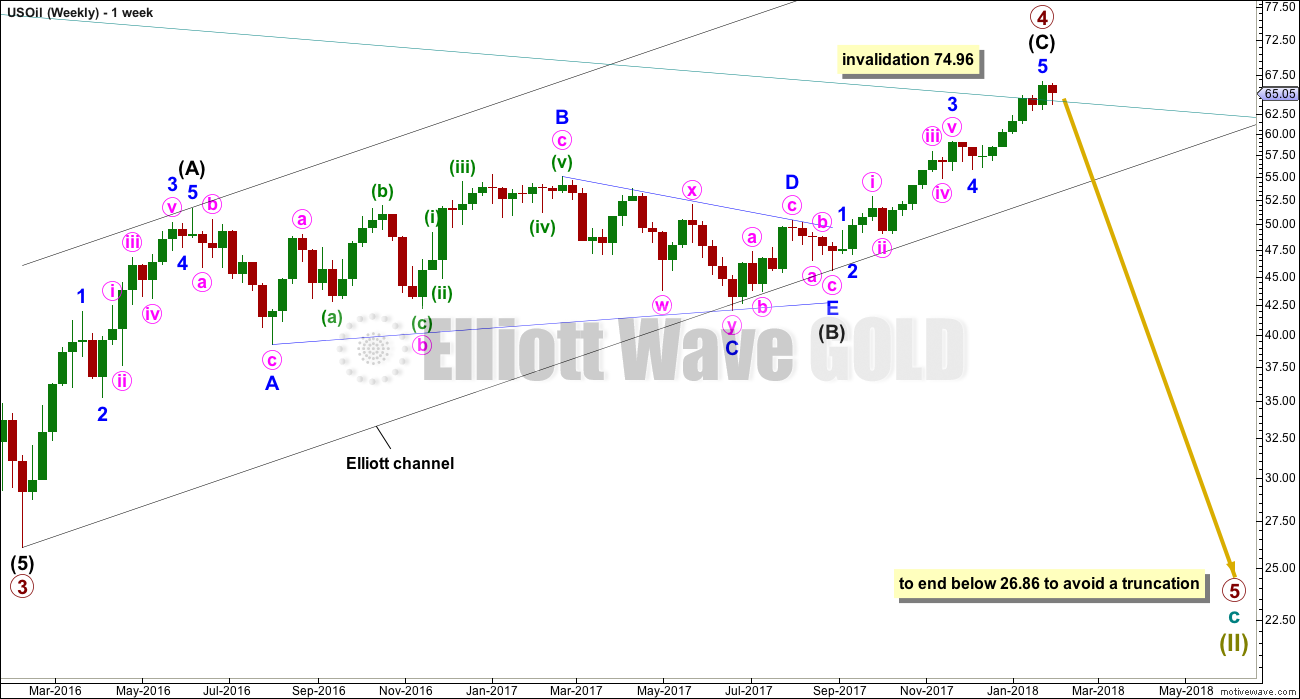
Primary wave 4 subdivides as a zigzag, and within it intermediate wave (C) may now be complete. If primary wave 5 were to only reach equality in length with primary wave 3, it would end with a small truncation. A target for primary wave 5 may best be calculated at intermediate degree. That can only be done when intermediate waves (1) through to (4) within primary wave 5 are complete.
An Elliott channel is added to this possible zigzag for primary wave 4. A breach of the lower edge of this channel would provide a very strong indication that primary wave 4 should be over and primary wave 5 should be underway.
DAILY CHART
Click chart to enlarge.
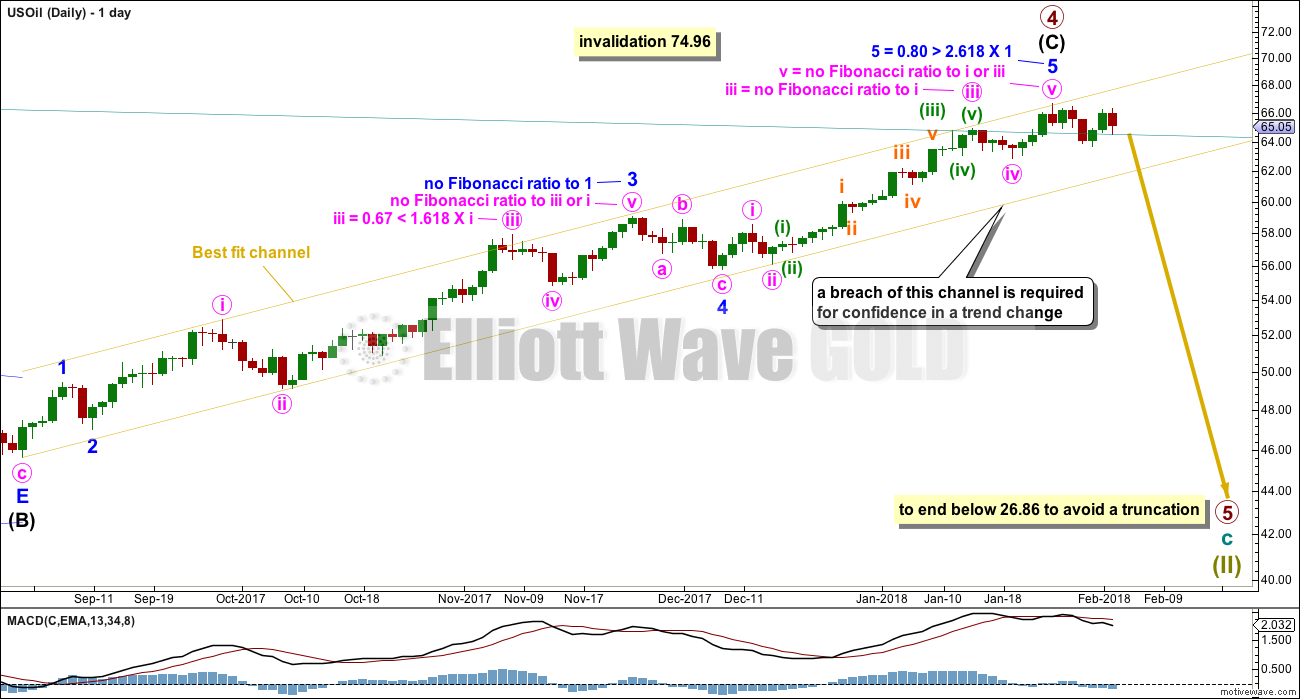
Intermediate wave (C) may now be complete at all degrees. However, the yellow best fit channel must absolutely be breached by downwards movement before any confidence that a high is in place may be had.
Assume the trend remains the same, upwards, while price remains within the channel. This wave count is at the point now where it requires channel confirmation.
If primary wave 4 continues any higher, it may not move into primary wave 1 price territory above 74.96.
Although the small downwards movement from the high of primary wave 4 this week looks like a three on the daily chart, it will subdivide as either a three or a five on the hourly chart. This wave count remains viable.
ALTERNATE WAVE COUNT
MONTHLY CHART
Click chart to enlarge.
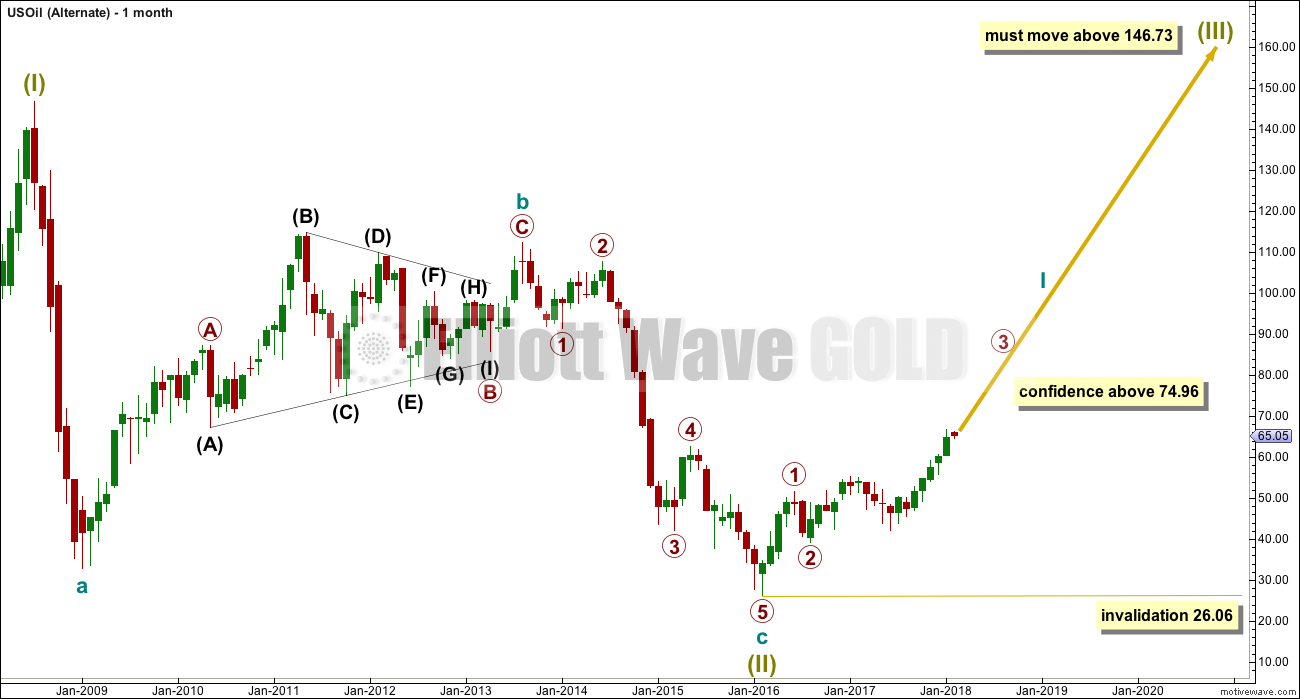
It is possible that the bear market for Oil is over and a new bull market is in the very early stages.
A huge zigzag down to the last low may be complete and is labelled here Super Cycle wave (II).
Cycle wave b must be seen as complete in August 2013 for this wave count to work. It cannot be seen as complete at the prior major swing high in May 2011.
Cycle wave b is seen as a zigzag, and within it primary wave B is seen as a running contracting triangle. These are fairly common structures, although nine wave triangles are uncommon. All subdivisions fit.
Primary wave C moves beyond the end of primary wave A, so it avoids a truncation. But it does not have to move above the price territory of primary wave B to avoid a truncation, which is an important distinction.
If cycle wave b begins there, then cycle wave c may be seen as a complete five wave impulse.
Super Cycle wave (III) must move beyond the end of Super Cycle wave (I). It must move far enough above that point to allow room for a subsequent Super Cycle wave (IV) to unfold and remain above Super Cycle wave (I) price territory.
WEEKLY CHART
Click chart to enlarge.
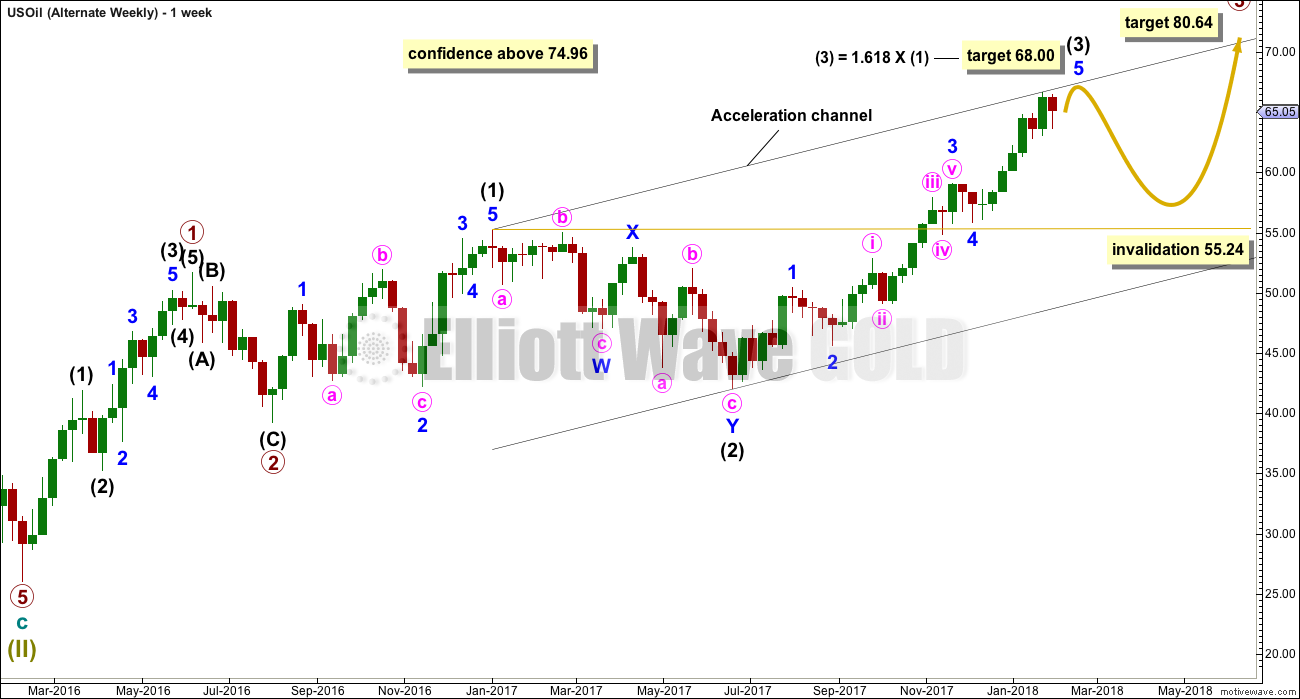
If a new bull market is in the very early stages for Oil, then it may have begun with two overlapping first and second waves at primary then at intermediate degree.
Primary wave 3 may only subdivide as an impulse, and within it intermediate wave (3) may be incomplete. The target assumes the most common Fibonacci ratio to intermediate wave (1).
Intermediate wave (4) may not move into intermediate wave (1) price territory below 55.24.
TECHNICAL ANALYSIS
MONTHLY CHART
Click chart to enlarge. Chart courtesy of StockCharts.com.
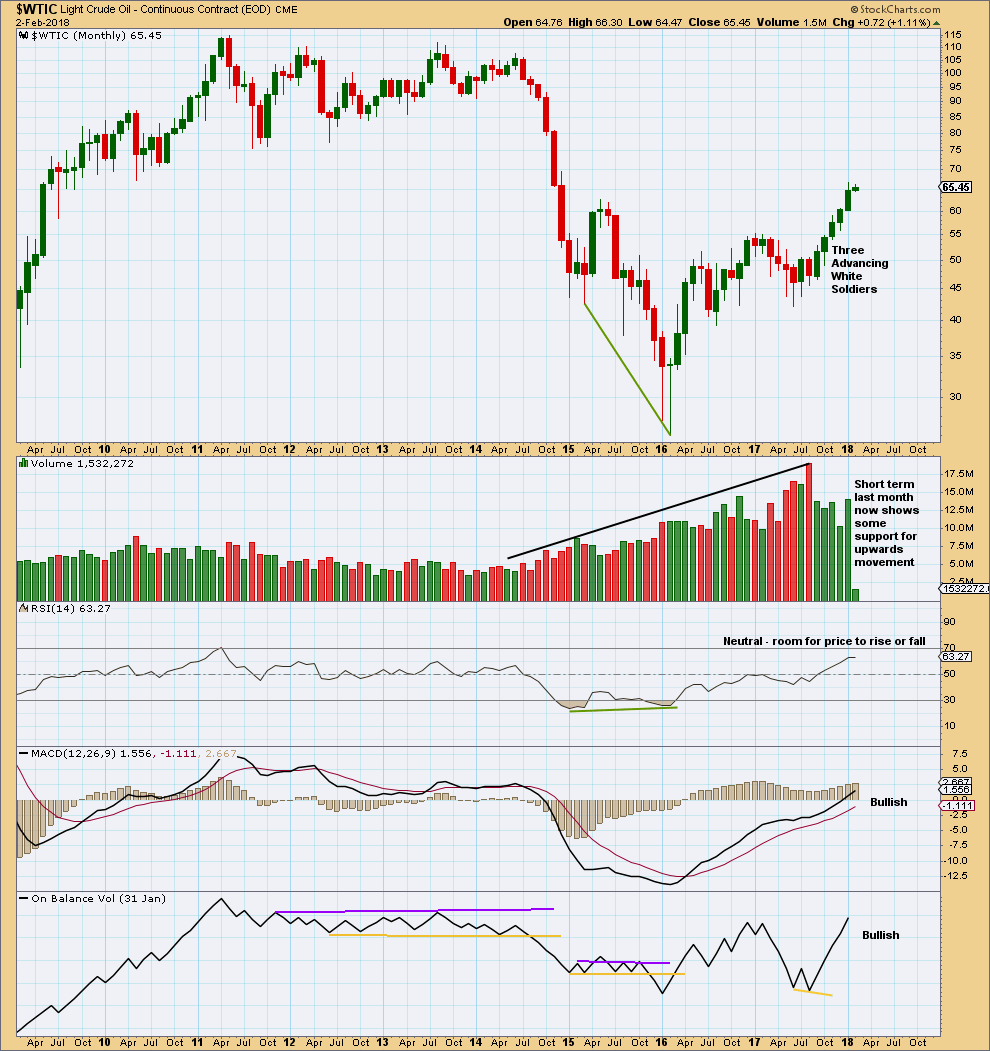
The strongest recent monthly volume is for the downwards month of August 2017. This is bearish.
For the now completed month of January the rise in price had support from volume. This is bullish. MACD and On Balance Volume are also both bullish. Overall, this chart is more bullish than bearish.
RSI indicates there is room for upwards movement to continue.
DAILY CHART
Click chart to enlarge. Chart courtesy of StockCharts.com.
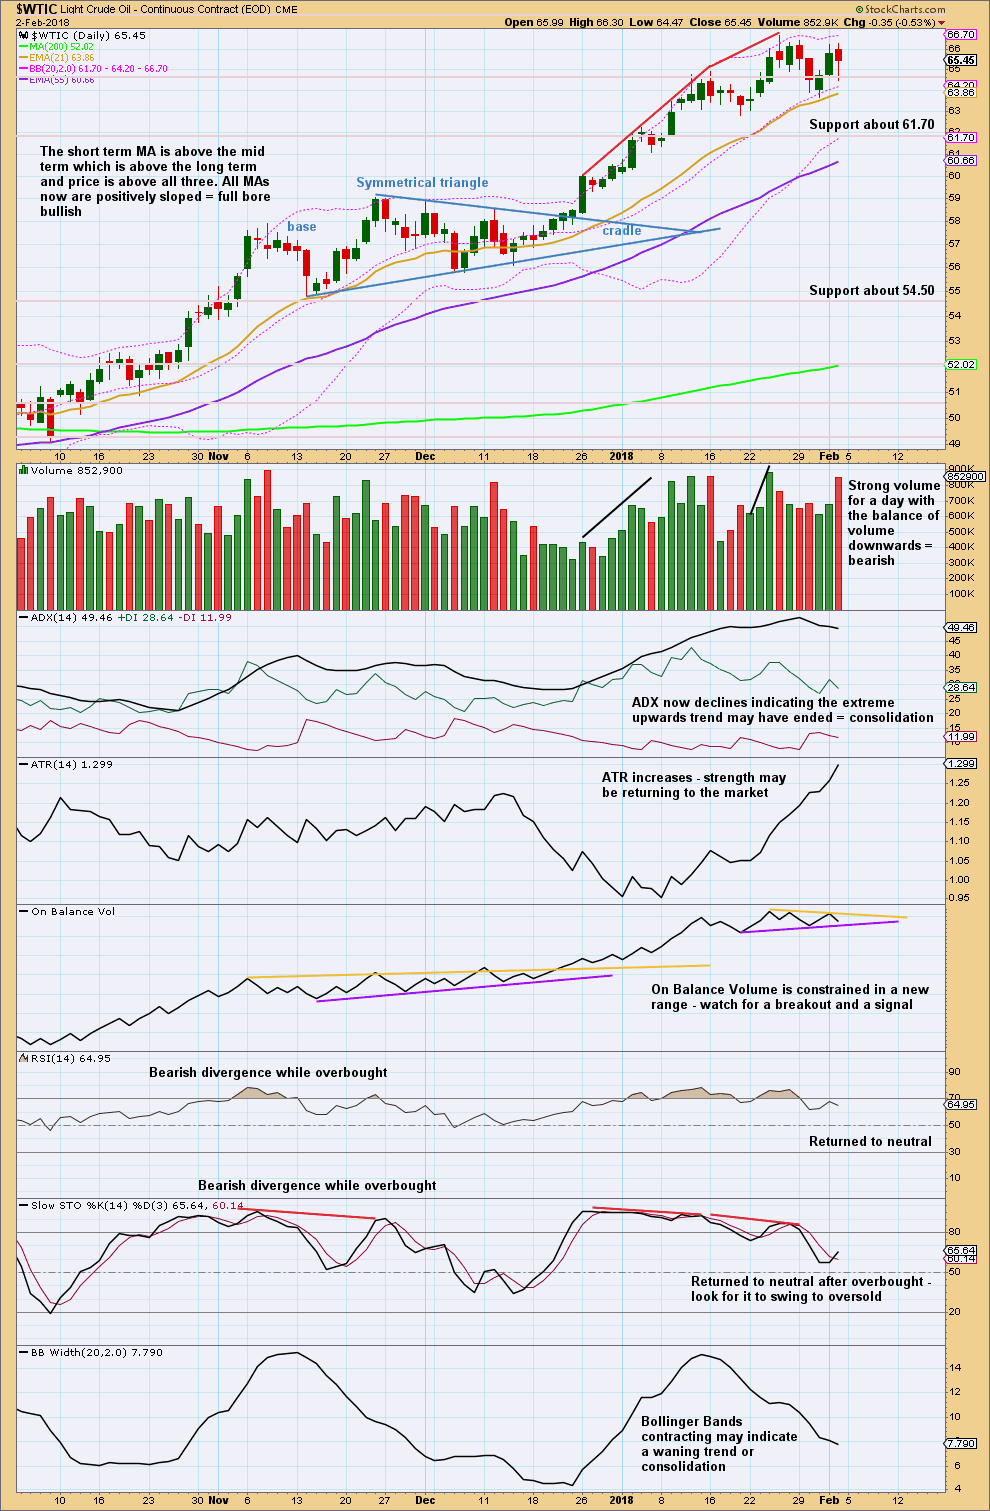
It looks like the upwards trend is being interrupted by a consolidation. However, strong volume for downwards movement within Friday’s session is fairly bearish, at least for the short term.
Watch On Balance Volume carefully next week. A signal here should be given reasonable weight.
VOLATILITY INDEX
Click chart to enlarge. Chart courtesy of StockCharts.com.
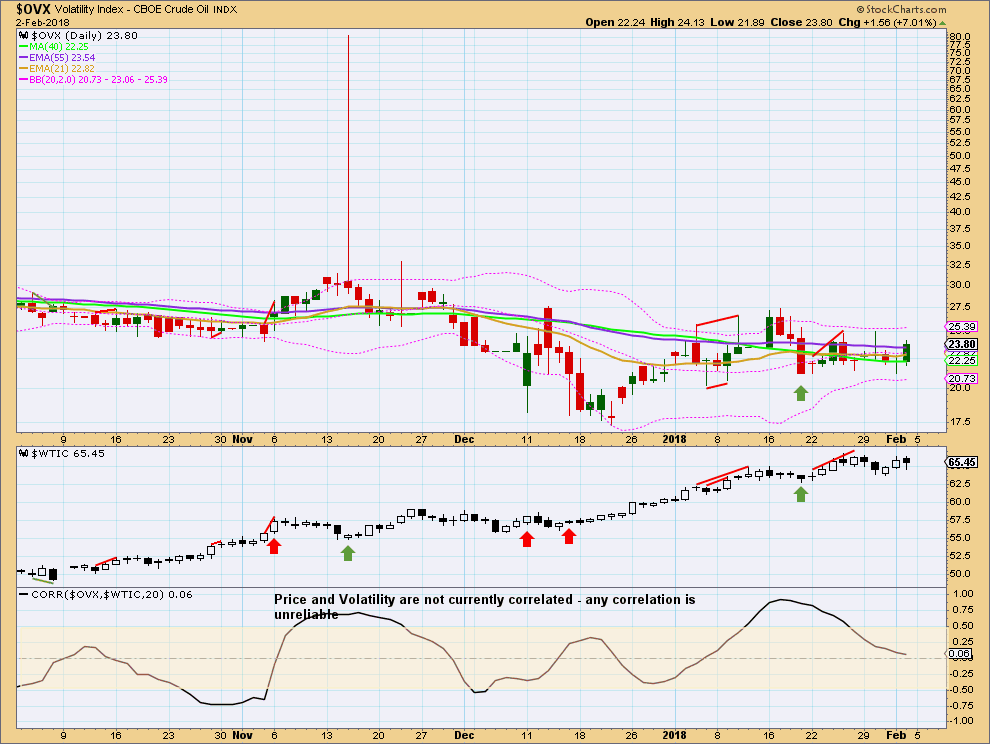
Prior short term bearish divergence has now been followed by some small downwards movement. This divergence may now be resolved. There is no new divergence noted this week.
Published @ 10:00 p.m. EST on 3rd February, 2018.