
A bounce was again expected. Price has made a new high this week so far. The target is not yet met.
Summary: Silver remains range bound. Volume now suggests an upwards breakout may be more likely than downwards. Resistance is about 16.810 – 16.950 and support is about 16.195 – 16.100. At this time, a downwards swing within the consolidation may continue to the support zone. Do not expect it to move in a straight line.
If price does move lower this week, then consider opening a long position close to or at support in preparation for an upwards breakout. Always be careful to responsibly manage risk. Always use stops and invest only 1-5% of equity on any one trade.
If price does break out of the consolidation, then open a position in the breakout direction. Stops may be set just back in the consolidation zone.
Last monthly charts can be viewed here.
New updates to this analysis are in bold.
ELLIOTT WAVE COUNTS
MAIN WAVE COUNT
WEEKLY CHART
Click chart to enlarge.
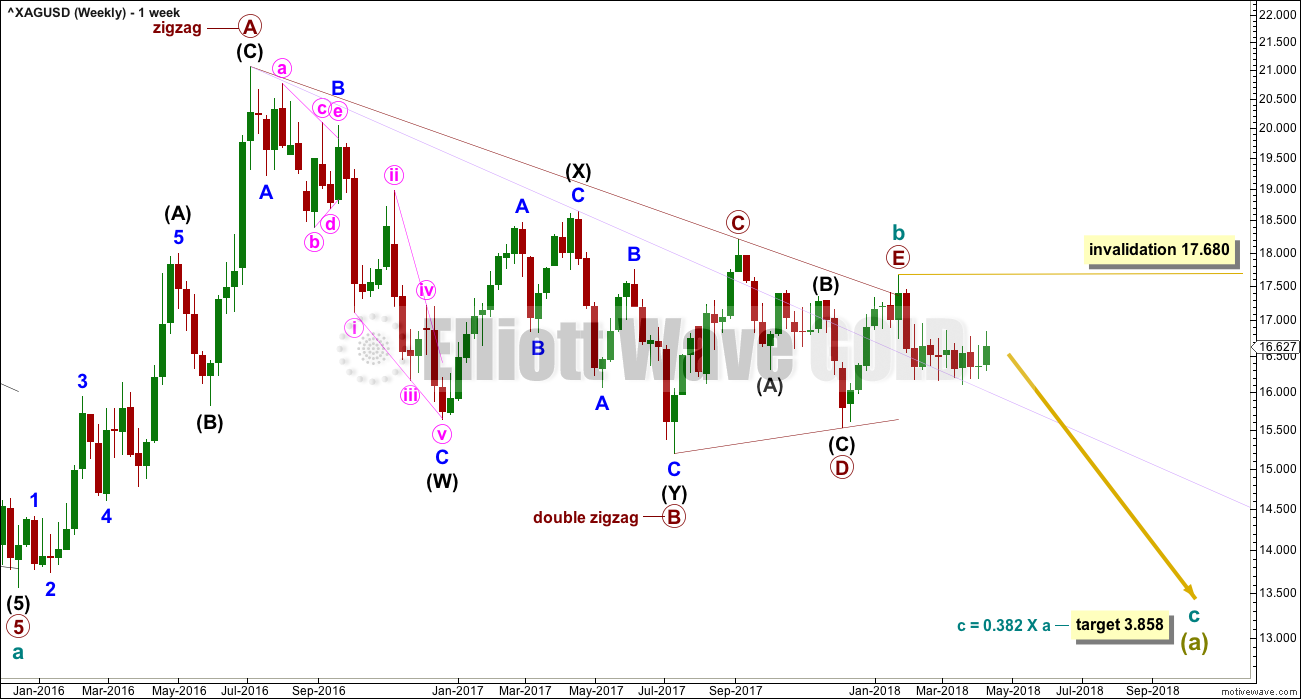
The main wave count expects that the bear market, which began from the April 2011 high, is incomplete.
Cycle wave a is seen as a five wave impulse for this main wave count. There are multiple corrective structures possible still for cycle wave b.
This first weekly chart sees cycle wave b as a now possibly complete regular contracting triangle.
Primary wave E of the triangle may have ended with an overshoot of the A-C trend line. If this wave count is correct, then price should have reversed already. Within the new downwards trend, no second wave correction may move beyond the start of the first wave above 17.680.
DAILY CHART

Click chart to enlarge.
Intermediate wave (1) down subdivides well as a five wave structure.
Intermediate wave (2) may be an incomplete flat correction. If minor wave B is over then it would be a 1.09 length of minor wave A, indicating an expanded flat. It is possible still that minor wave B may move a little lower.
Minor wave C upwards would be very likely to make at least a slight new high above the end of minor wave A at 16.961 to avoid a truncation and a very rare running flat.
Minor wave C must subdivide as a five wave structure, either an impulse or an ending diagonal. It may be either at this stage. This week’s labelling on this chart considers an ending contracting diagonal.
If this structure is correctly labelled, then minute wave iv may not be longer than minute wave ii; minute wave iv may not move at or below 16.246, where it would reach equality in length with minute wave ii. If minute wave v has begun at Friday’s low, then it may not be longer than equality in length with minute wave iii at 17.035. If minute wave iv moves lower, then this upper point for a maximum of minute wave v must also move correspondingly lower.
Minute wave v may end with a final upwards thrust above 16.961 but not above 17.035.
Intermediate wave (2) may not move beyond the start of intermediate wave (1) above 17.680.
At this stage, this first wave count now has the lowest probability of the three wave counts published for Silver.
SECOND WAVE COUNT
WEEKLY CHART
Click chart to enlarge.
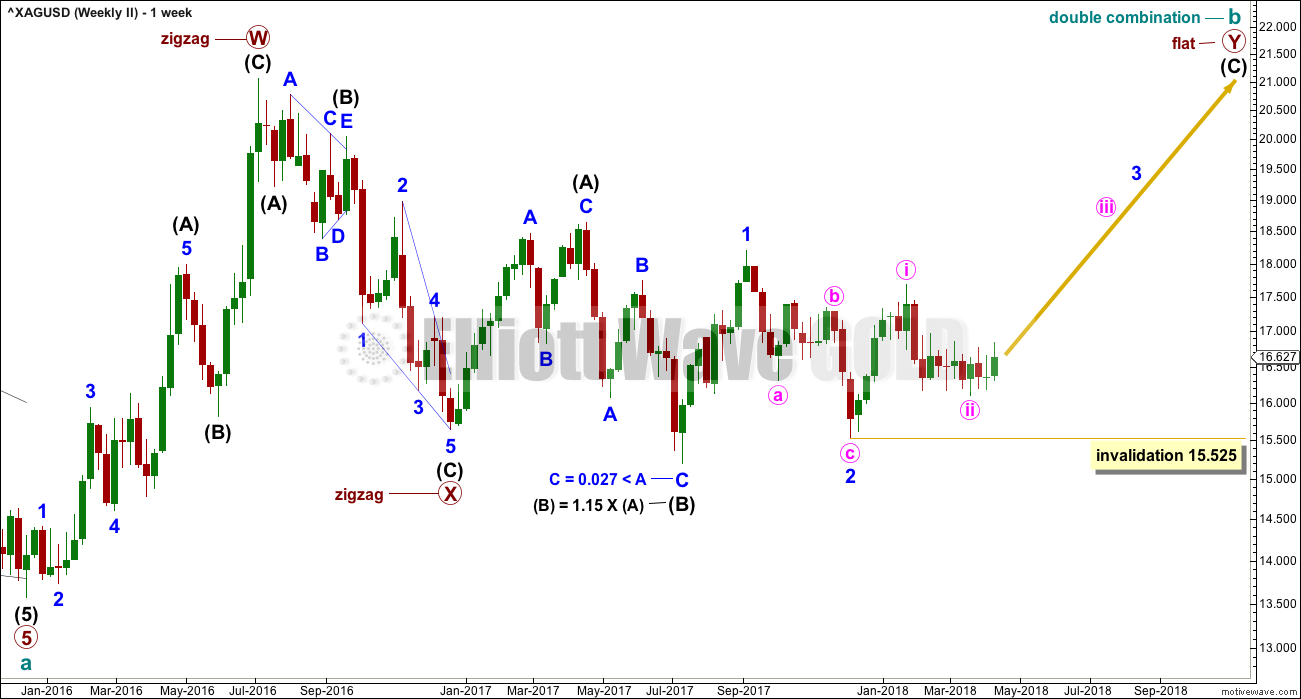
Cycle wave b may be completing as a double combination: zigzag – X – flat. The second structure, a flat correction for primary wave Y, may be underway.
Within a flat correction, intermediate wave (B) must retrace a minimum 0.9 length of intermediate wave (A) at 15.938. Intermediate wave (B) has met this minimum requirement; the rule for a flat correction is met. Intermediate wave (B) is longer than 1.05 times the length of intermediate wave (A) indicating this may be an expanded flat. Expanded flat corrections are the most common type. Normally their C waves are 1.618 or 2.618 the length of their A waves.
The purpose of combinations is to take up time and move price sideways. To achieve this purpose the second structure in the double normally ends about the same level as the first.
While the combination wave count at the weekly chart level does not currently work for Gold, it does still work for Silver. They do not have to complete the same structures for cycle wave b, and fairly often their structures are different.
At this stage, the duration of minor wave 2 now looks wrong. This wave count is now less likely.
If minute wave ii continues lower, it may not move beyond the start of minute wave i below 15.525.
DAILY CHART
Click chart to enlarge.
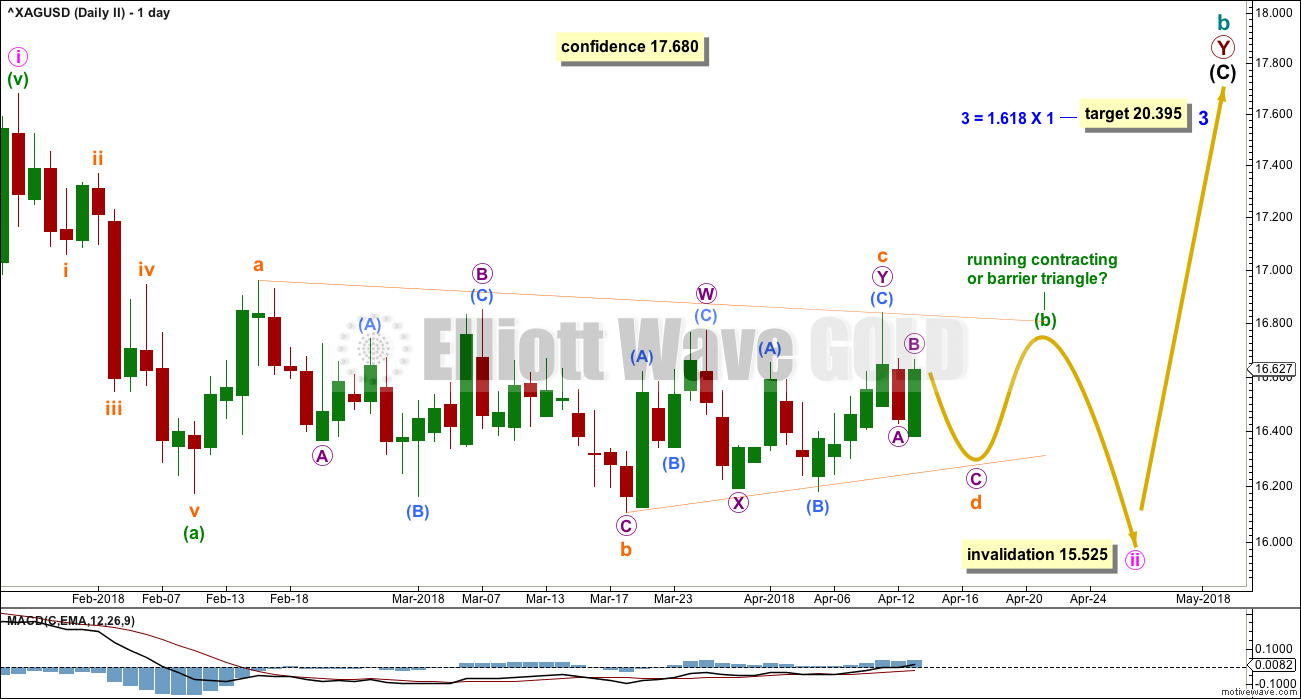
This week’s labelling of the short term structure for minute wave ii is changed to consider it continuing further sideways and a little lower.
Minute wave ii may be an incomplete zigzag. Within the zigzag, minuette wave (b) may be an incomplete running contracting or barrier triangle. Within the triangle, subminuette wave d may not move reasonably below 16.106. Subminuette wave e may not move above the end of subminuette wave c above 16.485.
This wave count now allows for further sideways movement in an ever decreasing range, followed by a final downwards swing within a consolidation. This may take a few more weeks to complete. Thereafter, an upwards breakout may be expected.
This wave count has reasonable support from classic technical analysis this week.
ALTERNATE WAVE COUNT
WEEKLY CHART
Click chart to enlarge.
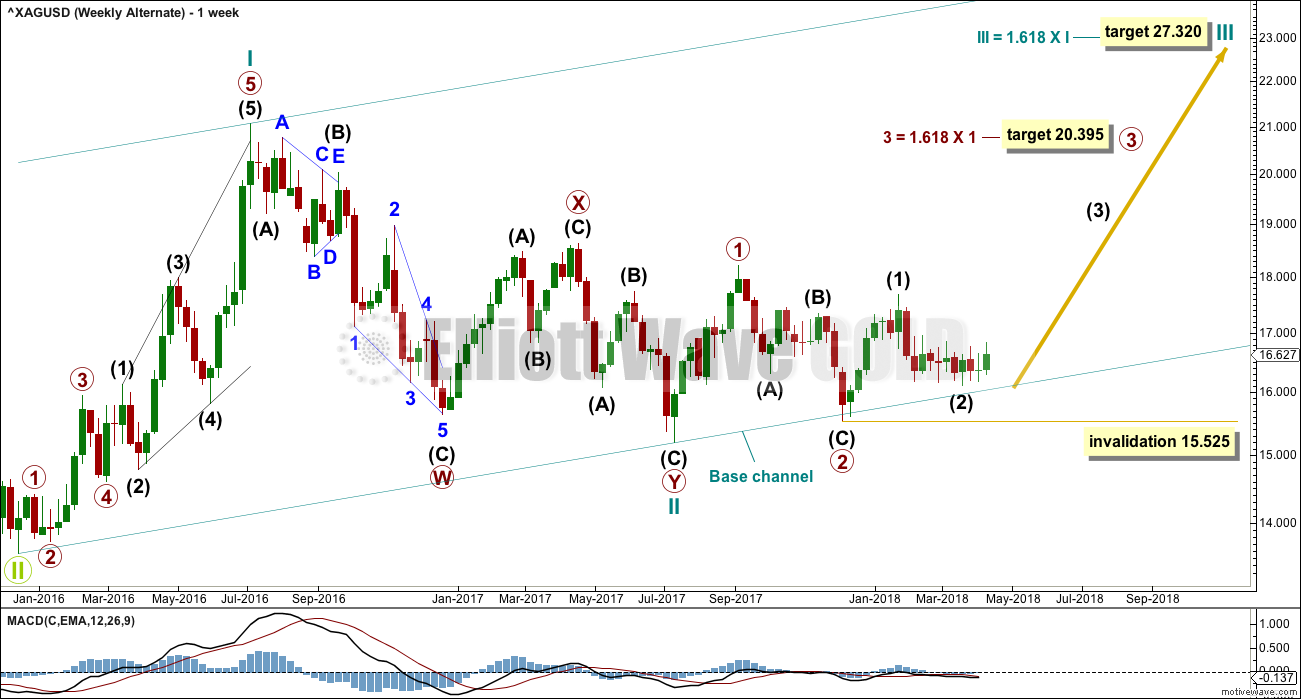
This alternate wave count looks at the possibility that the bear market may be over for Silver and a new bull market may have begun.
A series of three overlapping first and second waves may now be complete for cycle waves I and II, primary waves 1 and 2, and intermediate waves (1) and (2).
A third wave now at three large degrees may be beginning.
Targets calculated for third waves assume the most common Fibonacci ratios to their respective first waves. As price approaches each target, if the structure is incomplete or price keeps rising through the target, then the next Fibonacci ratio in the sequence would be used to calculate a new target.
Within primary wave 3, intermediate wave (2) may not move beyond the start of intermediate wave (1) below 15.525.
The large base channel about cycle waves I and II nicely shows where primary wave 2 found support. A lower degree second wave correction should find support (in a bull market) about a base channel drawn about a first and second wave one or more degrees higher. If this base channel is breached at the daily chart level with one full daily candlestick below and not touching it, then the probability of this alternate wave count would be reduced.
DAILY CHART
Click chart to enlarge.
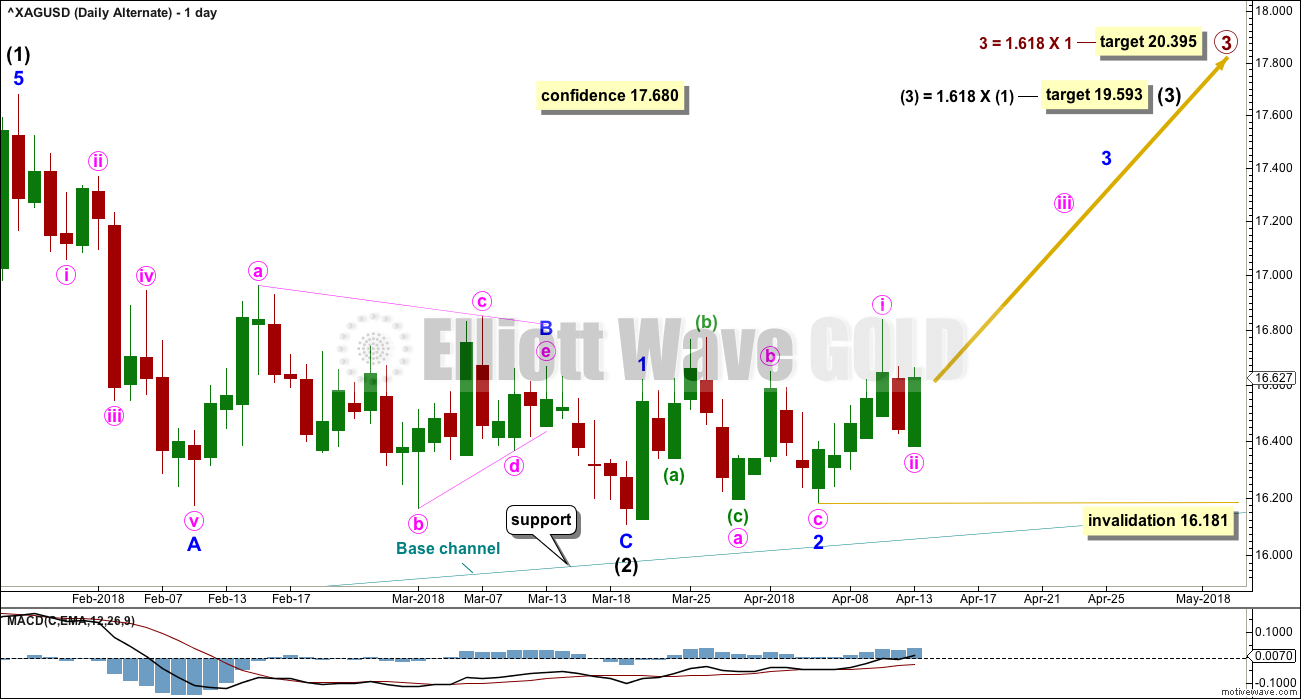
If an impulse ended at the last high on the 25th of January (here labelled intermediate wave (1) ), and a zigzag began there, then at this stage there are two possibilities for the zigzag. It may be over as per this labelling, or it may be incomplete as per the labelling on the second daily chart above. Both ideas work for both of the second and third wave counts.
This labelling considers the possibility the zigzag was over. The zigzag is labelled intermediate wave (2) on this chart, and it would be labelled minute wave ii for the second wave count. The structure is the same, but the degree of labelling is different.
If the zigzag for intermediate wave (2) was over, then intermediate wave (3) may have begun there. The most common Fibonacci ratio is used to calculate a target for intermediate wave (3) to end.
Intermediate wave (3) may only subdivide as an impulse, and within it minor waves 1 and 2 may be complete. Within minor wave 3, minute wave ii may not move beyond the start of minute wave i below 16.181.
TECHNICAL ANALYSIS
WEEKLY CHART
Click chart to enlarge. Chart courtesy of StockCharts.com.
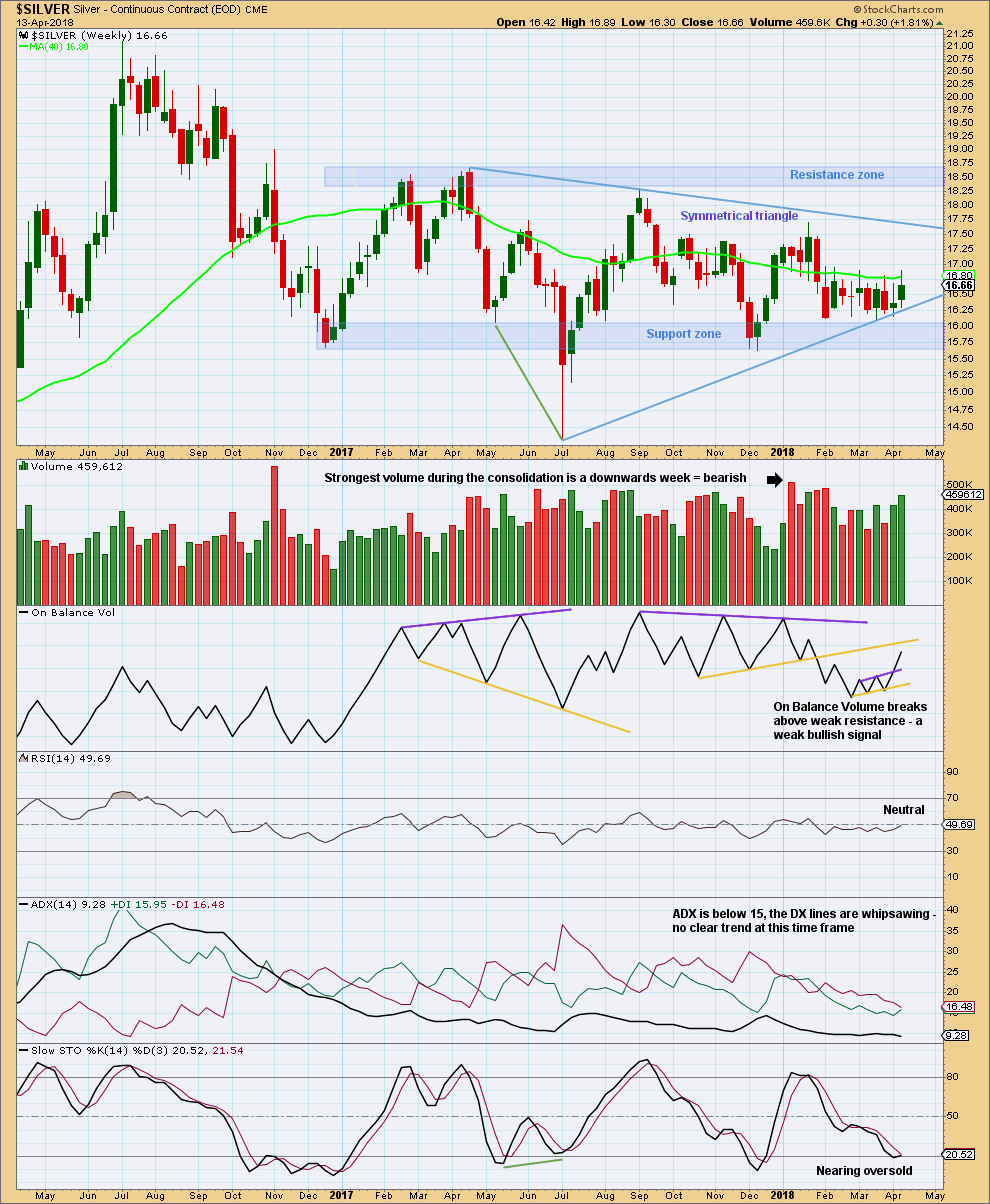
Price remains within the support and resistance zone.
Of this larger structure of a symmetrical triangle, volume suggests a downwards breakout may be more likely than upwards.
This week saw upwards movement with support from volume. Price has neared support and Stochastics is nearing oversold. An upwards swing about here may be expected. Do not expect it to move in a straight line.
DAILY CHART
Click chart to enlarge. Chart courtesy of StockCharts.com.
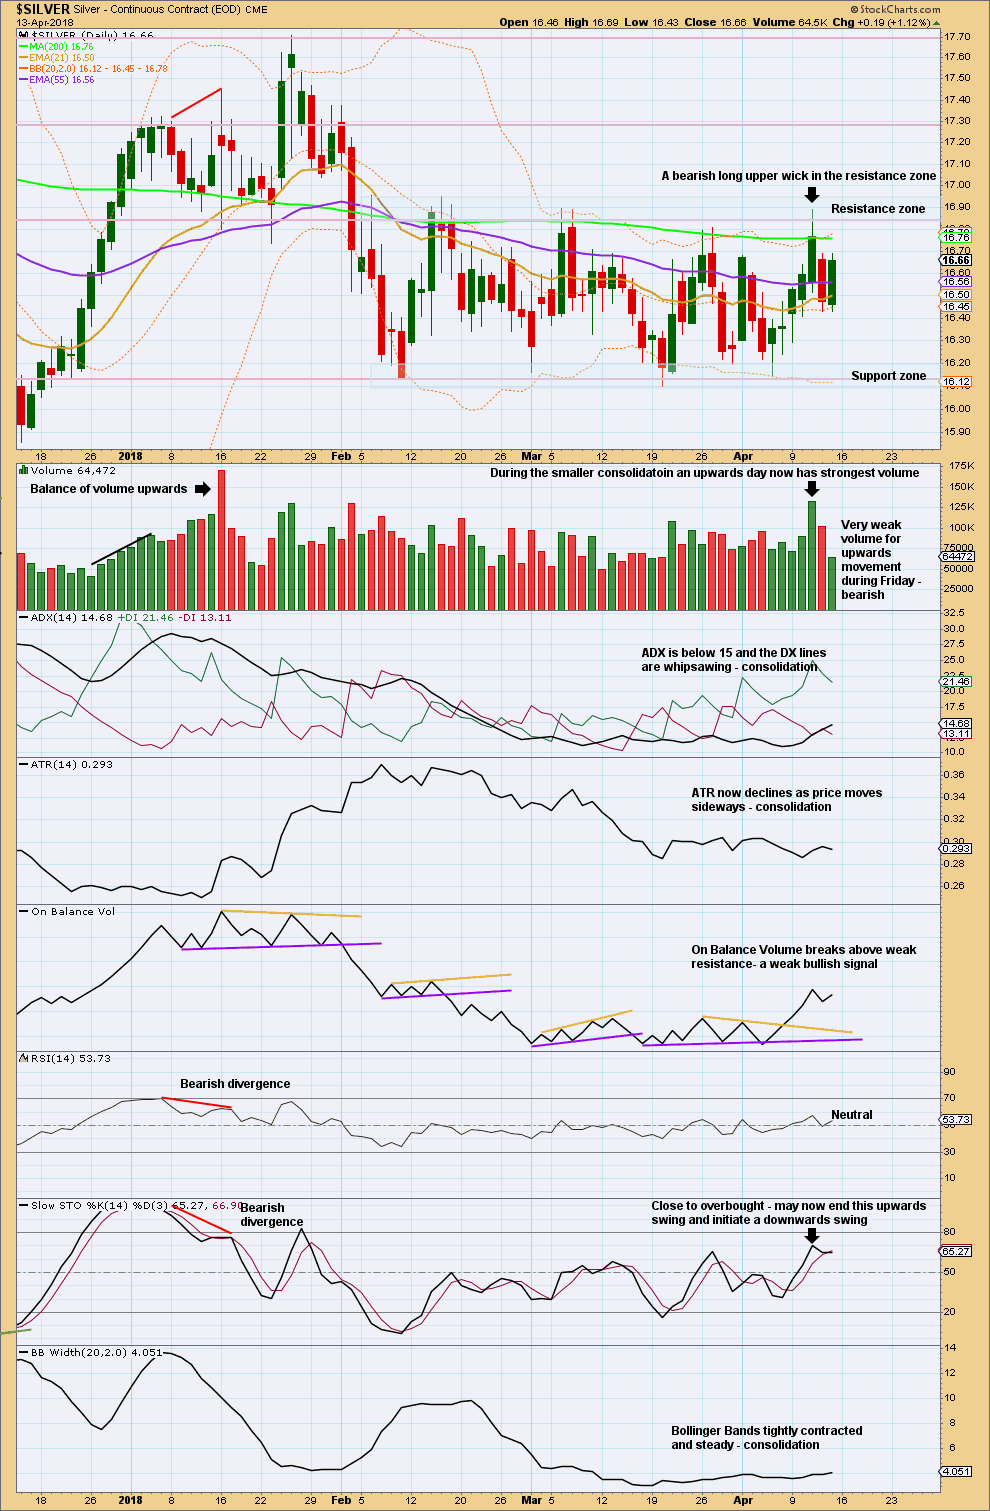
At the daily chart level, there is a smaller and clearer consolidation zone with resistance about 16.80 to 16.95 and support about 16.20 to 16.10. It is now an upwards day during this consolation that has strongest volume, suggesting an upwards breakout may be more likely than a downwards breakout. This does not always work, but it does work more often than it fails. This supports the second and alternate Elliott wave counts.
An upwards breakout should have support from volume for confidence. An upwards breakout would be an upwards day closing above resistance. A downwards breakout does not require support from volume, but when that happens it adds more confidence. A downwards breakout would be a downwards day closing below support.
Expect swings from resistance to support and back again while price remains within the consolidation. Do not expect price to move in a straight line, because that is not how price typically behaves within a consolidation.
Usually, Stochastics can be used during a consolidation to indicate when each swing ends. This is when Stochastics reaches overbought or oversold while price is at resistance or support. However, Stochastics is falling short of overbought and oversold in this current consolidation.
An upwards swing may have ended on the 11th of April. Price reached up into resistance and Stochastics was close to overbought. It seems reasonable now to expect a downwards swing to support. A lack of support for upwards movement during Friday’s session reinforces this view.
Published @ 07:56 p.m. EST on 14th April, 2018.
I’ve been away. Are we on the daily alternate?
No love for the Silver.