
The upwards breakout noted last week has turned out to be false. Price is back within the consolidation zone.
Summary: There is more support from volume for upwards movement. Look out for another upwards breakout next week. A new high now above 17.331 would offer strong support to this view. The next target is either 19.593 or 20.395.
The trend is up. Use pullbacks as an opportunity to join the trend.
Always trade with stops, and invest only 1-5% of equity on any one trade.
Last monthly charts can be viewed here.
New updates to this analysis are in bold.
ELLIOTT WAVE COUNTS
MAIN WAVE COUNT
WEEKLY CHART
Click chart to enlarge.
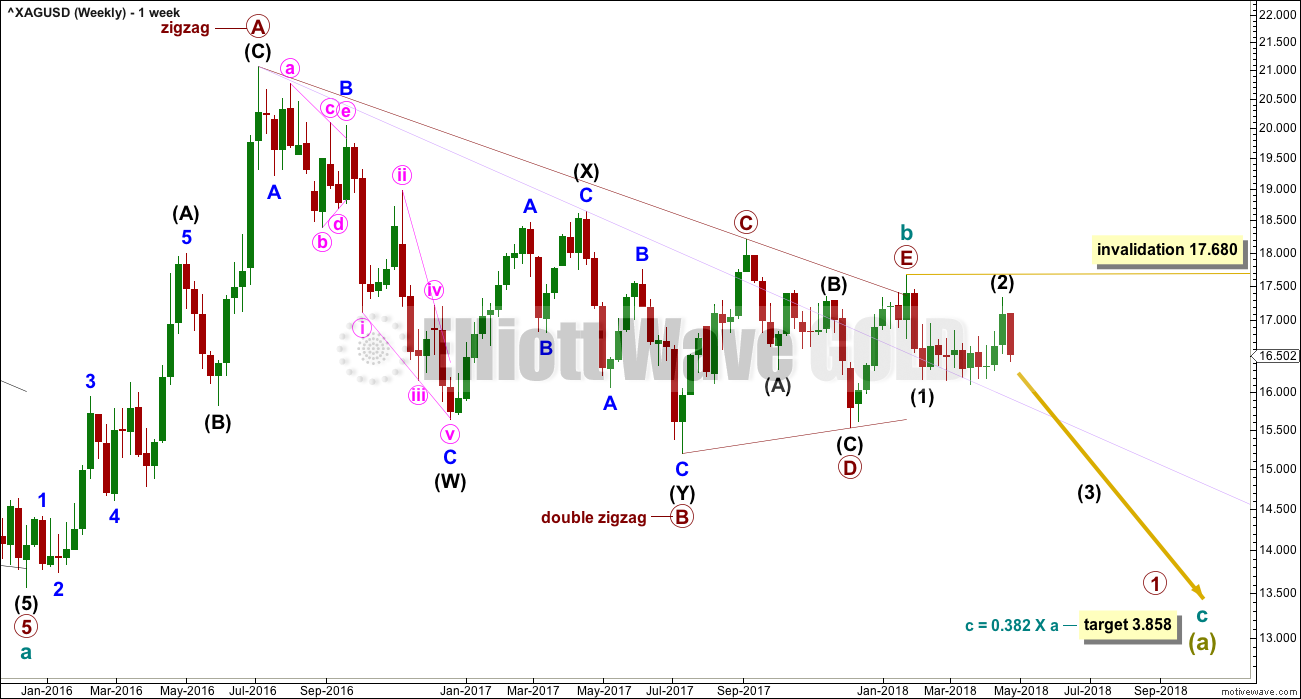
The main wave count expects that the bear market, which began from the April 2011 high, is incomplete.
Cycle wave a is seen as a five wave impulse for this main wave count. There are multiple corrective structures possible still for cycle wave b.
This first weekly chart sees cycle wave b as a now possibly complete regular contracting triangle.
Primary wave E of the triangle may have ended with an overshoot of the A-C trend line. If this wave count is correct, then price should have reversed already. Within the new downwards trend, no second wave correction may move beyond the start of the first wave above 17.680.
DAILY CHART
Click chart to enlarge.
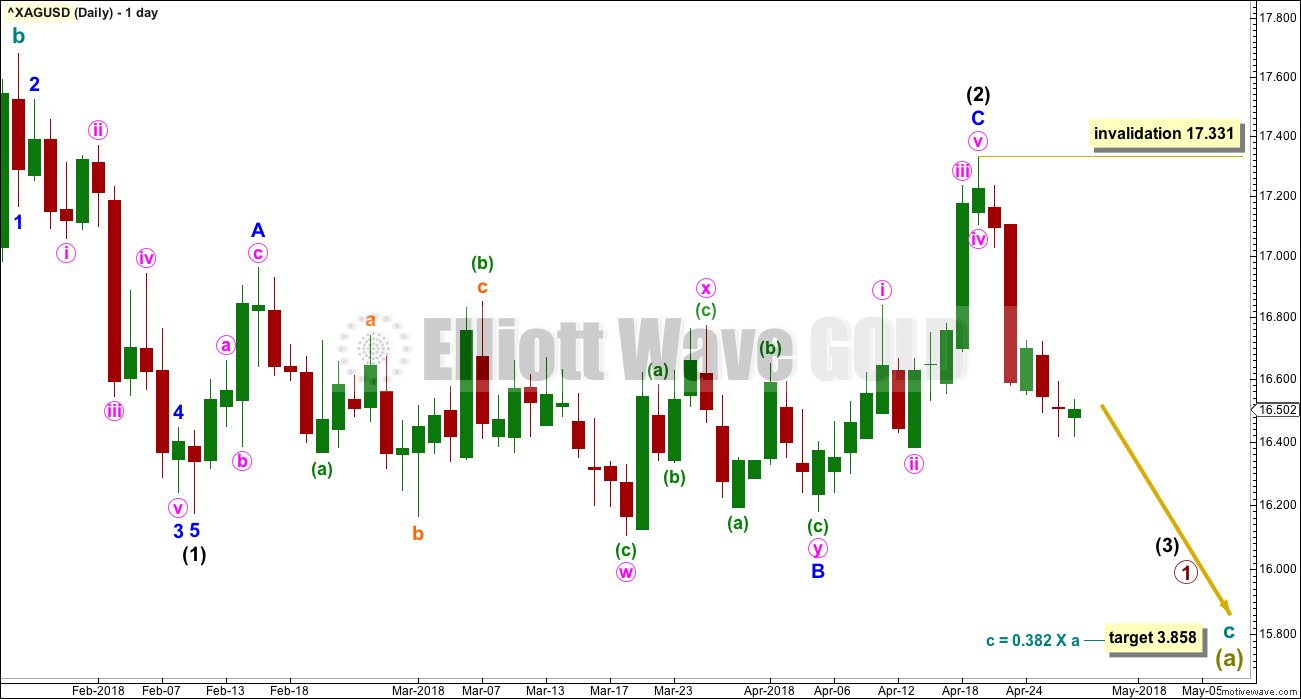
Intermediate wave (1) down subdivides well as a five wave structure.
Intermediate wave (2) may now be complete as a flat correction.
Minor wave B is a double zigzag. All subdivisions fit. However, the purpose of a second zigzag in a double is to deepen the correction when the first zigzag does not move price deep enough. Here, the second zigzag has failed to deepen the correction. This is not technically a truncation, but the effect is the same. This structure makes no sense because it has not achieved its purpose. This must necessarily reduce the probability of this wave count.
At this stage, this first wave count still has the lowest probability of the three wave counts published for Silver.
Within intermediate wave (3), no second wave correction may move beyond the start of its first wave above 17.331.
SECOND WAVE COUNT
WEEKLY CHART
Click chart to enlarge.
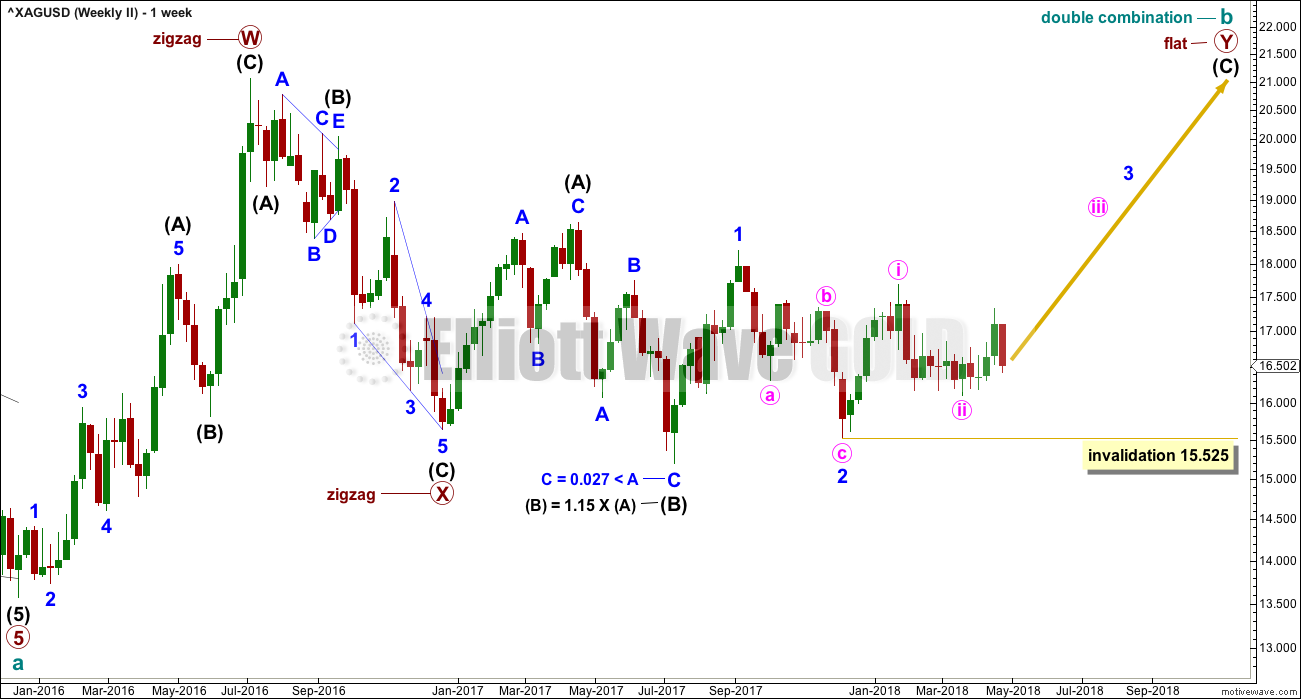
Cycle wave b may be completing as a double combination: zigzag – X – flat. The second structure, a flat correction for primary wave Y, may be underway.
Within a flat correction, intermediate wave (B) must retrace a minimum 0.9 length of intermediate wave (A) at 15.938. Intermediate wave (B) has met this minimum requirement; the rule for a flat correction is met. Intermediate wave (B) is longer than 1.05 times the length of intermediate wave (A) indicating this may be an expanded flat. Expanded flat corrections are the most common type. Normally their C waves are 1.618 or 2.618 the length of their A waves.
The purpose of combinations is to take up time and move price sideways. To achieve this purpose the second structure in the double normally ends about the same level as the first.
While the combination wave count at the weekly chart level does not currently work for Gold, it does still work for Silver. They do not have to complete the same structures for cycle wave b, and fairly often their structures are different.
Intermediate wave (C) for this wave count is starting out slowly, with deep time consuming second wave corrections. This may indicate very strong upwards movement ahead, with a time consuming and strong impulse to complete.
If minute wave ii continues lower, it may not move beyond the start of minute wave i below 15.525.
DAILY CHART
Click chart to enlarge.
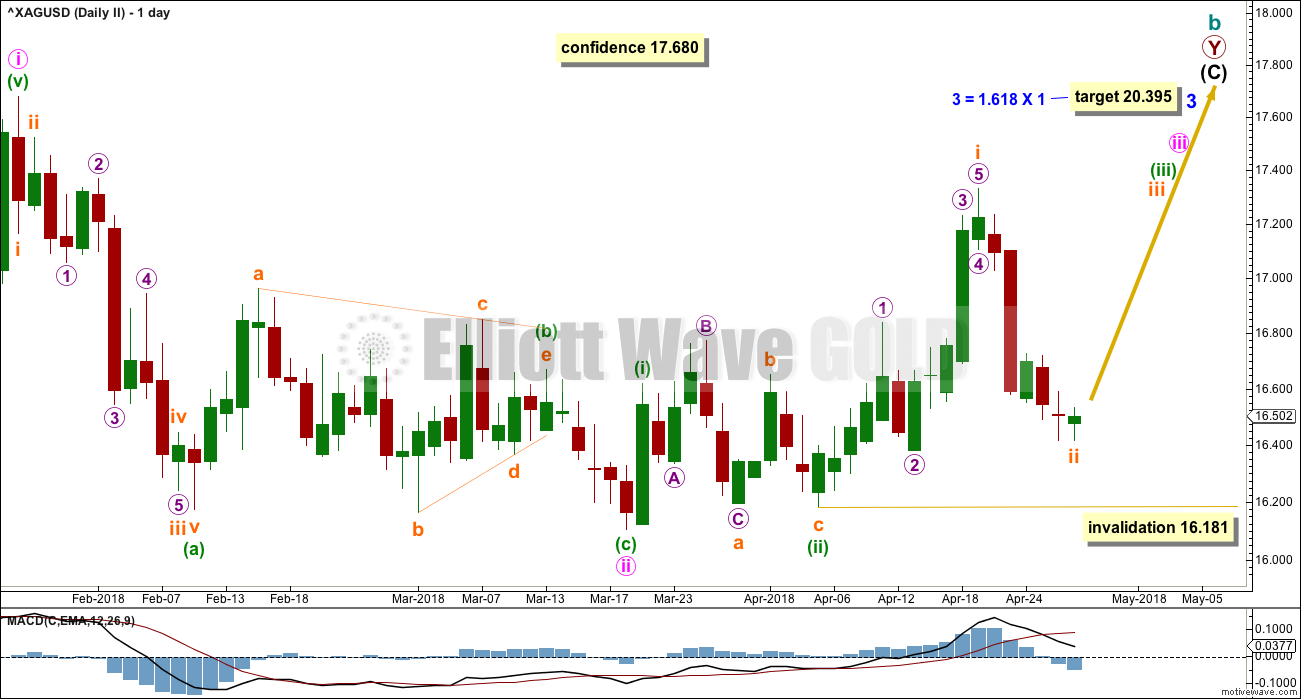
Minute wave ii looks most likely to be over. Minute wave iii may only subdivide as an impulse.
Within minute wave iii, minuette waves (i) and (ii) may be complete. Minuette wave (iii) may only subdivide as an impulse.
Within minuette wave (iii), subminuette wave i may be complete.
Subminuette wave ii may not move beyond the start of subminuette wave i below 16.181.
ALTERNATE WAVE COUNT
WEEKLY CHART
Click chart to enlarge.
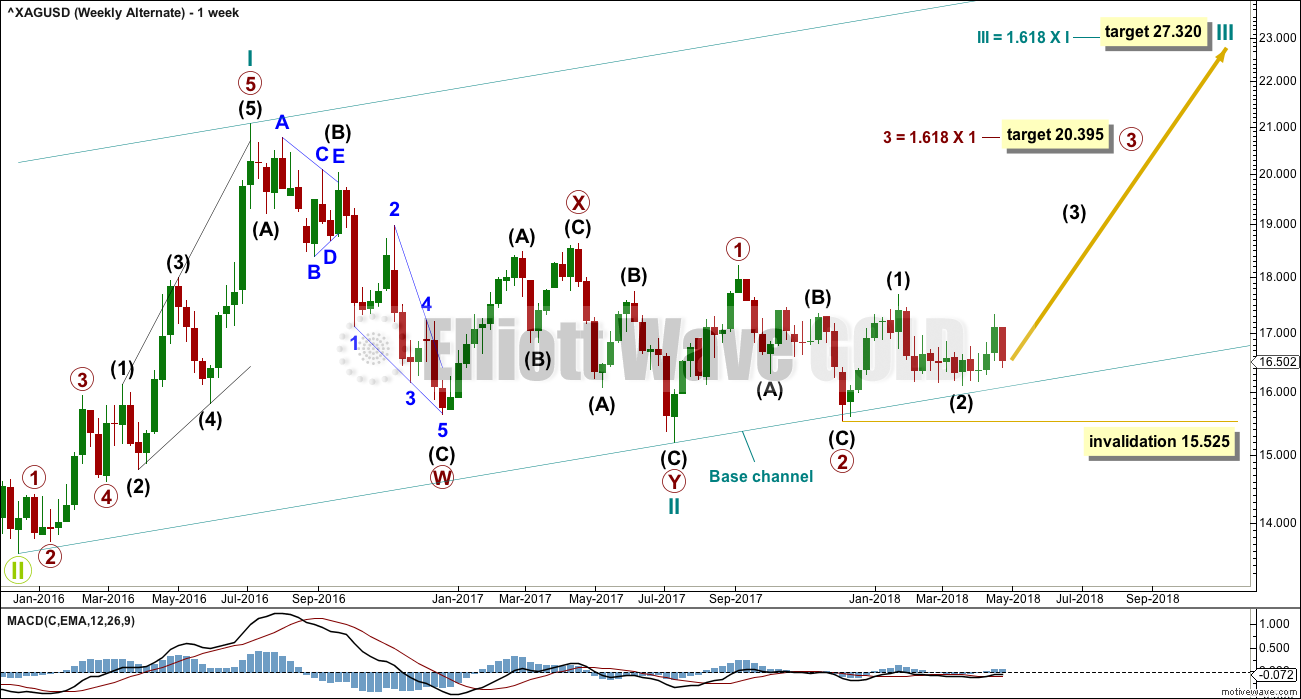
This alternate wave count looks at the possibility that the bear market may be over for Silver and a new bull market may have begun.
A series of three overlapping first and second waves may now be complete for cycle waves I and II, primary waves 1 and 2, and intermediate waves (1) and (2).
A third wave now at three large degrees may be beginning.
Targets calculated for third waves assume the most common Fibonacci ratios to their respective first waves. As price approaches each target, if the structure is incomplete or price keeps rising through the target, then the next Fibonacci ratio in the sequence would be used to calculate a new target.
Within primary wave 3, intermediate wave (2) may not move beyond the start of intermediate wave (1) below 15.525.
The large base channel about cycle waves I and II nicely shows where primary wave 2 found support. A lower degree second wave correction should find support (in a bull market) about a base channel drawn about a first and second wave one or more degrees higher. If this base channel is breached at the daily chart level with one full daily candlestick below and not touching it, then the probability of this alternate wave count would be reduced.
DAILY CHART
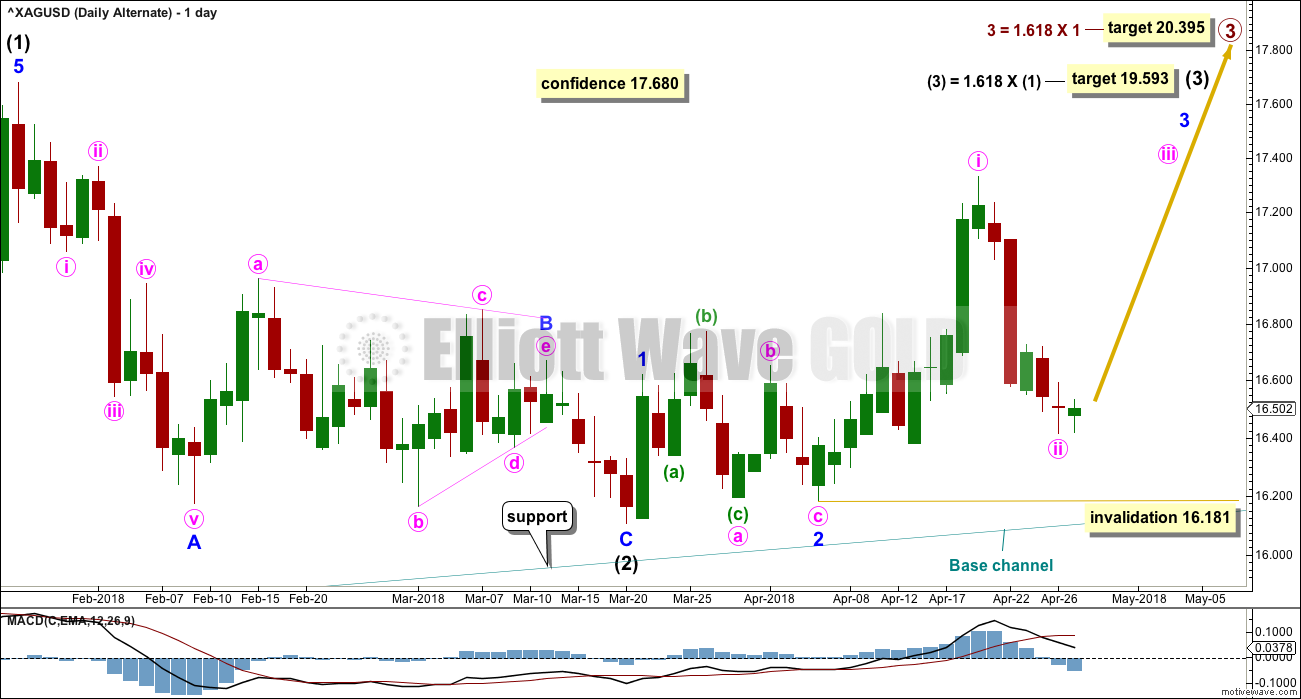
Click chart to enlarge.
Intermediate wave (2) should be over.
Intermediate wave (3) may only subdivide as an impulse. Within intermediate wave (3), minor waves 1 and 2 may be complete. Minor wave 3 would be incomplete. Minor wave 3 may only subdivide as an impulse.
Within minor wave 3, minute wave i may be complete. Minute wave ii may not move beyond the start of minute wave i below 16.181.
TECHNICAL ANALYSIS
WEEKLY CHART
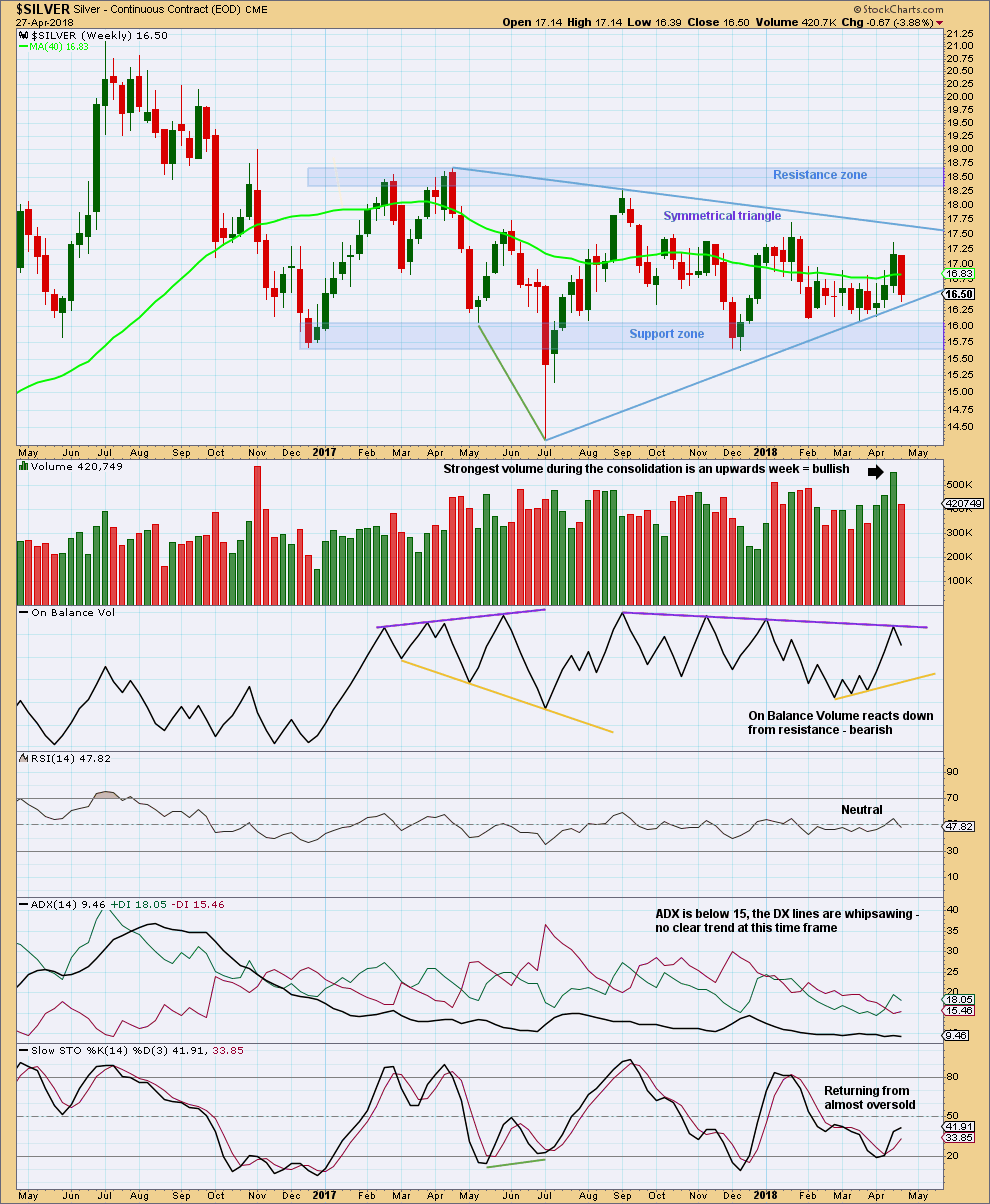
Click chart to enlarge. Chart courtesy of StockCharts.com.
Price remains within the support and resistance zone.
This week finds support at the lower edge of the triangle. The strongest week within the consolidation is the last upwards week. An upwards breakout now looks more likely than downwards. This expectation is now in line with what is expected for Gold.
DAILY CHART
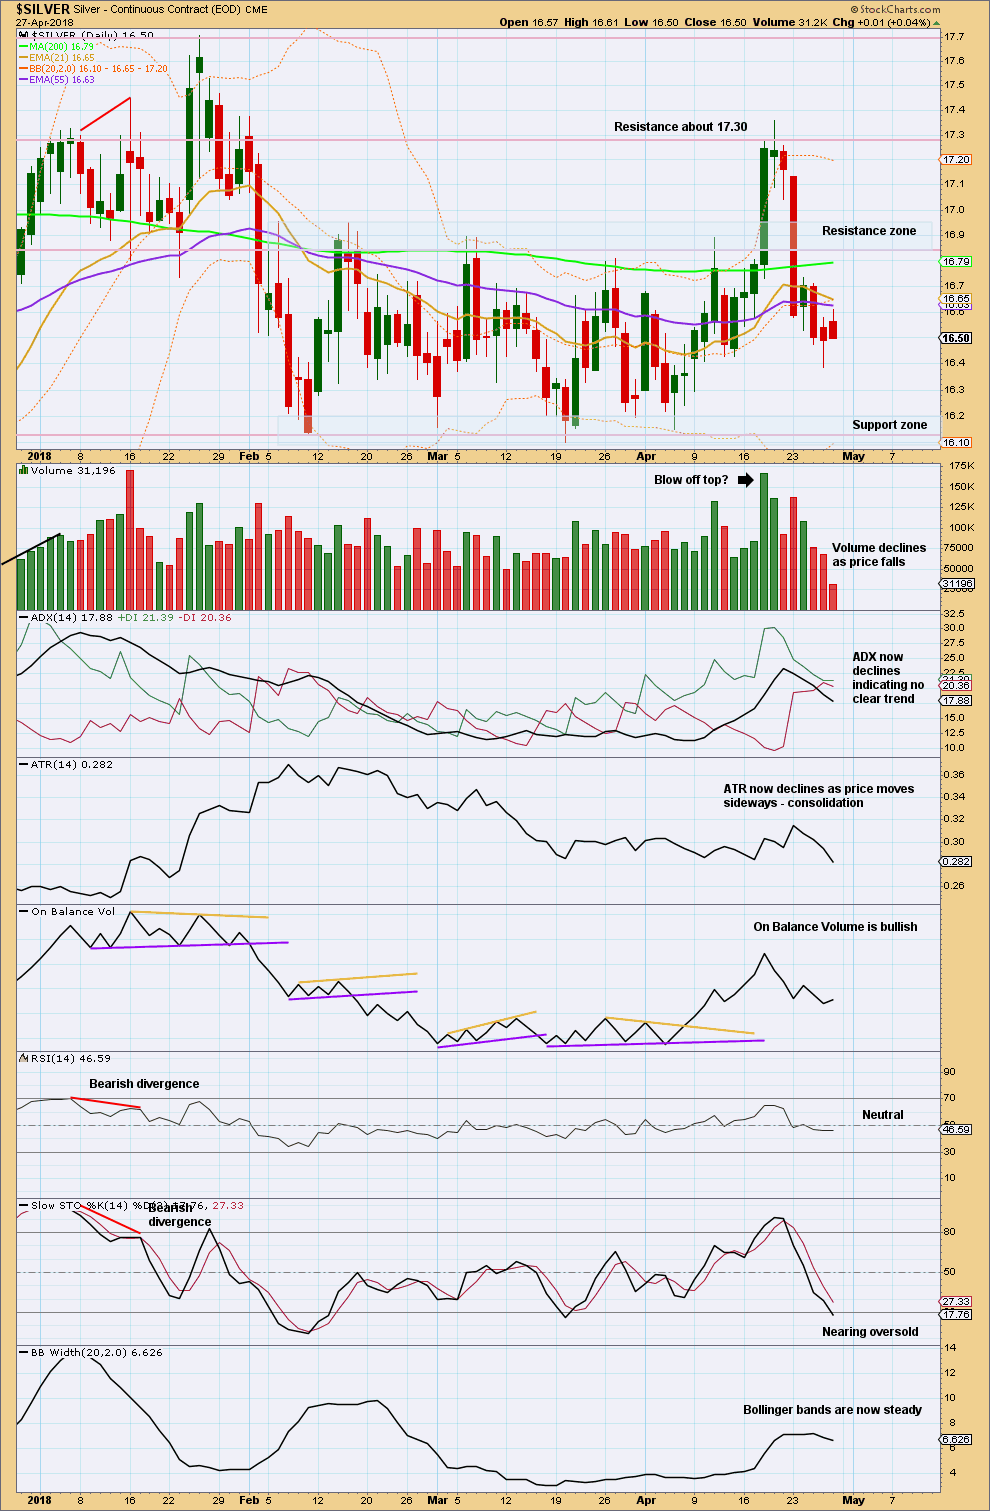
Click chart to enlarge. Chart courtesy of StockCharts.com.
The upwards breakout was false. Price returned quickly back into the consolidation zone. Volume still strongly favours an upwards breakout over a downwards breakout at the daily chart timeframe, as well as the weekly now.
Published @ 03:06 a.m. EST on 29th April, 2018.
Daily alternate update:
subdivisions the same as the second daily chart
here intermediate (2) may have continued sideways. the base channel is very close by, offering very strong support.
Second daily chart updated:
A slight new low below 16.181 today to 16.179 has invalidated my labelling published in this analysis.
Looking at this at the weekly chart level it loos like minute ii has continued sideways.
With Gold at support today and looking like it finally has a low in place, Silver may do so too. Both Gold and Silver indicate an upwards breakout via volume.
Any members particularly attentive to this wave count may notice the very small truncation at the end of minute ii:
Minuette (a) low is at 16.173. Minuette (c) low today is only 16.179, so it’s truncated by 0.006.
But the long lower wick developing on this last daily candlestick does suggest a low may be in place here.
Good on you for the early production of the weekly report and the silver analysis. I’ve been edgy about my modest long positions and I would not have the confidence to pursue the upside potential without the benefit of your analysis. Because the market seems exceptionally quirky I tend to get out too early with very small gains or with small losses when losses begin to show.
Best wishes to you for a good week.
A note to your legal counsel: I make my investment decisions independently and no third party is responsible if I make a costly mistake. 🙂
If you follow my risk management advice, you’ll ensure your account lives to trade on.
Of all the markets I analyse regularly Silver is the most difficult. And I see today it’s gone and invalidated the daily charts. That absolutely doesn’t mean the bullish case is discarded, only a new low below 15.525 would see me consider that.
Thank you. I do wish to adhere to your risk management advice. I wonder if you would consider a stop loss on silver of $15.53 to be about right. You’ve indicated a move below $15.525 would motivate you to reaccess the validity of the bullish bias in place now. I would be out at that point waiting for your next analysis. I would have no problem with a lower stop loss if it that makes sense. Are there any thoughts you wish to share.